




No CrossRef data available.
Article contents
- Abstract
- 1. INTRODUCTION
- 2. AN ILLUSTRATIVE EXAMPLE
- 3. RELATED PROCEDURES: SHRINKAGE-TYPE ESTIMATORS AND PENALIZED LEAST-SQUARES
- 4. REMARKS
- 5. CONCLUSION
- APPENDIX A: ASYMPTOTIC RESULTS FOR CONSISTENT MODEL SELECTION PROCEDURES
- APPENDIX B: ASYMPTOTIC RESULTS FOR CONSERVATIVE MODEL SELECTION PROCEDURES
- APPENDIX C: THE MAXIMAL ABSOLUTE BIAS AND THE MAXIMAL MSE ARE UNBOUNDED FOR GENERAL CONSISTENT MODEL SELECTION PROCEDURES
- References
MODEL SELECTION AND INFERENCE: FACTS AND FICTION
Published online by Cambridge University Press: 08 February 2005
Article contents
- Abstract
- 1. INTRODUCTION
- 2. AN ILLUSTRATIVE EXAMPLE
- 3. RELATED PROCEDURES: SHRINKAGE-TYPE ESTIMATORS AND PENALIZED LEAST-SQUARES
- 4. REMARKS
- 5. CONCLUSION
- APPENDIX A: ASYMPTOTIC RESULTS FOR CONSISTENT MODEL SELECTION PROCEDURES
- APPENDIX B: ASYMPTOTIC RESULTS FOR CONSERVATIVE MODEL SELECTION PROCEDURES
- APPENDIX C: THE MAXIMAL ABSOLUTE BIAS AND THE MAXIMAL MSE ARE UNBOUNDED FOR GENERAL CONSISTENT MODEL SELECTION PROCEDURES
- References
Abstract
Model selection has an important impact on subsequent inference. Ignoring the model selection step leads to invalid inference. We discuss some intricate aspects of data-driven model selection that do not seem to have been widely appreciated in the literature. We debunk some myths about model selection, in particular the myth that consistent model selection has no effect on subsequent inference asymptotically. We also discuss an “impossibility” result regarding the estimation of the finite-sample distribution of post-model-selection estimators.
Information
- Type
- Research Article
- Information
- Copyright
- © 2005 Cambridge University Press
1. INTRODUCTION
In this expository article we discuss some of the problems that arise if one tries to conduct statistical inference in the presence of data-driven model selection. The position we hence take is that a (finite) collection of competing models is given, typically submodels obtained from an overall model through parameter restrictions, and that the researcher uses the data to select one of the competing models.1
We assume throughout that at least one of the competing models is capable of correctly describing the data generating process. We do not touch upon the important question of model selection in the context of fitting only approximate models.
In this paper we do not wish to enter into a discussion of whether or not a two-step procedure as described previously can be justified from a purely decision-theoretic point of view (although we touch upon this important question in the discussion of the mean-squared error of post-model-selection estimators in Sections 2.1 and 2.2 and also in Remark 4.1, which follows). We rather take the pragmatic position that such procedures, explicitly acknowledged or not, are prevalent in applied econometric and statistical work and that one needs to look at their true sampling properties and related questions of inference post model selection. Despite the importance of this problem in econometrics and statistics, research on this topic has been neglected for decades, exceptions being the pretest literature as summarized in Judge and Bock (1978) or Giles and Giles (1993), on the one hand, and the contributions regarding distributional properties of post-model-selection estimators by, e.g., Sen (1979), Sen and Saleh (1987), Dijkstra and Veldkamp (1988), and Pötscher (1991), on the other hand.2
The pretest literature as summarized in Judge and Bock (1978) or Giles and Giles (1993) concentrates exclusively on second moment properties of pretest estimators and does not provide distributional results.
The aim of this paper is to point to some intricate aspects of data-driven model selection that do not seem to have been widely appreciated in the literature or that seem to be viewed too optimistically. In particular, we demonstrate innate difficulties of data-driven model selection. Despite occasional claims to the contrary, no model selection procedure—implemented on a machine or not—is immune to these difficulties. The main points we want to make and that will be elaborated upon subsequently can be summarized as follows.3
Some of the issues we raise here may not apply in the (relatively trivial) case where one selects between “well-separated” model classes, i.e., model classes that have positive minimum distance, e.g., in the Kullback–Leibler sense.
1. Regardless of sample size, the model selection step typically has a dramatic effect on the sampling properties of the estimators that can not be ignored. In particular, the sampling properties of post-model-selection estimators are typically significantly different from the nominal distributions that arise if a fixed model is supposed.
2. As a consequence, naive use of inference procedures that do not take into account the model selection step (e.g., using standard t-intervals as if the selected model had been given prior to the statistical analysis) can be highly misleading.
3. An increasingly frequently used argument in the literature is that consistent model selection procedures allow one to employ the standard asymptotic distributions that would apply if no model selection were performed and that thus the effects of consistent model selection on inference can be safely ignored.4
For example, Bunea (2004), Dufour, Pelletier, and Renault (2003, Sect. 7); Fan and Li (2001), Hall and Peixe (2003, Theorem 3), Hidalgo (2002, Theorem 3.4), and Lütkepohl (1990, p. 120) to mention a few.
With hindsight the second author regrets having included Lemma 1 in Pötscher (1991) at all, as this lemma seems to have contributed to popularizing the aforementioned unwarranted conclusion in the literature. Given that this lemma was included, he wishes at least that he had been more guarded in his wording in the discussion of this lemma and that he had issued a stronger warning against an uncritical use of it.
4. More generally, regardless of whether a consistent or a conservative6
That is, a procedure that asymptotically selects only correct models but possibly overparameterized ones.
5. The finite-sample distributions of post-model-selection estimators are typically complicated and depend on unknown parameters. Estimation of these finite-sample distributions is “impossible” (even in large samples). No resampling scheme whatsoever can help to alleviate this situation.
To facilitate a detailed analysis of the effects of selecting a model from a collection of competitors we assume in this paper—as already noted earlier—that one of the competing models is capable of correctly describing the data generating process. Of course, it can always be debated whether or not such an assumption leads to a “test-bed” that is relevant for empirical work, but we shall not pursue this debate here (see, e.g., the contribution of Phillips, 2005, in this issue). The important question of the effects of model selection when selecting only from approximate models will be studied elsewhere.
The points listed previously will be exemplified in detail in Section 2 in the context of a very simple linear regression model, although they are valid on a much wider scope. Because of its simplicity, this example is amenable to a small-sample and also to a large-sample analysis, allowing one to easily get insight into the complications that arise with post-model-selection inference; for results in more general frameworks see Pötscher (1991), Leeb and Pötscher (2003a, 2003b, 2004), and Leeb (2003a, 2003b). Consistent model selection procedures are discussed in Section 2.1, whereas Section 2.2 deals with conservative procedures. Section 2.3 is devoted to the question of estimating the finite-sample distribution of post-model-selection estimators. Shrinkage-type estimators such as Lasso-type estimators, Bridge estimators, and the smoothly clipped absolute deviation (SCAD) estimator, etc., are briefly discussed in Section 3. Section 4 contains some remarks, and Section 5 concludes. Some technical results and their proofs are collected in the Appendixes.
2. AN ILLUSTRATIVE EXAMPLE
In the following discussion we shall—for the sake of exposition—use a very simple example to illustrate the issues involved in model selection and inference post model selection. These issues, however, clearly persist also in more complicated situations such as, e.g., nonlinear models, time series models, etc. Consider the linear regression model

under the “textbook” assumptions that the errors εt are independent and identically distributed (i.i.d.) N(0,σ2), σ2 > 0, and the nonstochastic n × 2 regressor matrix X has full rank and satisfies X′X/n → Q > 0 as n → ∞. For simplicity, we shall also assume that the error variance σ2 is known.7
Nothing substantial changes because of this convenience assumption. The entire discussion that follows can also be given for the unknown σ2 case. See Leeb and Pötscher (2003a) and Leeb (2003a, 2003b).

The elements of this matrix depend on sample size n, but we shall suppress this dependence in the notation. The elements of the limit of this matrix will be denoted by σα,∞2, etc. It will prove useful to define ρ = σα,β /(σασβ), i.e., ρ is the correlation coefficient between the least-squares estimators for α and β in model (1). Its limit will be denoted by ρ∞.
Suppose now that the parameter of interest is the coefficient α in (1) and that we are undecided whether or not to include the regressor xt2 in the model a priori. (The case where a general linear function A(α,β)′, e.g., a predictor, rather than α is the quantity of interest is quite similar and is briefly discussed in Remark 4.5.) In other words, we have to decide on the basis of the data whether to fit the unrestricted (full) model or the restricted model with β = 0. We shall denote the two competing candidate models by U and R (for unrestricted and restricted, respectively). For any given value of the parameter vector (α,β), the most parsimonious true model will be denoted by M0 and is given by

It is important to note that M0 depends on the unknown parameters (namely, through β). The least-squares estimators for α and β in the unrestricted model will be denoted by

, respectively. The least-squares estimator for α in the restricted model will be denoted by

, and we shall set

. We shall decide between the competing models U and R depending on whether the test statistic

or not, where c > 0 is a user-specified cutoff point. That is, we shall use the model

, and we shall work with

otherwise. This is a traditional pretest procedure based on the likelihood ratio, but it is worth noting that in the simple example discussed here it coincides exactly with Akaike's minimum AIC rule in case

and with Schwarz's minimum BIC rule if

. (We note here in passing that there is a close connection between pretest procedures and information criteria in general; see Remark 4.2.) In fact, in the present example it seems that there is little choice with regard to the model selection procedure other than the choice of c, as it is hard to come up with a reasonable model selection procedure that is not based on the likelihood ratio statistic (at least asymptotically). Now that we have defined the model selection procedure

, the resulting post-model-selection estimator for the parameter of interest α will be denoted by

; i.e.,

The following simple observations will be useful: The finite-sample distribution of

is a convex combination of the conditional distributions, where the conditioning is on the outcome of the model selection procedure

:

where Pn,α,β denotes the probability measure corresponding to the true parameters α, β and sample size n. The model selection probabilities

can be evaluated easily and are given by

where Φ(·) denotes the standard normal cumulative distribution function (c.d.f.). Cf. Leeb and Pötscher (2003a, Sect. 3.1) and Leeb (2003b, Sect. 3.1).
The subsequent discussion is cast in terms of consistent versus conservative model selection procedures, because this is entrenched terminology.8
In fact, it would be more precise to talk about consistent (or conservative) sequences of model selection procedures.
2.1. The Consistent Model Selection Framework
As mentioned in the introduction, proceeding with inference post model selection “as usual” (i.e., as if the selected model were given a priori) is often defended by the argument that a consistent model selection procedure has been used and hence asymptotically the selected model would coincide with the most parsimonious true model, supposedly allowing one to use the standard asymptotic results that apply in case of an a priori fixed model. We now look more closely at the merit of such an argument.
We assume in this section that the cutoff point c in the definition of the model selection procedure

is chosen to depend on sample size n such that

. Then it is well known (see Bauer, Pötscher, and Hackl, 1988; and also Remark 4.3) that the model selection procedure is a consistent procedure in the sense that

holds for every α, β; i.e., the probability of revealing the most parsimonious true model tends to unity as sample size increases. Because the event

is clearly contained in the event

, the consistency property expressed in (4) moreover immediately entails that

holds for every α, β, where

denotes the least-squares estimator in the most parsimonious true model. Although this latter “estimator” is infeasible as it makes use of the unknown information whether or not β = 0, relation (5) shows that the post-model-selection estimator

is a feasible version in the sense that both estimators coincide with probability tending to unity as sample size increases. An immediate consequence of (5) is that the (pointwise) asymptotic distributions of

are identical, regardless of whether M0 = U or M0 = R. This latter property, which is sometimes called the “oracle” property (Fan and Li, 2001), obviously holds for post-model-selection estimators obtained through consistent model selection procedures in general; cf. Pötscher (1991, Lemma 1) for a formal statement.
9This property of consistent model selection procedures has already been observed by Hannan and Quinn (1979, p. 191). It has since been rediscovered several times in special instances; cf. Ensor and Newton (1988, Theorem 2.1); Bunea (2004, Sect. 4).
So far the preceding discussion seems to support the argument that proceeding “as usual” with inference post consistent model selection is justified. In particular, it seems to suggest that the usual construction of confidence sets remains valid post consistent model selection. Furthermore, observe that (5) entails that the post-model-selection estimator

is asymptotically normally distributed and is as “efficient” as the maximum likelihood estimator based on the full model if the full model is the most parsimonious true model (i.e., if β ≠ 0), and is more “efficient” (namely, as “efficient” as the maximum likelihood estimator based on the restricted model) if the restricted model is the most parsimonious one (i.e., if β = 0). This seems too good to be true, and, in fact, it is! Although the result in (5) is mathematically correct, it is a delusion to believe that it carries much statistical meaning. Before we explore this in detail, a little reflection shows that the post-model-selection estimator

is nothing else than a variant of Hodges' so-called superefficient estimator (cf. Lehmann and Casella, 1998, pp. 440–443).
10Hodges' estimator (with a = 0 in the notation of Lehmann and Casella, 1998) is a post-model-selection estimator based on a model selection procedure that consistently chooses between an N(0,1) and an N(θ,1) distribution.
Exceptions are Hosoya (1984), Shibata (1986), Pötscher (1991), and Kabaila (1995, 1996), who explicitly note this problem.

is not properly reflected by the (pointwise) asymptotic results; in fact, these results can be highly misleading regardless of the sample size and tend to paint an overly optimistic picture of the performance of the estimator. Mathematically speaking, the culprit is nonuniformity (w.r.t. the true parameter vector (α,β)) in the convergence of the finite-sample distributions to the corresponding asymptotic distributions; cf. the warning already issued in Pötscher (1991) in the discussion following Lemma 1 and also in Section 4, Remark (iii), of that paper.
In the simple example discussed here even a finite-sample analysis is possible that allows us to nicely showcase the problems involved.
12For a detailed treatment of the finite-sample properties of post-model-selection estimators in linear regression models see Leeb and Pötscher (2003a), Leeb (2003a, 2003b).

of selecting the most parsimonious true model. From (3) this probability equals Φ(c) − Φ(−c) if β = 0, which—in accordance with (4)—goes to unity as sample size increases because we have assumed c → ∞ in this section. In case β ≠ 0, the probability equals

and—again in accordance with (4)—converges to unity as n → ∞. This is so because

, so that the arguments of the Φ-functions in this formula converge either both to +∞ or both to −∞. Nevertheless, the probability of selecting the most parsimonious true model can be very small for any given sample size if β ≠ 0 is close to zero. In that case, we see that this probability is close to 1 − (Φ(c) − Φ(−c)), which in turn is close to zero because of c → ∞. More precisely, if β ≠ 0 equals

, then—despite (4)—the probability of selecting the most parsimonious true model in fact converges to zero!
13Slightly more general conditions under which this is true are given in Proposition A.1 in Appendix A.

. In particular, this reveals that the convergence in (4) is decidedly nonuniform w.r.t. β: In other words, for the asymptotics to “kick in” in (4) arbitrarily large sample sizes are needed depending on the value of the parameter β. This means that

, although being consistent for M0, is not uniformly consistent (not even locally). (This is in fact true for any consistent model selection procedure; see Remark 4.4.) We illustrate this now numerically. In the following discussion, it proves useful to write γ as shorthand for

, i.e., to reparameterize β as

. As a function of γ, the probability of selecting the unrestricted model (which is the most parsimonious true model in case β ≠ 0) is pictured in Figure 1. Recall that with the choice

our model selection procedure coincides with the minimum BIC method.

Finite-sample model selection probability. The probability of selecting the unrestricted model as a function of for various values of n, where we have taken . Starting from the top, the curves show for n = 10k for k = 1,2,…,6. Note that is independent of α and symmetric around zero in β or, equivalently, γ.
Figure 1 confirms that the probability of selecting the correct model can be very small if β ≠ 0 is of the order

and also suggests that this effect even gets stronger as the sample size increases. The latter observation is explained by the fact that the probability of selecting the correct model converges to zero not only for β ≠ 0 of the order

but even for β ≠ 0 of larger order, namely, for β of the form

; cf. Proposition A.1 in Appendix A. Furthermore, we can also calculate, for given β ≠ 0, how many data points are needed such that the probability of selecting the correct (i.e., the unrestricted) model is at least 0.9, say. With

as in Figure 1, we obtain: If β/σβ = 1, then a sample of size n ≥ 8 is needed; if

, one needs n ≥ 42; if

, one needs n ≥ 207; and if

, then n ≥ 977 is required. This demonstrates that the required sample size heavily depends on the unknown β and increases without bound as β gets closer to zero.
The phenomenon discussed here occurs only if the parameter β ≠ 0 is “small” in absolute value in the sense that it goes to zero of a certain order.
14It can be debated whether the β's giving rise to this phenomenon are justifiably viewed as “small”: The phenomenon can, e.g., arise if β ≠ 0 satisfies

with |ζ| < 1 (cf. Proposition A.1 in Appendix A). Although such sequences of β's converge to zero by the assumption

maintained in Section 2.1, the “nonzeroness” of any such β can be detected with probability approaching unity by a standard test with fixed significance level or equivalently, with fixed cutoff point, and thus such β's could justifiably be classified as “far” from zero. (In more mathematical terms, Pn,α,β is not contiguous w.r.t. Pn,α,0 for such β's.) By the way, this also nicely illustrates that the consistent model selection procedure is (not surprisingly) less powerful in detecting β ≠ 0 compared with the conservative procedure with a fixed value of c, the reason being that the consistent procedure has to let the significance level of the test approach zero to asymptotically avoid choosing a model that is too large. (This loss of power is not specific to the consistent model selection procedure discussed here but is typical for consistent model selection procedures in general.)

is consistent, even uniformly consistent (cf. Proposition A.9 in Appendix A), and satisfies

as n → ∞ (where OP is understood relative to Pn,α,β for fixed α and β). However, given that the consistent model selection procedure is “blind” to deviations from the restricted model of the order

(and even to deviations of larger order), it should not come as a surprise that the phenomenon discussed previously crops up again in the distribution of

. Recall that, as a consequence of (5),

is asymptotically normally distributed with mean zero and variance equal to the asymptotic variance of the restricted least-squares estimator if β = 0 and equal to the asymptotic variance of the unrestricted least-squares estimator if β ≠ 0. However, in finite samples—regardless of how large—we get a completely different picture: From Leeb (2003b), we obtain that the finite-sample density of

is given by

where φ(·) denotes the standard normal probability density function (p.d.f.). Furthermore, we have used Δ(a,b) as shorthand for Φ(a + b) − Φ(a − b), where Φ denotes the standard normal c.d.f. Note that Δ(a,b) is symmetric in its first argument. The finite-sample density of

does not depend on α and is the sum of two terms: The first term is the density of

multiplied by the probability of selecting the restricted model. The second term is a “deformed” version of the density of

, where the deformation factor is given by the 1 − Δ(·,·)-term.
15In light of (2), the first term is actually the conditional density of

given the event that the pretest does not reject multiplied by the probability of this event. Because the test statistic is independent of

(Leeb and Pötscher, 2003a, Proposition 3.1), this conditional density reduces to the unconditional one. Similarly, the second term is the conditional density of

given that the pretest rejects multiplied by the probability of this event. Because the test statistic is typically correlated with

, the conditional density is not normal, which is reflected by the “deformation” factor.

.

Finite-sample densities. The density gn,α,β of for various values of β/σβ. For the graphs, we have taken n = 100, , and σα2 = 1. The four curves correspond to β/σβ equal to 0, 0.21, 0.25, and 0.5 and are discussed in the text.
Two of the densities in Figure 2 are unimodal: The one with the larger mode arises for β/σβ = 0 and is quite close to the (normal) density of

corresponding to the restricted model. The reason for this is that the probability Δ(0,c) of selecting the restricted model is large, namely, 0.968, and hence the first term in (6) is the dominant one. The density with the smaller mode arises for β/σβ = 0.5 and closely resembles the density of

corresponding to the unrestricted model. The reason here is (i) that the probability of selecting the unrestricted model is large, namely, 0.998, and hence the second term in (6) is dominant and (ii) that this dominant term is approximately Gaussian; more precisely, the second term in (6) is approximately equal to φ(u)(1 − Δ(7 + 0.98u,3)), which differs from φ(u) in absolute value by less than 0.002. The bimodal densities correspond to the cases β/σβ = 0.21 and β/σβ = 0.25. In both cases, the left-hand mode reflects the contribution of the first term in (6) whereas the right-hand mode reflects the contribution of the second term. The height of the left-hand mode is proportional to the probability of selecting the restricted model, which is larger for β/σβ = 0.21 than for β/σβ = 0.25. In summary, we see that the finite-sample distribution of

depends heavily on the value of the unknown parameter β (through β/σβ) and that it is far from its Gaussian large-sample limit distribution for certain values of β. The same phenomenon is also found if we repeat the calculations for other sample sizes n, regardless of how large n is. In other words: Although the distribution of

is approximately Gaussian for each given (α,β) and sufficiently large sample size, the amount of data required to achieve a given accuracy of approximation depends on the unknown β. In the example presented in Figure 2, a sample size of 100 appears to be sufficient for the normal approximation predicted by pointwise asymptotic theory to be reasonably accurate in the cases β/σβ = 0 and β/σβ = 0.5, whereas it is clearly insufficient in case β/σβ = 0.21 or β/σβ = 0.25.
How can this be reconciled with the result mentioned earlier that

has an asymptotic normal distribution with mean zero and appropriate variance? The crucial observation again is that this limit result is a pointwise one; i.e., it holds for each fixed value of the parameter vector (α,β) individually but does not hold uniformly w.r.t. (α,β) (in fact, not even locally uniformly): While it is easy to see that for every

the density gn,α,β(u) given by (6) converges to the appropriate normal density for each fixed (α,β), it is equally easy to see (cf. Proposition A.2 in Appendix A) that (6) has a different asymptotic behavior if, e.g.,

with γ ≠ 0. In this case (6) converges to a shifted version of the density of the asymptotic distribution of

, the shift being controlled by γ. Yet another asymptotic behavior is obtained if we consider

with γn → ∞ (or γn → −∞) but γn = o(c). Then gn,α,β(u) even converges to zero for every

! That is, the distribution of

does not “stabilize” as sample size increases but—loosely speaking—“escapes” to ∞ or −∞ (depending on the sign of γn); in fact,

or −∞ in Pn,α,β-probability. More complicated asymptotic behavior is in fact possible and is described in Proposition A.2 in Appendix A.
16A quick alternative argument showing that the convergence of the finite-sample c.d.f.s of post-model-selection estimators is typically not uniform runs as follows: Equip the space of c.d.f.s with a suitable metric (e.g., a metric that generates the topology of weak convergence). Observe that the finite-sample c.d.f.s typically depend continuously on the underlying parameters, whereas their (pointwise) limits typically are discontinuous in the underlying parameters. This shows that the convergence can not be uniform.
We are now in a position to analyze the actual coverage properties of confidence intervals that are constructed “as usual,” thereby ignoring the presence of model selection (this step seemingly being justified by a reference to (5)). Let

denote the “naive” confidence interval that is given by the usual confidence interval in the restricted (unrestricted) model if the restricted (unrestricted) model is selected. That is,

if

and

if

where 1 − η denotes the nominal coverage probability and zη is the (1 − η/2) quantile of a standard normal distribution. In view of (2), the actual coverage probability satisfies

Using the remark in note 15 in the notes section, it is an elementary calculation to obtain

Note that the coverage probability does not depend on α and is symmetric around zero as a function of β. Because of (5) and the attending discussion, pointwise asymptotic theory tells us that the coverage probability

converges to 1 − η for every (α,β). However, the plots of the coverage probability given in Figure 3 speak another language.

Finite-sample coverage probabilities. The coverage probability of the “naive” confidence interval with nominal confidence level 1 − η = 0.95 as a function of for various values of n, where we have taken and ρ = 0.7. The curves are given for n = 10k for k = 1,2,…,7; larger sample sizes correspond to curves with a smaller minimal coverage probability.
We see that the actual coverage probability of the “naive” interval

is often far below its nominal level of 0.95, sometimes falling below 0.3. Figure 3 also suggests that this phenomenon gets more pronounced when sample size increases! In fact, it is not difficult to see that the minimal coverage probability of

converges to zero as sample size increases and not to the nominal coverage probability 1 − η as one might have hoped for (except possibly in the relatively special case ρ∞ = 0); cf. also Kabaila (1995). To see this, note that

where α is arbitrary and γn is chosen such that γn → ∞ (or γn → −∞) and γn = o(c). (The r.h.s. in the preceding inequality does actually not depend on α in view of (10).) Because

converges to zero as discussed earlier (cf. Proposition A.1 in Appendix A), we arrive—using (9) and (10)—at

the last equality being true because |γn| → ∞ (and because we have excluded the case ρ∞ = 0).
We finally illustrate the impact of model selection on the (scaled) bias and the (scaled) mean-squared error of the estimator (again excluding for simplicity of discussion the case ρ∞ = 0). Let Bias denote the expectation and MSE the second moment of

. We discuss the bias first. An explicit formula for the bias can be obtained from (6) by a tedious but straightforward computation and is given by

A pointwise (i.e., for fixed (α,β)) asymptotic analysis tells us that this bias vanishes asymptotically.
17Although this fits in nicely with (5), it is not a direct consequence of (5). The crucial point here is that

converges to zero exponentially fast for fixed β ≠ 0; see, e.g., Lemma B.1 in Leeb and Pötscher (2003a).

. Note that the bias is independent of α and antisymmetric around zero in β or, equivalently, γ (and hence is shown only for γ ≥ 0).

Finite-sample bias. The expectation of , i.e., the (scaled) bias of the post-model-selection estimator for α, as a function of for various values of n, where we have taken , ρ = 0.7, and σα2 = 1. The curves are given for n = 10k for k = 1,2,…,7; larger sample sizes correspond to curves with larger maximal absolute biases.
Figure 4 demonstrates that—contrary to the prediction of pointwise asymptotic theory—the bias can be quite substantial if β is of the order

and that this effect gets more pronounced as the sample size increases (the reason for this discrepancy again being nonuniformity in the pointwise asymptotic results). An asymptotic analysis of (11) using

with γ ≠ 0 shows that the bias converges to −σα ρ∞γ (see Proposition A.4 in Appendix A for more information). Note that this limit corresponds to the “envelope” of the finite-sample bias curves (for all n) as indicated in Figure 4. Furthermore, if

with γn → ∞ (or γn → −∞) but γn = o(c), the asymptotic analysis in Proposition A.4 even shows that the bias converges to ±∞, the sign depending on the sign of γn. As a consequence, the maximal absolute bias in fact grows without bound as sample size increases!
Turning to the MSE we encounter a similar situation. Using the fact that the test statistic

is independent of

(e.g., Leeb and Pötscher, 2003a, Proposition 3.1) and that

, the MSE can be computed explicitly to be

Alternatively, the preceding formula can also be obtained by brute force integration from the density (6) or from Theorems 2.2 and 4.1 in Magnus (1999). The MSE is independent of α. A pointwise asymptotic analysis tells us that MSE converges to the asymptotic variance

if β = 0 and to the asymptotic variance

if β ≠ 0.
18Although this is again in line with (5) it is again not a direct consequence of (5) but follows from the exponential decay of

for fixed β ≠ 0; cf. note 17. Furthermore, the fact that the pointwise limit of the MSE coincides with the asymptotic variance of the infeasible “estimator”

is not particular to the consistent model selection procedure discussed here. It is true for consistent model selection procedures in general, provided the probability of selecting an incorrect model converges to zero sufficiently fast, which is typically the case; see Nishii (1984) for some results in this direction. Of course, being only pointwise limit results, these results are subject to the criticism put forward in the present paper.

stays bounded (it converges to σα,∞2). This is well known for the Hodges estimator (e.g., Lehmann and Casella, 1998, p. 442). For the mean-squared error of

this follows of course immediately from the fact noted previously that the bias diverges to ±∞ when setting

with γn → ∞ (or γn → −∞) but γn = o(c). (The phenomenon that the maximal absolute bias and hence the maximal mean-squared error diverge to infinity holds for post-model-selection estimators based on consistent model selection procedures in general; see Remark 4.1, Appendix C; and Yang (2003).)

Finite-sample mean-squared error. The second moment of , i.e., the (scaled) mean-squared error of the post-model-selection estimator for α, as a function of for various values of n, where we have taken , ρ = 0.7, and σα2 = 1. The curves are given for n = 10k for k = 1,2,…,7; larger sample sizes correspond to curves with larger maximal mean-squared error.
2.2. The Conservative Model Selection Framework
Generally speaking, post-model-selection estimators based on conservative model selection procedures are subject to phenomena similar to the ones observed in Section 2.1 for post-model-selection estimators based on consistent procedures. In particular, the finite-sample behavior of both types of post-model-selection estimators is governed by exactly the same formulas, because the finite-sample behavior is clearly not much impressed by what we fancy about the behavior of the model selection procedure at fictitious sample sizes other than n (e.g., what we fancy about the behavior of the cutoff point c as a function of n). Cf. the discussion immediately preceding Section 2.1. Not surprisingly, some differences arise in the asymptotic theory.
In this section we consider the same model selection procedure and post-model-selection estimator

as before, except that we now assume the cutoff point c to be independent of sample size n.
19We could allow more generally for a sample-size-dependent c that, e.g., converges to a positive real number. See Leeb and Pötscher (2003a, Remark 6.2).
For a detailed treatment of the finite-sample and asymptotic properties of post-model-selection estimators based on a conservative model selection procedure see Pötscher (1991), Leeb and Pötscher (2003a), and Leeb (2003a, 2003b).

are again given by (6), (11), and (12), respectively. Also, the model selection probabilities and the coverage probability of the “naive” confidence interval are given by the same formulas as before. As a consequence, all conclusions drawn from the finite-sample formulas in Section 2.1 remain valid here: The finite-sample distribution of the post-model-selection estimator is often decidedly nonnormal, and the standard asymptotic approximations derived on the presumption of an a priori given model are inappropriate. In particular, the actual coverage probability of the “naive” confidence interval is often much smaller than the nominal coverage probability. Finally, the bias can be substantial, and the mean-squared error can by far exceed the mean-squared error of the unrestricted estimator.
We briefly discuss the asymptotic behavior next.
21Similar as for consistent model selection procedures in fact all accumulation points of the model selection probabilities, the finite-sample distributions, the bias, and the mean-squared error can be characterized by a subsequence argument similar to Remark A.8; cf. also Leeb and Pötscher (2003a, Remark 4.4(i)), and Leeb (2003b, Remark 5.5).

if

, reflecting the fact that the model selection procedure is conservative but not consistent. As in the case of consistent model selection procedures, this convergence is not uniform w.r.t. β. In contrast to consistent model selection procedures (cf. Proposition A.1 in Appendix A), the behavior under sample-size-dependent parameters (αn,βn) is quite simple: If

, then

. (If

, then the limit is zero; i.e., the asymptotic behavior is identical to the asymptotic behavior under fixed β ≠ 0.) In particular, the asymptotic analysis confirms what we already know from the finite-sample analysis, namely, that the probability of erroneously selecting the restricted model can be substantial, namely, if |γ| is small. However, in contrast to consistent model selection procedures, this probability does not converge to unity as sample size increases. It is also interesting to note that deviations from the restricted model such as

with |ζ| < 1 and cn → ∞,

, that can not be detected by a consistent model selection procedure using cutoff point cn (cf. Proposition A.1 and note 14 in the notes section) can be detected with probability approaching unity by a conservative procedure using a fixed cutoff point c. Consequently and not surprisingly, conservative model selection procedures are more powerful than consistent model selection procedures in the sense that they are less likely to erroneously select an incorrect model for large sample sizes. (Needless to say this advantage of the conservative procedure is paid for by a larger probability of selecting an overparameterized model.)
Turning to the post-model-selection estimator

itself, it is obvious that now conditions (4) and (5) are no longer satisfied;
22Nevertheless, it is easy to see that

is consistent (cf. Pötscher, 1991, Lemma 2) and, in fact, is uniformly consistent; see Proposition B.1 in Appendix B.

has a density given by σα,∞−1φ(u/σα,∞) if β ≠ 0 and given by

if β = 0. Note that (13) bears some resemblance to the finite-sample distribution (6). However, the pointwise asymptotic distribution does not capture all the effects present in the finite-sample distribution, especially if β ≠ 0; in particular, the convergence is not uniform w.r.t. β (except in trivial cases such as ρ∞ = 0); cf. Corollary 5.5 in Leeb and Pötscher (2003a), Remark 6.6 in Leeb and Pötscher (2003b), and note 16. A much better approximation, capturing all the essential features of the finite-sample distribution, is obtained by the asymptotic distribution under sample-size dependent parameters (αn,βn) with

: This asymptotic distribution has a density of the form

This follows either as a special case of Proposition 5.1 of Leeb (2003b) (cf. also Leeb and Pötscher, 2003a, Proposition 5.3 and Corollary 5.4) or can be gleaned directly from (6). (If

, then the limit has the form σα,∞−1φ(u/σα,∞).)
23Here the convergence of the finite-sample distribution to the asymptotic distribution is w.r.t. total variation distance.

has been replaced by γ.
Consider next the asymptotic behavior of the actual coverage probability of the “naive” confidence interval

given by (7) and (8). The pointwise limit of the actual coverage probability has been studied in Pötscher (1991, Sect. 3.3). In contrast to the case of consistent model selection procedures, it turns out to be less than the nominal coverage probability in case the restricted model is correct. However, this pointwise asymptotic result, although hinting at the problem, still gives a much too optimistic picture when compared with the actual finite-sample coverage probability. The large-sample minimal coverage probability of the “naive” confidence interval has been studied in Kabaila and Leeb (2004). Although it does not equal zero as in the case of consistent model selection procedures, it turns out to be often much smaller than the nominal coverage probability 1 − η (as in Figure 3); see Kabaila and Leeb (2004) for more details.
We finally turn to the bias and mean-squared error of

. Under the sequence of parameters (αn,βn) with

, it is readily seen from (11) that the bias converges to

The pointwise asymptotics corresponds to the cases γ = 0 and γ = ±∞ (with the convention that ±∞Δ(±∞,c) = 0 and φ(±∞) = 0) and results in a zero limiting bias. However, the maximal bias can be quite substantial if β is of the order

. In contrast to the case of consistent model selection procedures, the maximal bias does not go to infinity (in absolute value) as n → ∞ but remains bounded. (It is perhaps somewhat ironic—although not surprising—that consistent model selection procedures that look perfect in a pointwise asymptotic analysis lead in fact to more heavily distorted post-model-selection estimators than conservative model selection procedures.) The limiting mean-squared error under (αn,βn) as before is easily seen to be given by

the pointwise asymptotics again corresponding to the cases γ = 0 and γ = ±∞ (with the convention that ∞Δ(±∞,c) = 0 and ±∞φ(±∞) = 0). In contrast to the case of consistent model selection procedures, the pointwise limit of MSE captures some (but not all) of the effects of model selection and hence no longer coincides with the asymptotic variance of the infeasible “estimator”

. Also, in contrast to the case of consistent model selection procedures, the maximal mean-squared error does not go off to infinity as n → ∞, but rather it remains bounded; cf. also Remark 4.1.
2.3. Can One Estimate the Distribution of Post-Model-Selection Estimators?
It transpires from the preceding discussion that the finite-sample distributions (and also the asymptotic distributions) of post-model-selection estimators depend on unknown parameters (i.e., β in the example discussed in this paper), often in a complicated fashion. For inference purposes, e.g., for the construction of confidence sets, estimators for these distributions would be desirable. Consistent estimators for these distributions can typically be constructed quite easily, e.g., by suitably replacing unknown parameters in the large-sample limit distributions by estimators: In the case of the consistent model selection procedure discussed in Section 2.1 a consistent estimator for the finite-sample distribution of

is simply given by the normal distribution N(0,σα2(1 − ρ2)), i.e., by the distribution of

, and by N(0,σα2), i.e., by the distribution of

. However, recall from Section 2.1 that the finite-sample distribution of the post-model-selection estimator is not uniformly close to its pointwise asymptotic limit. Hence the suggested estimator (being identical with the pointwise asymptotic distribution except for replacing σα,∞2 and ρ∞2 by σα2 and ρ2) will—although being consistent—not be close to the finite-sample distribution uniformly in the unknown parameters, thus providing a rather useless estimator. In the case of conservative model selection procedures consistent estimators for the finite-sample distribution of the post-model-selection estimator can also be constructed from the pointwise asymptotic distribution by suitably plugging in estimators for unknown quantities; see Leeb and Pötscher (2003b, 2004). However, again these estimators will be quite useless for the same reason: As discussed in Section 2.2, the convergence of the finite-sample distributions to their (pointwise) large-sample limits is typically not uniform with respect to the underlying parameters, and there is no reason to believe that this nonuniformity will disappear when unknown parameter values in the large-sample limit are replaced by estimators.
A natural reaction to the preceding discussion could be to try the bootstrap or some related resampling procedure such as, e.g., subsampling. Consider first the case of a consistent model selection procedure. Then, in view of (4) and (5), the bootstrap that resamples from the residuals of the selected model certainly provides a consistent estimator for the finite-sample distribution of the post-model-selection estimator. Note that the consistent estimator described in the preceding paragraph can be viewed as a (parametric) bootstrap. The discussion in the previous paragraph then, however, suggests that such estimators based on the bootstrap (or on other resampling procedures such as subsampling), despite being consistent, will be plagued by the nonuniformity issues discussed earlier. Next consider the case where the model selection procedure is conservative (but not consistent). Then the bootstrap will typically not even provide consistent estimators for the finite-sample distribution of the post-model-selection estimator, as the bootstrap can be shown to stay random in the limit (Kulperger and Ahmed, 1992; Knight, 1999, Example 3):24
Kilian (1998) claims the validity of a bootstrap procedure in the context of autoregressive models that is based on a conservative model selection procedure. Hansen (2003) makes a similar claim for a stationary bootstrap procedure in the context of a conservative model selection procedure. The preceding discussion intimates that both these claims are at least unsubstantiated.
A natural question then is how estimators (not necessarily derived from the asymptotic distributions or from resampling considerations) can be found that do not suffer from the nonuniformity defect. In other words, we are asking for estimators

of the finite-sample c.d.f.

that are uniformly consistent, i.e., that satisfy for every

and every δ > 0

However, it turns out that no estimator

can satisfy this requirement (except possibly in the trivial case where ρ∞ = 0). For conservative model selection procedures this is proved in Leeb and Pötscher (2003a, 2004) in a more general framework, including model selection by AIC from a quite arbitrary collection of linear regression models. For a consistent model selection procedure such a result is given in Leeb and Pötscher (2002, Sect. 2.3). In fact, these papers show that the situation is even more dramatic: For every consistent estimator

even

holds for suitable δ > 0, and this result is even local in the sense that it holds also if the supremum in the preceding display extends only over suitable balls that shrink at rate

.
25Similar “impossibility” results apply to estimators of the model selection probabilities; see Leeb and Pötscher (2004) in the case of conservative procedures; for consistent procedures this argument can be easily adapted by making use of Proposition A.1.
The preceding “impossibility” results establish in particular that any proposal to estimate the distribution of post-model-selection estimators by whatever resampling procedure (bootstrap, subsampling, etc.) is doomed as any such estimator is necessarily plagued by the nonuniformity defect (if it is consistent at all). On a more general level, an implication of the preceding results is that assessing the variability of post-model-selection estimators (e.g., the construction of valid confidence intervals post model selection) is a harder problem than perhaps expected.26
3. RELATED PROCEDURES: SHRINKAGE-TYPE ESTIMATORS AND PENALIZED LEAST-SQUARES
Post-model-selection estimators can be viewed as a discontinuous form of shrinkage estimators. In this section we briefly discuss the relationship between post-model-selection estimators and shrinkage-type estimators and look at the distributional properties of such estimators. Although estimators such as the James–Stein estimator or ridge estimators have a long tradition in econometrics and statistics, a number of shrinkage-type estimators such as the Lasso estimator, the Bridge estimator, and the SCAD estimator are of more recent vintage. In the context of a linear regression model Y = Xθ + ε many of these estimators can be cast in the form of a penalized least-squares estimator: Let

be the estimator that is obtained by minimizing the penalized least-squares criterion

where xt. denotes the tth row and k the number of columns of X. This is the class of Bridge estimators introduced by Frank and Friedman (1993), the case q = 2 corresponding to the ridge estimator. The member of this class obtained by setting q = 1 has been referred to as a Lasso-type estimator by Knight and Fu (2000), because it is closely related to the Lasso of Tibshirani (1996). Knight and Fu (2000) also note that in the context of wavelet regression minimizing (15) with q = 1 is known as “basis pursuit,” cf. Chen, Donoho, and Saunders (1998). In fact, in the case of diagonal X′X the Lasso-type estimator reduces to soft-thresholding of the coordinates of the least-squares estimator. (We note that in this case hard-thresholding, which obviously is a model selection procedure, can also be represented as a penalized least-squares estimator.) The SCAD estimator introduced by Fan and Li (2001) is also a penalized least-squares estimator but uses a different penalty term. It is given as the minimizer of

with a specific choice of pλn that we do not reproduce here.
The asymptotic distributional properties of Bridge estimators have been studied in Knight and Fu (2000). Under appropriate conditions on q and on the regularization parameter λn, the asymptotic distribution shows features similar to the asymptotic distribution of post-model-selection estimators based on a conservative model selection procedure (e.g., bimodality). Under other conditions on q and λn, the Bridge estimator acts more like a post-model-selection estimator based on a consistent procedure. In particular, such a Bridge estimator will estimate zero components of the true θ exactly as zero with probability approaching unity. It hence satisfies an “oracle” property. This is also true for the SCAD estimator of Fan and Li (2001). In view of the discussion in Section 2.1 and the lessons learned from Hodges' estimator, one should, however, not read too much into this property as it can give a highly misleading impression of the properties of these estimators in finite samples.27
Although the James–Stein estimator is known to dominate the least-squares estimator in a normal linear regression model with more than two regressors, we are not aware of any similar result for the other shrinkage-type estimators mentioned earlier. (In fact, for some it is known that they do not dominate the least-squares estimator.)
Another similarity with post-model-selection estimators is the fact that the distribution function or the risk of shrinkage-type estimators often can not be estimated uniformly consistently. See Leeb and Pötscher (2002) for more on this subject.
4. REMARKS
Remark 4.1. In this remark we collect some decision-theoretic facts about post-model-selection estimators. These results could be taken as a starting point for a discussion of whether or not model selection (from submodels of an overall model of fixed finite dimension) can be justified from a decision-theoretic point of view.
1. Sometimes model selection is motivated by arguing that allowing for the selection of models more parsimonious than the overall model would lead to a gain in the precision of the estimate. However, this argument does not hold up to closer scrunity. For example, it is well known in the standard linear regression model Y = Xθ + ε that the mean-squared error of any given pretest estimator for θ exceeds the mean-squared error of the least-squares estimator (X′X)−1X′Y on parts of the parameter space (Judge and Bock, 1978; Judge and Yancey, 1986; Magnus, 1999). Hence, pretesting does not lead to a global gain (i.e., a gain that holds over the entire parameter space) in mean-squared error over the least-squares estimator obtained from the overall model. Cf. also the discussion of the mean-squared error in Sections 2.1 and 2.2.
2. For Hodges' estimator and also for the post-model-selection estimator based on a consistent model selection procedure considered in Section 2.1 the maximal (scaled) mean-squared error increases without bound as n → ∞, whereas the maximal (scaled) mean-squared error of the least-squares estimator in the overall model remains bounded. Cf. Section 2.1.
3. The unboundedness of the maximal (scaled) mean-squared error is true for post-model-selection estimators based on consistent procedures more generally. Yang (2003) proves such a result in a normal linear regression framework for some sort of maximal predictive risk. A proof for the maximal [scaled] mean-squared error (in fact for the maximal [scaled] absolute bias) as considered in the present paper is given in Appendix C.28
This proof seems to be somewhat simpler than Yang's proof and has the advantage of also covering nonnormally distributed errors. It should easily extend to Yang's framework, but we do not pursue this here.
The fact that the maximal (scaled) mean-squared error remains bounded for conservative procedures is sometimes billed as “minimax rate optimality” of the procedure (see, e.g., Yang, 2003, and the references given there). Given that this “optimality” property is typically shared by any post-model-selection estimator based on a conservative procedure (including the procedure that always selects the overall model), this property does not seem to carry much weight here.
4. Kempthorne (1984) has shown that in a normal linear regression model no post-model-selection estimator

(including the trivial post-model-selection estimators that are based on a fixed model) dominates any other post-model-selection estimator in terms of mean-squared error of

.
5. It is well known that in a normal linear regression model Y = Xθ + ε with more than two regressors the least-squares estimator (X′X)−1X′Y is inadmissible as it is dominated by the Stein estimator (and its admissible versions). Similarly, every pretest estimator is inadmissible as shown by Sclove, Morris, and Radhakrishnan (1972). See Judge and Yancey (1986, p. 33) for more information.
Remark 4.2. That in the case of two competing models minimum AIC (and also BIC) reduces to a likelihood ratio test has been noted already by Söderström (1977) and has been rediscovered numerous times. Even in the general case there is a closer connection between model selection based on multiple testing procedures and model selection procedures based on information criteria such as AIC or BIC than is often recognized. For example, the minimum AIC or BIC method can be reexpressed as the search for that model that is not rejected in pairwise comparisons against any other competing model, where rejection occurs if the likelihood-ratio statistic (corresponding to the pairwise comparison) exceeds a critical value that is determined by the model dimensions and sample size; see Pötscher (1991, Sect. 4, Remark (ii)) for more information.
Remark 4.3. The idea that hypothesis tests give rise to consistent (model) selection procedures if the significance levels of the tests approach zero at an appropriate rate as sample size increases has already been used in Pötscher (1981, 1983) in the context of ARMA models and in Bauer, Pötscher, and Hackl (1988) in the context of general (semi)parametric models. It has since been rediscovered numerous times, e.g., by Andrews (1986), Corradi (1999), Altissimo and Corradi (2002, 2003), and Bunea, Niu, and Wegkamp (2003), to mention a few. [The editor has informed us that in the context of a linear regression model the same idea appears also in a 1981 manuscript by Sargan, which was eventually published as Sargan, 2001.]
Remark 4.4.
1. If

then Pn,αn,βn is contiguous w.r.t. Pn,α,β (and this is more generally true in any sufficiently regular parametric model). If

is an arbitrary consistent model selection procedure, i.e., satisfies

, where M0 = M0(α,β) is the most parsimonious true model corresponding to (α,β), then also

as n → ∞ by contiguity, and hence the post-model-selection estimator based on

coincides with the restricted estimator with Pn,αn,βn probability converging to unity if β = 0. Hence, any consistent model selection procedure is insensitive to deviations at least of the order

. It is obvious that this argument immediately carries over to any class of sufficiently regular parametric models (except if the competing models are “well separated”).
2. As a consequence of the preceding contiguity argument, in general no model selector can be uniformly consistent for the most parsimonious true model. Cf. also Corollary 2.3 in Pötscher (2002) and Corollary 3.3 in Leeb and Pötscher (2002) and observe that the estimand (i.e., the most parsimonious true model) depends discontinuously on the probability measure underlying the data generating process (except in the case where the competing models are “well separated”).
Remark 4.5. Suppose that in the context of model (1) the parameter of interest is now not α but more generally a linear combination d1α + d2 β, which is estimated by

, where

is the post-model-selection estimator as defined in Section 2 and the post-model-selection estimator

is defined similarly, i.e.,

. An important example is the case where the quantity of interest is a linear predictor. Then appropriate analogues to the results discussed in the present paper apply, where the rôle of ρ is now played by the correlation coefficient between

. See Leeb (2003a, 2003b) and Leeb and Pötscher (2003b, 2004) for a discussion in a more general framework.
Remark 4.6. We have excluded the special case ρ∞ = 0 in parts of the discussion of consistent model selection procedures in Section 2.1 for the sake of simplicity. It is, however, included in the theoretical results presented in Appendix A. In the following discussion we comment on this case.
1. If ρ = 0 then it is easy to see that all effects from model selection disappear in the finite-sample formulas in Section 2.1. This is not surprising because ρ = 0 implies that the design matrix has orthogonal columns and hence the post-model-selection estimator

coincides with the restricted and also with the unrestricted least-squares estimator for α.
2. If only ρ∞ = 0 (i.e., the columns of the design matrix are only asymptotically orthogonal), then the effects of model selection need not disappear from the asymptotic formulas; cf. Appendix A. However, inspection of the results in Appendix A shows that these effects will disappear asymptotically if ρ converges to ρ∞ = 0 sufficiently fast (essentially faster than 1/c). (In contrast, in the case of conservative model selection procedures the condition ρ∞ = 0 suffices to make all effects from model selection disappear from the asymptotic formulas; cf. Section 2.2.)
3. As noted previously, in the case of an orthogonal design (i.e., ρ = 0) all effects from model selection on the distributional properties of

vanish. However, even for orthogonal designs, effects from model selection will nevertheless typically be present as soon as a linear combination d1α + d2 β other than α represents the parameter of interest because then the correlation coefficient between

rather than ρ governs the effects from model selection on the post-model-selection estimator; cf. Remark 4.5.
5. CONCLUSION
The distributional properties of post-model-selection estimators are quite intricate and are not properly captured by the usual pointwise large-sample analysis. The reason is lack of uniformity in the convergence of the finite-sample distributions and of associated quantities such as the bias or mean-squared error. Although it has long been known that uniformity (at least locally) w.r.t. the parameters is an important issue in asymptotic analysis, this lesson has often been forgotten in the daily practice of econometric and statistical theory where we are often content to prove pointwise asymptotic results (i.e., results that hold for each fixed true parameter value). This amnesia—and the resulting practice—fortunately has no dramatic consequences as long as only sufficiently “regular” estimators in sufficiently “regular” models are considered.30
The reason is that the asymptotic properties of such estimators typically are then in fact “automatically” uniform, at least locally.
Especially misinformative can be those limit results that are not uniform. Then the limit may exhibit some features that are not even approximately true for any finite n …
thus takes on particular relevance in the context of model selection: While a pointwise asymptotic analysis paints a very misleading picture of the properties of post-model-selection estimators, an asymptotic analysis based on the fiction of a true parameter that depends on sample size provides highly accurate insights into the finite-sample properties of such estimators.
The distinction between consistent and conservative model selection procedures is an artificial one as discussed in Section 2 and is rather a property of the embedding framework than of the model selection procedure. Viewing a model selection procedure as consistent results in a completely misleading pointwise asymptotic analysis that does not capture any of the effects of model selection that are present in finite samples. Viewing a model selection procedure as conservative (but inconsistent) results in a pointwise asymptotic analysis that captures some of the effects of model selection, although still missing others.
We would like to stress that the claim that the use of a consistent model selection procedure allows one to act as if the true model were known in advance is without any substance. In fact, any asymptotic consideration based on the so-called oracle property should not be trusted. (Somewhat ironically, consistent model selection procedures that seem not to affect the asymptotic distribution in a pointwise analysis at all exhibit stronger effects [e.g., larger maximal absolute bias or larger maximal mean-squared error] as a result of model selection in a “uniform” analysis when compared with conservative procedures.)31
This is not surprising. For the particular model selection procedure considered here it is obvious that a larger value of the cutoff point c gives more “weight” to the restricted model, which results in a larger maximal absolute bias.
As shown in Section 2.3, accurate estimation of the distribution of post-model-selection estimators is intrinsically a difficult problem. In particular, it is typically impossible to estimate these distributions uniformly consistently. Similar results apply to certain shrinkage-type estimators as discussed in Section 3.
Although the discussion in this paper is set in the framework of a simple linear regression model, the issues discussed are obviously relevant much more generally. Results on post-model-selection estimators for nonlinear models and/or dependent data are given in Sen (1979), Pötscher (1991), Hjort and Claeskens (2003), and Nickl (2003).
We stress that the discussion in this paper should neither be construed as a criticism nor as an endorsement of model selection (be it consistent or conservative). In this paper we take no position on whether or not model selection is a sensible strategy. Of course, this is an important issue, but it is not the one we address here. A starting point for such a discussion could certainly be the results mentioned in Remark 4.1.
Although there is now a substantial body of literature on distributional properties of post-model-selection estimators, a proper theory of inference post model selection is only slowly emerging and is currently the subject of intensive research. We hope to be able to report on this elsewhere.
APPENDIX A: ASYMPTOTIC RESULTS FOR CONSISTENT MODEL SELECTION PROCEDURES
In this Appendix we provide propositions that together with Remark A.8, which follows, characterize all possible limits (more precisely, all accumulation points) of the model selection probabilities, the finite-sample distribution, the (scaled) bias, and the (scaled) mean-squared error of the post-model-selection estimator based on a consistent model selection procedure under arbitrary sequences of parameters (αn,βn). Recall that these quantities do not depend on α and hence the behavior of α will not enter the results in the sequel. In the following discussion we consider the linear regression model (1) under the assumptions of Section 2. Furthermore, we assume as in Section 2.1 that

as n → ∞.
PROPOSITION A.1. Let (αn,βn) be an arbitrary sequence of values for the regression parameters in (1).

Proof. From (3) we have

Observe that

. The first two claims then follow immediately. The third claim follows because then

trivially converges to Φ(r), whereas

converges to zero. The fourth claim is proved analogously. █
The next proposition describes the possible limiting behavior of the finite-sample distribution of the post-model-selection estimator, which is somewhat complex. It turns out that the limit can, e.g., be point-mass at (plus or minus) infinity, or a convex combination of such a point-mass with a “deformed” normal distribution, or a convex combination of a normal distribution with a “deformed” normal. Let Gn,α,β(t) denote the cumulative distribution function corresponding to the density gn,α,β(u) of

. Also recall that convergence in total variation of a sequence of absolutely continuous c.d.f.s on the real line is equivalent to convergence of the densities in the L1-sense.
PROPOSITION A.2. Let (αn,βn) be an arbitrary sequence of values for the regression parameters in (1).
1. Suppose that (i)

, or that (ii)

, or that (iii)

as n → ∞. Assume furthermore that

for some

as n → ∞. If χ = −∞, then Gn,αn,βn(t) converges to 0 for every

; i.e.,

converges to ∞ in Pn,αn,βn probability. If χ = ∞, then Gn,αn,βn(t) converges to 1 for every

; i.e.,

converges to −∞ in Pn,αn,βn probability. If |χ| < ∞, then Gn,αn,βn(t) converges to Φ((1 − ρ∞2)−1/2 × (t/σα,∞ + χ)) in total variation distance; in fact, gn,αn,βn(u) converges to σα,∞−1(1 − ρ∞2)−1/2φ((1 − ρ∞2)−1/2(u/σα,∞ + χ)) pointwise and hence in the L1 sense.
2. Suppose that (i)

, or that (ii)

, or that (iii)

as n → ∞. Then Gn,αn,βn(t) converges to Φ(t/σα,∞) in the total variation distance; in fact, gn,αn,βn(u) converges to σα,∞−1φ(u/σα,∞) pointwise and hence in the L1 sense.
3. Suppose that

for some

for some

. If |χ| = ∞, then Gn,αn,βn(t) converges to

for every

. The limit is a convex combination of pointmass at sign(−χ)∞ and a c.d.f. with density given by 1/(1 − Φ(r)) times the integrand in the preceding display, the weights in the convex combination given by Φ(r) and 1 − Φ(r), respectively. If |χ| < ∞, then Gn,αn,βn(t) converges to

for every

.
4. Suppose

for some

, and

for some

as n → ∞. If |χ| = ∞, then Gn,αn,βn(t) converges to

for every

. The limit is a convex combination of pointmass at sign(−χ)∞ and a c.d.f. with density given by 1/(1 − Φ(s)) times the integrand in the preceding display, the weights in the convex combination given by Φ(s) and 1 − Φ(s), respectively. If |χ| < ∞, then Gn,αn,βn(t) converges to

for every

.
Proof. In view of (2) we can write the density gn,α,β as

where gn,α,β(u|R) is the conditional density of

given that

and gn,α,β(u|U) is defined analogously. As mentioned in note 15,


To prove part 1 replace (α,β) by (αn,βn) in the preceding formulas and observe that under the assumptions of this part of the proposition the probability

converges to unity (Proposition A.1) and hence the contribution to the total probability mass by the second term on the far r.h.s. of (A.3) vanishes asymptotically. It hence suffices to consider the first term only. Now

by assumption. Furthermore, ρ → ρ∞ ≠ ± 1 (because Q was assumed to be positive definite), and σα → σα,∞ > 0. If χ = ±∞, inspection of (A.4) immediately shows that the total probability mass of

escapes to ∓∞. If χ is finite, inspection of (A.4) reveals that the conditional density gn,αn,βn(u|R) converges to σα,∞−1(1 − ρ∞2)−1/2φ((1 − ρ∞2)−1/2 × (u/σα,∞ + χ)) for every

. Because the limit function is a density again, convergence takes place in the L1 sense in view of Scheffé's theorem. This establishes convergence of the corresponding c.d.f. in the total variation distance.
To prove part 2 again replace (α,β) by (αn,βn) in the preceding formulas and observe that under the assumptions of this part of the proposition the probability

converges to zero (Proposition A.1) and hence the contribution to the total probability mass by the first term on the far r.h.s. of (A.3) vanishes asymptotically. It hence suffices to consider the second term only. Now, ρ → ρ∞ ≠ ±1, and σα → σα,∞ > 0. Inspection of (A.5) then immediately shows that gn,αn,βn(u|U) converges to σα,∞−1φ(u/σα,∞) for every

.
To prove part 3 observe that under the assumptions of this part of the proposition

hold. The proof that the total probability mass of gn,αn,βn(u|R) escapes to ∓∞ if χ = ±∞ is exactly the same as in the proof of part 1. In the case that χ is finite, the same argument as in the proof of part 1 shows that gn,αn,βn(u|R) converges to σα,∞−1(1 − ρ∞2)−1/2 × φ((1 − ρ∞2)−1/2(u/σα,∞ + χ)) for every

and in L1. Now regarding gn,αn,βn(u|U) inspection of (A.5) shows that this density converges to σα,∞−1φ(u/σα,∞)Φ((1 − ρ∞2)−1/2(−r + ρ∞σα,∞−1u))/(1 − Φ(r)) for every

. Because this limit is a probability density as is readily seen, the convergence is also in L1 by an application of Scheffé's theorem.
The proof of part 4 is completely analogous to the proof of part 3. █
Remark A.3. In the important case where ρ∞ ≠ 0 the preceding results simplify somewhat: If

in part 1 of the proposition, then necessarily χ = sign(ρ∞ζ)∞; i.e.,

always converges to ±∞ in probability. If ρ∞ ≠ 0 in part 3 of the proposition, then necessarily χ = sign(ρ∞)∞; i.e., only the distribution (A.1) can arise. If ρ∞ ≠ 0 in part 4 of the proposition, then necessarily χ = sign(−ρ∞)∞; i.e., only the distribution (A.2) can arise.
PROPOSITION A.4. Let (αn,βn) be an arbitrary sequence of values for the regression parameters in (1).
1. Suppose that

, and that

for some

as n → ∞. Then Bias → −σα,∞χ.
2. Suppose that

, as n → ∞. Then Bias → 0.
3. Suppose that

for some

, and

for some

as n → ∞. If r > −∞, or if r = −∞ but χ is finite, then Bias → −σα,∞χΦ(r) + σα,∞ ρ∞φ(r). If r = −∞ and |χ| = ∞, then

provided this limit exists.
4. Suppose that

for some

for some

as n → ∞. If s > −∞, or if s = −∞ but χ is finite, then Bias → −σα,∞χΦ(s) − σα,∞ ρ∞φ(s). If s = −∞ and |χ| = ∞, then

provided this limit exists.
Proof. Under the assumptions of part 1 of the proposition

converges to unity by Proposition A.1. Hence the first term in (11) converges to −σα,∞χ. Because ρ → ρ∞, σα → σα,∞, and because

and also

converge to zero, the second and third term in (11) go to zero, completing the proof of part 1.
To prove part 2 observe that the second and third term in (11) again converge to zero. Now,

converges to zero by Proposition A.1, whereas

diverges to ±∞. Because Δ(·,·) is symmetric in its first argument, we may assume that ζ is positive. Applying Lemma B.1 in Leeb and Pötscher (2003a), the limit of the first term in (11) is then readily seen to be zero.
We next prove part 3. From Proposition A.1 we see that

converges to Φ(r). Furthermore,

converges to −σα,∞χ (which may be infinite). This shows that the first term in (11) converges to −σα,∞χΦ(r) provided χ is finite or Φ(r) is positive. The second term obviously converges to ρ∞σα,∞φ(−r) = ρ∞σα,∞φ(r) (which is zero in case r = −∞), whereas the third term goes to zero. If χ is infinite and Φ(r) is zero (i.e., if r = −∞), Lemma B.1 in Leeb and Pötscher (2003a) shows that the first term in (11) converges to the claimed limit.
Part 4 is proved analogously to part 3. █
Remark A.5. In the important case where ρ∞ ≠ 0 the following simplifications arise: If ρ∞ ≠ 0 and ζ ≠ 0 in part 1 of the proposition, then necessarily χ = sign(ρ∞ζ)∞. If ρ∞ ≠ 0 in part 3 of the proposition, then necessarily χ = sign(ρ∞)∞. If ρ∞ ≠ 0 in part 4 of the proposition, then necessarily χ = sign(−ρ∞)∞.
PROPOSITION A.6. Let (αn,βn) be an arbitrary sequence of values for the regression parameters in (1).
1. Suppose that

, and that

for some

as n → ∞. Then MSE → σα,∞2(1 − ρ∞2 + χ2), which is infinite if |χ| = ∞.
2. Suppose that

as n → ∞. Then MSE → σα,∞2.
3. Suppose that

for some

, and

for some

as n → ∞. Then MSE → σα,∞2(1 + ρ∞2rφ(r) − ρ∞2Φ(r) + χ2Φ(r)) if r > −∞, or if r = −∞ but χ is finite (with the convention that rφ(r) = 0 if r = ±∞). If r = −∞ and |χ| = ∞, then

provided this limit exists.
4. Suppose that

for some

, and

for some

as n → ∞. Then MSE → σα,∞2(1 + ρ∞2sφ(s) − ρ∞2Φ(s) + χ2Φ(s)) if s > −∞, or if s = −∞ but χ is finite (with the convention that sφ(s) = 0 if s = ±∞). If s = −∞ and |χ| = ∞, then

provided this limit exists.
Proof. Under the assumptions of part 1 of the proposition the terms in (12) involving the standard normal density φ are readily seen to converge to zero. By Proposition A.1,

converges to unity. Consequently, MSE → σα,∞2(1 − ρ∞2 + χ2).
To prove part 2, observe that the terms in (12) involving the standard normal density φ again converge to zero and that

converges to zero by Proposition A.1. Hence we only need to show that

converges to zero. This follows from an application of Lemma B.1 in Leeb and Pötscher (2003a).
We next prove part 3. The terms in (12) involving the standard normal density φ are readily seen to converge to σα,∞2 ρ∞2rφ(r) with the convention that rφ(r) = 0 if r = ±∞. Furthermore, we see from Proposition A.1 that

converges to Φ(r) and that σα2 ρ2(n(βn /σβ)2 − 1) converges to σα,∞2(χ2 − ρ∞2) (which may be infinite). This proves the result provided χ is finite or Φ(r) is positive. If χ is infinite and Φ(r) is zero (i.e., if r = −∞), Lemma B.1 in Leeb and Pötscher (2003a) shows that the third term in (12) converges to the claimed limit.
Part 4 is proved analogously to part 3. █
Remark A.7. In the important case where ρ∞ ≠ 0 the following simplifications arise: If ρ∞ ≠ 0 and ζ ≠ 0 in part 1 of the proposition, then necessarily χ = sign(ρ∞ζ)∞, and hence MSE converges to ∞. If ρ∞ ≠ 0 in part 3 of the proposition, then necessarily χ = sign(ρ∞)∞, and hence MSE converges to ∞ provided r > −∞. If ρ∞ ≠ 0 in part 4 of the proposition, then necessarily χ = sign(−ρ∞)∞, and hence MSE converges to ∞ provided s > −∞.
Remark A.8. The preceding propositions in fact allow for a characterization of all possible accumulation points of the model selection probabilities, the finite-sample distribution, the (scaled) bias, and the (scaled) mean-squared error of the post-model-selection estimator under arbitrary sequences of parameters (αn,βn): Given any sequence (αn,βn), compactness of

implies that every subsequence (ni) contains a further subsequence (ni(j)) such that the quantities

, and the expressions in the limit operators in Propositions A.4 and A.6 converge to respective limits in

along the subsequence (ni(j)). Applying the preceding propositions to the subsequence (ni(j)) provides the desired characterization of all accumulation points.
PROPOSITION A.9. The post-model-selection estimator

is uniformly consistent for α, i.e.,

for every ε > 0.
Proof. Using Chebychev's inequality we obtain

Because σα2/(nε2) is independent of (α,β) and converges to zero, it suffices to show that the first term on the far r.h.s. of the preceding display converges to zero uniformly in (α,β). Observe that

is distributed normally with mean (−ρσα /σβ)β and variance σα2(1 − ρ2)/n. In view of (3), the first term on the far r.h.s. of the preceding display hence equals

which clearly does not depend on the value of the parameter α. Now

by an application of Proposition A.1. Furthermore,

which converges to zero because ε > 0, ρ → ρ∞, and because

. It now follows that (A.6) converges to zero uniformly. █
APPENDIX B: ASYMPTOTIC RESULTS FOR CONSERVATIVE MODEL SELECTION PROCEDURES
In the following discussion we consider the linear regression model (1) under the assumptions of Section 2. Furthermore, we assume as in Section 2.2 that c does not depend on sample size and satisfies 0 < c < ∞.
PROPOSITION B.1. The post-model-selection estimator

is uniformly consistent for α, i.e.,

for every ε > 0.
Proof. The proof is identical to the proof of Proposition A.9 up to and including (A.6). Now

as a consequence of Lemma C.3 in Leeb and Pötscher (2003b). Furthermore,

which converges to zero for every given

because ε > 0 and ρ → ρ∞. It then follows that (A.6) converges to zero uniformly. █
APPENDIX C: THE MAXIMAL ABSOLUTE BIAS AND THE MAXIMAL MSE ARE UNBOUNDED FOR GENERAL CONSISTENT MODEL SELECTION PROCEDURES
We give here a simple proof of the fact that the (scaled) maximal absolute bias and hence the (scaled) maximal mean-squared error of a post-model-selection estimator diverges to infinity if an arbitrary consistent model selection procedure is employed. This is a variant of the result of Yang (2003), who uses a predictive mean-square risk measure instead. Our proof is based on the contiguity argument discussed in Remark 4.4. An advantage of this proof is that—contrary to Yang's proof—it does not rely on a normality assumption for the errors.
We assume the simple linear regression model (1) under the basic assumptions made in Section 2, except that the errors εt only need to be i.i.d. with mean zero and (finite) variance σ2 > 0. (The assumption that σ2 is known is inessential here. If σ2 is unknown, and hence f depends on the scale parameter σ, Proposition C.1 holds for every value of σ2.) Furthermore, we assume that εt has a density f that possesses an absolutely continuous derivative f′ satisfying

Note that the conditions on f guarantee that the information of f is finite and positive. (These conditions are obviously satisfied in the special case of normally distributed errors.) Let

now be an arbitrary model selection procedure that consistently selects between the models R and U. Furthermore, let

denote the corresponding post-model-selection estimator (i.e.,

. In the following En,α,β denotes the expectation operator w.r.t. Pn,α,β. Recall that ρ∞ is less than unity in absolute value because the limit Q of X′X/n has been assumed to be positive definite.
PROPOSITION C.1. Suppose that ρ∞ ≠ 0. Then the maximal absolute bias

, and hence the maximal mean-squared error

, goes to infinity for n → ∞.
Proof. Clearly, it suffices to prove the result for the maximal absolute bias. The following elementary relations hold:

Furthermore,

Consequently, for every α and every

we have

provided we can show that

for every

. We apply the Cauchy–Schwartz inequality to obtain

The first term on the r.h.s. in (C.3) is easily seen to satisfy

To prove (C.2) it hence suffices to show that

. Because the model is locally asymptotically normal (Koul and Wang, 1984, Theorem 2.1 and Remark 1; Hajek and Sidak, 1967, p. 213), the sequence of probability measures

is contiguous w.r.t. the sequence Pn,α,0 (for every

). Because

by the assumed consistency of the model selection procedure, contiguity implies

for every

, cf. Remark 4.4. This establishes (C.2) and hence (C.1). Letting |r| go to infinity in (C.1) then completes the proof (note that |ρ∞| and σα,∞ are positive and σβ,∞−1 is finite). █
Remark C.2.
1. The proof in fact shows that this result holds for fixed α and any bounded neighborhood of β = 0, i.e.,

diverge to infinity as n → ∞ for each fixed α and s > 0.
2. The preceding proposition is formulated for the simple regression model with two regressors and only two competing models from which to choose. It can easily be extended to more general cases. The preceding proof should also easily extend to the risk measure used in Yang (2003). We do not pursue these issues here.
References
REFERENCES
Ahmed, S.E. &
A.K. Basu
(2000)
Least squares, preliminary test and Stein-type estimation in
general vector AR(p) models.
Statistica Neerlandica
54,
47–66.Google Scholar
Altissimo, F. &
V. Corradi
(2002)
Bounds for inference with nuisance parameters present only under
the alternative.
Econometrics Journal
5,
494–519.Google Scholar
Altissimo, F. &
V. Corradi
(2003)
Strong rules for detecting the numbers of breaks in a time series.
Journal of Econometrics
117,
207–244.Google Scholar
Andrews, D.W.K.
(1986)
Complete consistency: A testing analogue of estimator consistency.
Review of Economic Studies
53,
263–269.Google Scholar
Bauer, P.,
B.M. Pötscher, &
P. Hackl
(1988)
Model selection by multiple test procedures.
Statistics
19,
39–44.Google Scholar
Bunea, F.
(2004)
Consistent covariate selection and post model selection inference
in semiparametric regression.
Annals of Statistics
32,
898–927.Google Scholar
Bunea, F.,
X. Niu, &
M.H. Wegkamp
(2003)
The Consistency of the FDR Estimator.
Working paper,
Department of Statistics, Florida State University at Tallahassee.
Chen, S.S.,
D.L. Donoho, &
M.A. Saunders
(1998)
Atomic decomposition by basis pursuit.
SIAM Journal on Scientific Computing
20,
33–61.Google Scholar
Corradi, V.
(1999)
Deciding between I(0) and I(1) via FLIL-based
bounds.
Econometric Theory
15,
643–663.Google Scholar
Danilov, D. &
J.R. Magnus
(2004)
On the harm that ignoring pretesting can cause.
Journal of Econometrics
122,
27–46.Google Scholar
Dijkstra, T.K. &
J.H. Veldkamp
(1988)
Data-driven selection of regressors and the bootstrap.
Lecture Notes in Economics and Mathematical Systems
307,
17–38.Google Scholar
Dufour, J.M.,
D. Pelletier, &
E. Renault
(2003)
Short run and long run causality in time series: Inference.
Journal of Econometrics
(forthcoming).Google Scholar
Dukić, V.M. &
E.A Peña
(2002)
Estimation after Model Selection in a Gaussian Model.
Manuscript,
Department of Statistics, University of Chicago.
Ensor, K.B. &
H.J. Newton
(1988)
The effect of order estimation on estimating the peak frequency of
an autoregressive spectral density.
Biometrika
75,
587–589.Google Scholar
Fan, J. &
R. Li
(2001)
Variable selection via nonconcave penalized likelihood and its
oracle properties.
Journal of the American Statistical Association
96,
1348–1360.Google Scholar
Frank, I.E. &
J.H. Friedman
(1993)
A statistical view of some chemometrics regression tools (with
discussion).
Technometrics
35,
109–148.Google Scholar
Giles, J.A. &
D.E.A. Giles
(1993)
Pre-test estimation and testing in econometrics: Recent
developments.
Journal of Economic Surveys
7,
145–197.Google Scholar
Hajek, J.
(1971)
Limiting properties of likelihoods and inference. In
V.P. Godambe &
D.A. Sprott (eds.),
Foundations of Statistical Inference:
Proceedings of the Symposium on the Foundations of Statistical
Inference, University of Waterloo, Ontario, March 31–April 9,
1970, pp.
142–159.
Holt, Rinehart and Winston.
Hajek, J. &
Z. Sidak
(1967)
Theory of Rank Tests.
Academic Press.
Hall, A.R. &
F.P.M. Peixe
(2003)
A consistent method for the selection of relevant instruments.
Econometric Reviews
22,
269–287.Google Scholar
Hannan, E.J. &
B.G. Quinn
(1979)
The determination of the order of an autoregression.
Journal of the Royal Statistical Society, Series B
41,
190–195.Google Scholar
Hansen, P.R.
(2003)
Regression Analysis with Many Specifications: A Bootstrap Method
for Robust Inference.
Working paper,
Department of Economics, Brown University.
Hidalgo, J.
(2002)
Consistent order selection with strongly dependent data and its
application to efficient estimation.
Journal of Econometrics
110,
213–239.Google Scholar
Hjort, N.L. &
G. Claeskens
(2003)
Frequentist model average estimators.
Journal of the American Statistical Association
98,
879–899.Google Scholar
Hosoya, Y.
(1984)
Information criteria and tests for time series models. In
O.D. Anderson (ed.),
Time Series Analysis: Theory and Practice,
vol. 5, pp.
39–52.
North-Holland.
Judge, G.G. &
M.E. Bock
(1978)
The Statistical Implications of Pre-test and Stein-Rule Estimators
in Econometrics.
North-Holland.
Judge, G.G. &
T.A. Yancey
(1986)
Improved Methods of Inference in Econometrics.
North-Holland.
Kabaila, P.
(1995)
The effect of model selection on confidence regions and prediction
regions.
Econometric Theory
11,
537–549.Google Scholar
Kabaila, P.
(1996)
The evaluation of model selection criteria: Pointwise limits in
the parameter space. In
D.L. Dowe,
K.B. Korb, &
J.J. Oliver (eds.),
Information, Statistics and Induction in Science, pp.
114–118.
World Scientific.
Kabaila, P.
(1998)
Valid confidence intervals in regression after variable selection.
Econometric Theory
14,
463–482.Google Scholar
Kabaila, P. &
H. Leeb
(2004)
On the Large-Sample Minimal Coverage Probability of Confidence
Intervals after Model Selection.
Working paper,
Department of Statistics, Yale University.
Kapetanios, G.
(2001)
Incorporating lag order selection uncertainty in parameter
inference for AR models.
Economics Letters
72,
137–144.Google Scholar
Kempthorne, P.J.
(1984)
Admissible variable-selection procedures when fitting regression
models by least squares for prediction.
Biometrika
71,
593–597.Google Scholar
Kilian, L.
(1998)
Accounting for lag order uncertainty in autoregressions: The
endogenous lag order bootstrap algorithm.
Journal of Time Series Analysis
19,
531–548.Google Scholar
Knight, K.
(1999)
Epi-convergence in Distribution and Stochastic Equi-semicontinuity.
Working paper,
Department of Statistics, University of Toronto.
Knight, K. &
W. Fu
(2000)
Asymptotics of lasso-type estimators.
Annals of Statistics
28,
1356–1378.Google Scholar
Koul, H.L. &
W. Wang
(1984)
Local asymptotic normality of randomly censored linear regression
model.
Statistics & Decisions,
supplement 1,
17–30.Google Scholar
Kulperger, R.J. &
S.E. Ahmed
(1992)
A bootstrap theorem for a preliminary test estimator.
Communications in Statistics: Theory and Methods
21,
2071–2082.Google Scholar
Leeb, H.
(2003a)
The distribution of a linear predictor after model selection:
Conditional finite-sample distributions and asymptotic
approximations.
Journal of Statistical Planning and Inference
(forthcoming).Google Scholar
Leeb, H.
(2003b)
The Distribution of a Linear Predictor after Model Selection:
Unconditional Finite-Sample Distributions and Asymptotic
Approximations.
Working paper,
Department of Statistics, University of Vienna.
Leeb, H. &
B.M. Pötscher
(2002)
Performance Limits for Estimators of the Risk or Distribution of
Shrinkage-Type Estimators, and Some General Lower Risk-Bound
Results.
Working paper,
Department of Statistics, University of Vienna.
Leeb, H. &
B.M. Pötscher
(2003a)
The finite-sample distribution of post-model-selection estimators
and uniform versus nonuniform approximations.
Econometric Theory
19,
100–142.Google Scholar
Leeb, H. &
B.M. Pötscher
(2003b)
Can One Estimate the Conditional Distribution of
Post-Model-Selection Estimators?
Working paper,
Department of Statistics, University of Vienna. (Also available as
Cowles Foundation Discussion paper 1444.)
Leeb, H. &
B.M. Pötscher
(2004)
Can One Estimate the Unconditional Distribution of
Post-Model-Selection Estimators?
Manuscript,
Department of Statistics, Yale University.
Lehmann, E.L. &
G. Casella
(1998)
Theory of Point Estimation.
Springer Texts in Statistics.
Springer-Verlag.
Lütkepohl, H.
(1990)
Asymptotic distributions of impulse response functions and forecast
error variance decompositions of vector autoregressive models.
Review of Economics and Statistics
72,
116–125.Google Scholar
Magnus, J.R.
(1999)
The traditional pretest estimator.
Teoriya Veroyatnost. i Primenen.
44, 401–418;
translation in Theory of Probability and Its
Applications 44 (2000), 293–308.Google Scholar
Nickl, R.
(2003)
Asymptotic Distribution Theory of Post-Model-Selection Maximum
Likelihood Estimators.
Master's thesis,
Department of Statistics, University of Vienna.
Nishii, R.
(1984)
Asymptotic properties of criteria for selection of variables in
multiple regression.
Annals of Statistics
12,
758–765.Google Scholar
Phillips, P.C.B.
(2005)
Automated discovery in econometrics.
Econometric Theory
(this issue).Google Scholar
Pötscher, B.M.
(1981)
Order Estimation in ARMA-Models by Lagrangian Multiplier Tests.
Research report 5,
Department of Econometrics and Operations Research, University of
Technology,
Vienna.
Pötscher, B.M.
(1983)
Order estimation in ARMA-models by Lagrangian multiplier tests.
Annals of Statistics
11,
872–885.Google Scholar
Pötscher, B.M.
(1991)
Effects of model selection on inference.
Econometric Theory
7,
163–185.Google Scholar
Pötscher, B.M.
(1995)
Comment on “The effect of model selection on confidence
regions and prediction regions.”
Econometric Theory
11,
550–559.Google Scholar
Pötscher, B.M.
(2002)
Lower risk bounds and properties of confidence sets for ill-posed
estimation problems with applications to spectral density and
persistence estimation, unit roots, and estimation of long memory
parameters.
Econometrica
70,
1035–1065.Google Scholar
Pötscher, B.M. &
A.J. Novak
(1998)
The distribution of estimators after model selection: Large and
small sample results.
Journal of Statistical Computation and Simulation
60,
19–56.Google Scholar
Rao, C.R. &
Y. Wu
(2001)
On model selection.
IMS Lecture Notes Monograph Series
38,
1–57.Google Scholar
Sargan, D.J.
(2001)
The choice between sets of regressors.
Econometric Reviews
20,
171–186.Google Scholar
Sclove, S.L.,
C. Morris, &
R. Radhakrishnan
(1972)
Non-optimality of preliminary-test estimators for the mean of a
multivariate normal distribution.
Annals of Mathematical Statistics
43,
1481–1490.Google Scholar
Sen, P.K
(1979)
Asymptotic properties of maximum likelihood estimators based on
conditional specification.
Annals of Statistics
7,
1019–1033.Google Scholar
Sen, P.K &
A.K.M.E. Saleh
(1987)
On preliminary test and shrinkage M-estimation in linear
models.
Annals of Statistics
15,
1580–1592.Google Scholar
Shibata, R.
(1986)
Consistency of model selection and parameter estimation.
Journal of Applied Probability,
special volume 23A,
127–141.Google Scholar
Söderström, T.
(1977)
On model structure testing in system identification.
International Journal of Control
26,
1–18.Google Scholar
Tibshirani, R.
(1996)
Regression shrinkage and selection via the lasso.
Journal of the Royal Statistical Society, Series B
58,
267–288.Google Scholar
Yang, Y.
(2003)
Can the Strengths of AIC and BIC Be Shared?
Working paper,
Department of Statistics, Iowa State University.
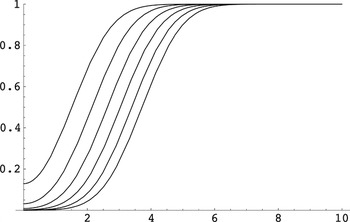
Finite-sample model selection probability. The probability of selecting the unrestricted model as a function of for various values of n, where we have taken . Starting from the top, the curves show for n = 10k for k = 1,2,…,6. Note that is independent of α and symmetric around zero in β or, equivalently, γ.
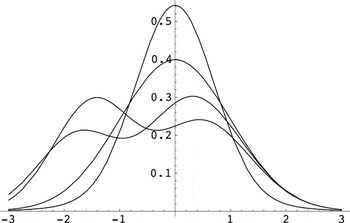
Finite-sample densities. The density gn,α,β of for various values of β/σβ. For the graphs, we have taken n = 100, , and σα2 = 1. The four curves correspond to β/σβ equal to 0, 0.21, 0.25, and 0.5 and are discussed in the text.
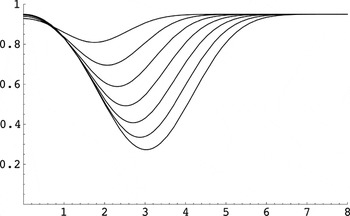
Finite-sample coverage probabilities. The coverage probability of the “naive” confidence interval with nominal confidence level 1 − η = 0.95 as a function of for various values of n, where we have taken and ρ = 0.7. The curves are given for n = 10k for k = 1,2,…,7; larger sample sizes correspond to curves with a smaller minimal coverage probability.
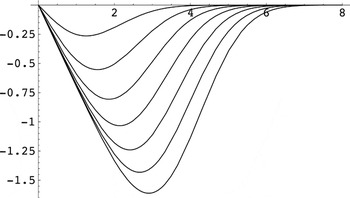
Finite-sample bias. The expectation of , i.e., the (scaled) bias of the post-model-selection estimator for α, as a function of for various values of n, where we have taken , ρ = 0.7, and σα2 = 1. The curves are given for n = 10k for k = 1,2,…,7; larger sample sizes correspond to curves with larger maximal absolute biases.
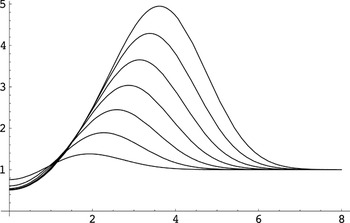
Finite-sample mean-squared error. The second moment of , i.e., the (scaled) mean-squared error of the post-model-selection estimator for α, as a function of for various values of n, where we have taken , ρ = 0.7, and σα2 = 1. The curves are given for n = 10k for k = 1,2,…,7; larger sample sizes correspond to curves with larger maximal mean-squared error.
 You have
Access
- 506
- Cited by