


%20--%3e%3c!DOCTYPE%20svg%20PUBLIC%20'-//W3C//DTD%20SVG%201.0//EN'%20'http://www.w3.org/TR/2001/REC-SVG-20010904/DTD/svg10.dtd'%3e%3csvg%20version='1.0'%20id='Layer_1'%20xmlns='http://www.w3.org/2000/svg'%20xmlns:xlink='http://www.w3.org/1999/xlink'%20x='0px'%20y='0px'%20width='64px'%20height='64px'%20viewBox='5.5%20-3.5%2064%2064'%20enable-background='new%205.5%20-3.5%2064%2064'%20xml:space='preserve'%3e%3cg%3e%3ccircle%20fill='%23FFFFFF'%20fill-opacity='0'%20cx='37.785'%20cy='28.501'%20r='28.836'/%3e%3cpath%20fill='%23595959'%20d='M37.441-3.5c8.951,0,16.572,3.125,22.857,9.372c3.008,3.009,5.295,6.448,6.857,10.314%20c1.561,3.867,2.344,7.971,2.344,12.314c0,4.381-0.773,8.486-2.314,12.313c-1.543,3.828-3.82,7.21-6.828,10.143%20c-3.123,3.085-6.666,5.448-10.629,7.086c-3.961,1.638-8.057,2.457-12.285,2.457s-8.276-0.808-12.143-2.429%20c-3.866-1.618-7.333-3.961-10.4-7.027c-3.067-3.066-5.4-6.524-7-10.372S5.5,32.767,5.5,28.5c0-4.229,0.809-8.295,2.428-12.2%20c1.619-3.905,3.972-7.4,7.057-10.486C21.08-0.394,28.565-3.5,37.441-3.5z%20M37.557,2.272c-7.314,0-13.467,2.553-18.458,7.657%20c-2.515,2.553-4.448,5.419-5.8,8.6c-1.354,3.181-2.029,6.505-2.029,9.972c0,3.429,0.675,6.734,2.029,9.913%20c1.353,3.183,3.285,6.021,5.8,8.516c2.514,2.496,5.351,4.399,8.515,5.715c3.161,1.314,6.476,1.971,9.943,1.971%20c3.428,0,6.75-0.665,9.973-1.999c3.219-1.335,6.121-3.257,8.713-5.771c4.99-4.876,7.484-10.99,7.484-18.344%20c0-3.543-0.648-6.895-1.943-10.057c-1.293-3.162-3.18-5.98-5.654-8.458C50.984,4.844,44.795,2.272,37.557,2.272z%20M37.156,23.187%20l-4.287,2.229c-0.458-0.951-1.019-1.619-1.685-2c-0.667-0.38-1.286-0.571-1.858-0.571c-2.856,0-4.286,1.885-4.286,5.657%20c0,1.714,0.362,3.084,1.085,4.113c0.724,1.029,1.791,1.544,3.201,1.544c1.867,0,3.181-0.915,3.944-2.743l3.942,2%20c-0.838,1.563-2,2.791-3.486,3.686c-1.484,0.896-3.123,1.343-4.914,1.343c-2.857,0-5.163-0.875-6.915-2.629%20c-1.752-1.752-2.628-4.19-2.628-7.313c0-3.048,0.886-5.466,2.657-7.257c1.771-1.79,4.009-2.686,6.715-2.686%20C32.604,18.558,35.441,20.101,37.156,23.187z%20M55.613,23.187l-4.229,2.229c-0.457-0.951-1.02-1.619-1.686-2%20c-0.668-0.38-1.307-0.571-1.914-0.571c-2.857,0-4.287,1.885-4.287,5.657c0,1.714,0.363,3.084,1.086,4.113%20c0.723,1.029,1.789,1.544,3.201,1.544c1.865,0,3.18-0.915,3.941-2.743l4,2c-0.875,1.563-2.057,2.791-3.541,3.686%20c-1.486,0.896-3.105,1.343-4.857,1.343c-2.896,0-5.209-0.875-6.941-2.629c-1.736-1.752-2.602-4.19-2.602-7.313%20c0-3.048,0.885-5.466,2.658-7.257c1.77-1.79,4.008-2.686,6.713-2.686C51.117,18.558,53.938,20.101,55.613,23.187z'/%3e%3c/g%3e%3c/svg%3e)
%20--%3e%3c!DOCTYPE%20svg%20PUBLIC%20'-//W3C//DTD%20SVG%201.0//EN'%20'http://www.w3.org/TR/2001/REC-SVG-20010904/DTD/svg10.dtd'%3e%3csvg%20version='1.0'%20id='Layer_1'%20xmlns='http://www.w3.org/2000/svg'%20xmlns:xlink='http://www.w3.org/1999/xlink'%20x='0px'%20y='0px'%20width='64px'%20height='64px'%20viewBox='5.5%20-3.5%2064%2064'%20enable-background='new%205.5%20-3.5%2064%2064'%20xml:space='preserve'%3e%3cg%3e%3ccircle%20fill='%23FFFFFF'%20fill-opacity='0'%20cx='37.637'%20cy='28.806'%20r='28.276'/%3e%3cg%3e%3cpath%20fill='%23595959'%20d='M37.443-3.5c8.988,0,16.57,3.085,22.742,9.257C66.393,11.967,69.5,19.548,69.5,28.5c0,8.991-3.049,16.476-9.145,22.456%20C53.879,57.319,46.242,60.5,37.443,60.5c-8.649,0-16.153-3.144-22.514-9.43C8.644,44.784,5.5,37.262,5.5,28.5%20c0-8.761,3.144-16.342,9.429-22.742C21.101-0.415,28.604-3.5,37.443-3.5z%20M37.557,2.272c-7.276,0-13.428,2.553-18.457,7.657%20c-5.22,5.334-7.829,11.525-7.829,18.572c0,7.086,2.59,13.22,7.77,18.398c5.181,5.182,11.352,7.771,18.514,7.771%20c7.123,0,13.334-2.607,18.629-7.828c5.029-4.838,7.543-10.952,7.543-18.343c0-7.276-2.553-13.465-7.656-18.571%20C50.967,4.824,44.795,2.272,37.557,2.272z%20M46.129,20.557v13.085h-3.656v15.542h-9.944V33.643h-3.656V20.557%20c0-0.572,0.2-1.057,0.599-1.457c0.401-0.399,0.887-0.6,1.457-0.6h13.144c0.533,0,1.01,0.2,1.428,0.6%20C45.918,19.5,46.129,19.986,46.129,20.557z%20M33.042,12.329c0-3.008,1.485-4.514,4.458-4.514s4.457,1.504,4.457,4.514%20c0,2.971-1.486,4.457-4.457,4.457S33.042,15.3,33.042,12.329z'/%3e%3c/g%3e%3c/g%3e%3c/svg%3e)
Introduction
Contact precautions remain part of a multifaceted approach to reduce healthcare transmission of multidrug-resistant organisms (MDROs) such as methicillin-resistant Staphylococcus aureus (MRSA). Reference Popovich, Aureden and Ham1 In the 2022 update, the Society for Healthcare Epidemiology of America guideline to prevent healthcare transmission and infection of MRSA recommends contact precautions as an essential practice. Reference Popovich, Aureden and Ham1 However, for hospitals seeking to modify the use of contact precautions for MRSA prevention, the update recommended a risk assessment to determine whether routine contact precautions could safely be modified or discontinued.
Over the past few years, multiple studies have shown that discontinuation of contact precautions for patients infected or colonized with MRSA or vancomycin-resistant Enterococcus (VRE) did not result in an increase in the rate of healthcare-associated infections (HAIs) due to MRSA or VRE. Reference Martin, Russell and Rubin2–Reference Bearman, Abbas and Masroor5 More recently, studies have shown similar findings after discontinuing contact precautions for patients infected or colonized with extended-spectrum beta-lactamase-producing Enterobacterales (ESBL-E). Reference Maechler, Schwab and Hansen6–Reference Zahar, Poirel, Dupont, Fortineau, Nassif and Nordmann9 Limited data address the impact of discontinuing contact precautions in children. Although a few of the published studies included infants in the neonatal intensive care unit (NICU), pediatric specific data were not reported. Reference Edmond, Masroor, Stevens, Ober and Bearman10,Reference Martin, Colaianne and Bridge11 Godbout et al showed no change in the rate of central line-associated bloodstream infections (CLABSIs) after discontinuing contact precautions for MRSA and VRE at a children’s hospital integrated with a larger adult hospital. Reference Godbout, Rittmann and Fleming4 Contact precautions were discontinued for MRSA at a large pediatric health system excluding the NICU and showed no increase in MRSA infections. Reference Most, Phillips and Sebert12 In another study involving two NICUs, there was increased MRSA colonization after discontinuing contact precautions but no increase in invasive infections. Reference Shahbaz, De St. Maurice, Sim, Rubin and Garg13
Infants hospitalized in the NICU represent a high-risk population for HAIs. Premature neonates have several risk factors including underdeveloped immune systems, frequent use of central venous lines and other medical devices, surgical procedures and prolonged hospitalizations. In addition, infants in the NICU are frequently cared for in ward settings. Outbreaks of MRSA occurring in the NICU can result in significant infant morbidity and mortality. Reference Lessa, Edwards, Fridkin, Tenover, Horan and Gorwitz14–Reference Southwick, Greenko, Quinn, Haley, Adams and Lutterloh16 For this reason, special consideration is needed in determining whether contact precautions can be safely discontinued for MDROs such as MRSA in the NICU.
In October of 2018, our pediatric healthcare system discontinued contact precautions for children infected or colonized with MRSA, VRE and ESBL-E across the entire system. In March of 2024, one of the NICUs in our health system initiated active surveillance cultures for MRSA primarily for antibiotic stewardship purposes. This provided an opportunity to quantify healthcare-associated (HA) conversion of MRSA surveillance cultures in the NICU. The primary goal of this study was to determine the effect discontinuing contact precautions for children infected or colonized with MRSA had on MRSA HAIs in a large pediatric healthcare system. In addition, we wanted to identify the frequency of HA conversion of MRSA surveillance cultures in a NICU that was not isolating patients for MRSA.
Methods
This retrospective, nonrandomized, observational, quasi-experimental study was conducted in a large tertiary academic pediatric health system in the southeastern US that includes two large free-standing tertiary academic hospitals. Total inpatient beds of the two free-standing hospitals was 765 inpatient beds, of which 32.5% were designated for critical care. NICU admissions are transferred from surrounding nurseries and NICUs for infants requiring services not available at the transferring facility. NICU A is 39-bed Level 4 NICU located within one of the tertiary children’s hospitals (Hospital A). NICU A provides care for a variety of complex critically ill medical and surgical patients except for extracorporeal membrane oxygenation or cardiac care. Neonates requiring this type of care are transferred to or admitted to Hospital B, which provides these services. NICU B is a 60-bed Level 4 NICU. This project was reviewed by the hospital’s Institutional Review Board and was determined to not be human subjects research.
In October 2018, contact precautions were discontinued for children with infection or colonization with MRSA, VRE and ESBL-E. Prior to discontinuation of contact precautions, a formal risk assessment was performed and approved by the Infection Prevention Committee. Symptom-based contact precautions was continued, regardless of the pathogen, for wound infections that could not be completely covered, wound/abscess drainage that could not be entirely contained by a dressing and children with gastrointestinal illness symptoms. Contact precautions was also continued for patients infected with carbapenem-resistant Enterobacterales and other highly antibiotic-resistant Gram-negative bacilli and children infected or colonized with Candida auris.
In March of 2024, NICU A began screening infants for MRSA with the goal of reducing unnecessary vancomycin use. Studies in neonates have demonstrated a high negative predictive value of negative MRSA nasal screening for invasive MRSA disease. Reference Braga, Rajapakse, Heyliger, Dierkhising and Dinnes17,Reference Magers, Prusakov, Speaks, Conroy and Sánchez18 This process was used to identify infants at low risk of MRSA invasive disease who could safely be managed without empiric vancomycin. A nasal swab was collected using an Eswab (Copan Diagnostics, Murrieta, CA) of both nares and sent to the microbiology lab for MRSA culture for all infants hospitalized in NICU A upon admission and again every two weeks. The nasal swab specimen was inoculated onto a BD BBL CHROMagar MRSA II agar plate (Becton, Dickinson and Company, Franklin Lakes, NJ) and the package insert was followed for determining if MRSA was present or not. MRSA screening continued unless the infant had a positive nasal culture for MRSA, had an infection due to MRSA or was discharged from the NICU. The admission order set in the electronic medical record was updated to include an order for the MRSA nasal screening process. Education was provided to the NICU A staff through the routine unit education processes. Nursing leadership and the antibiotic stewardship team regularly reviewed patient medical records to ensure that the MRSA nasal screenings occurred as intended. Although the MRSA screening process was primarily implemented for antibiotic stewardship purposes, it provided the opportunity to identify potential cases of HA MRSA surveillance culture conversion. Probable HA MRSA conversion was defined as patients whose first positive culture for MRSA occurred after an initial negative admission screening test.
Because HAIs due to VRE or ESBL-E were relatively rare in our system, especially in our neonatal population, we focused on the impact that discontinuing contact precautions had on the rate of MRSA HAIs. MRSA screening in NICU A did not begin until March of 2024, so we were unable to compare HA MRSA conversion before and after discontinuing contact precautions in October of 2018. Having said that, the assumption is that HA MRSA conversion would be either the same or more frequent after discontinuing contact precautions. Our data provides a snapshot of HA MRSA conversion in a NICU that was not isolating for MRSA.
Healthcare worker hand hygiene was recorded by covert direct observation by trained healthcare worker volunteers and recorded real-time using an electronic tool. The observation program began in 2007, but it was redesigned in July of 2018 to increase the number and validity of the observations. Hand hygiene moments included entering the patient room/care area, exiting the patient room/care area and prior to accessing or inserting a line or catheter. Standard evidence-based prevention bundles for CLABSIs, catheter-associated urinary tract infections (CAUTIs) and ventilator-associated pneumonias (VAPs) had been implemented since 2005 and were monitored through a combination of documentation in the electronic medical record and direct observation. Prospective surveillance for HAIs is performed by members of the infection prevention team using standard National Healthcare Safety Network definitions, including standard surveillance definitions for CLABSI, CAUTI and VAP.
The annual MRSA HAI rate was calculated per 1,000 patient days and was reported for the System, Hospital and NICU from 2014 through 2025. The annual MRSA HAI rate was displayed using statistical process control charts (U chart), annotated with the date contact precautions was discontinued. Standard rules were used to determine whether a special cause (change in the data unlikely due to chance) had occurred. Reference Benneyan19 The annual CLABSI, CAUTI and VAP rates were reported per 1,000 device days for the System, Hospital and NICU from 2014 to 2025. Hand hygiene compliance represented the percentage of compliant observations divided by the total observations and was reported for the System, Hospital and NICU. Data were reported from July 2018 to December 2025. MRSA screening tests were reported as the total number of screening tests performed and the number of individual patients with at least one MRSA screening test. If a patient did have multiple positive screening tests, only the first positive screening culture for MRSA for a patient was included. The percentage of patients with a positive screening test for MRSA was categorized based on whether the positive screen was identified on the initial or a subsequent screen.
Results
MRSA HAI rates for the System, Hospital A, Hospital B, NICU A and NICU B are shown in Figure 1. There was a special cause downward centerline shift of the annual MRSA HAI rate for the System (Figure 1A), Hospital A (Figure 1B) and Hospital B (Figure 1C) beginning in 2019. For NICU A and NICU B, annual MRSA HAI rates remained stable after discontinuing contact precautions, Figures 1D and 1E, respectively. There was a non-special cause increase in the MRSA HAI rate in NICU A in 2022. In reviewing the eight infections for that year, infections were scattered over five months of the year with two infections occurring in March, June and August and single infections in July and December
Statistical process control chart showing the annual Rate of Methicillin-Resistant Staphylococcus aureus (MRSA) healthcare-associated infections. (A) Statistical process control chart showing the annual rate of MRSA healthcare-associated infections for the healthcare System. (B) Statistical process control chart showing the annual rate of MRSA healthcare-associated infections for hospital A. (C) Statistical process control chart showing the annual rate of MRSA healthcare-associated infections for hospital B. (D) Statistical process control chart showing the annual rate of MRSA healthcare-associated infections for NICU A. (E) Statistical process control chart showing the annual rate of MRSA healthcare-associated infections for NICU BNICU is neonatal intensive care unit.

Figure 1. Long description
Panel A: A line graph shows the annual MRSA HAI rate per 1000 patient days for the healthcare system from 2014 to 2025. The y-axis represents the MRSA HAI rate per 1000 patient days, ranging from 0 to 0.5. The x-axis represents the years from 2014 to 2025. The graph includes a line for the annual MRSA HAI rate, a line for the average rate of MRSA HAIs, and dashed lines for control limits. A notable annotation indicates that contact precautions were discontinued in October 2018. The trend shows a general decline in the MRSA HAI rate from 2014 to 2021, with a slight increase in 2024 and 2025. Panel B: A line graph shows the annual MRSA HAI rate per 1000 patient days for hospital A from 2014 to 2025. The y-axis represents the MRSA HAI rate per 1000 patient days, ranging from 0 to 0.35. The x-axis represents the years from 2014 to 2025. The graph includes a line for the annual MRSA HAI rate, a line for the average rate of MRSA HAIs, and dashed lines for control limits. A notable annotation indicates that contact precautions were discontinued in October 2018. The trend shows a general decline in the MRSA HAI rate from 2014 to 2021, with a slight increase in 2024 and 2025. Panel C: A line graph shows the annual MRSA HAI rate per 1000 patient days for hospital B from 2014 to 2025. The y-axis represents the MRSA HAI rate per 1000 patient days, ranging from 0 to 0.5. The x-axis represents the years from 2014 to 2025. The graph includes a line for the annual MRSA HAI rate, a line for the average rate of MRSA HAIs, and dashed lines for control limits. A notable annotation indicates that contact precautions were discontinued in October 2018. The trend shows a general decline in the MRSA HAI rate from 2014 to 2021, with a slight increase in 2024 and 2025.
Table 1 shows the annual CLABSI, CAUTI and VAP rates from 2014 to 2025 for the System, Hospital A, Hospital B, NICU A, and NICU B. The CLABSI rate for the System, each hospital and each NICU decreased from 2014 to 2019. During the COVID-19 pandemic, there was an increase in CLABSI rates across our system. The postpandemic peak CLABSI rates remained below the 2014 CLABSI rates except for NICU A in which the CLABSI rate was similar. CAUTI rates decreased during the first couple of years of reported data; then remained relatively stable. The VAP rate for NICU A increased between 2018 and 2019 and drove similar increases in Hospital A and System VAP rates. The increase was not due to MRSA and was not seen at Hospital B or NICU B. During this time frame, there were no changes to national or local VAP definitions. The reason for the increase is unclear. From 2019 through 2025, VAP rates remained stable.
Annual healthcare-associated infection rates from 2014–2025

Table 1. Long description
A table comparing annual healthcare-associated infection rates from 2014 to 2025 for different systems and hospitals. The table has 12 columns and 17 rows, including headers. Column headers are Year, System, Hospital A, Hospital B, NICU A, and NICU B. Row labels include CLABSI, CAUTI, and VAP rates for each year from 2014 to 2025. Row 1: Year, 2014, 2015, 2016, 2017, 2018, 2019, 2020, 2021, 2022, 2023, 2024, 2025. Row 2: System, CLABSI, 1.97, 1.96, 1.64, 1.23, 0.98, 0.56, 0.75, 0.81, 0.9, 1.17, 1.31, 1.19. Row 3: System, CAUTI, 3.48, 1.86, 0.88, 0.52, 1.25, 1.04, 0.94, 0.67, 0.87, 1.08, 0.69, 0.97. Row 4: System, VAP, 0.18, 0.13, 0.18, 0.12, 0.08, 0.26, 0.24, 0.25, 0.46, 0.29, 0.33, 0.37. Row 5: Hospital A, CLABSI, 1.6, 1.15, 1.68, 0.79, 0.78, 0.37, 0.37, 0.48, 0.74, 0.66, 0.93, 0.93. Row 6: Hospital A, CAUTI, 4, 3.2, 0.8, 0.63, 0.7, 0.89, 1.78, 1.17, 0.86, 0.58, 1.05, 1.54. Row 7: Hospital A, VAP, 0.1, 0, 0.1, 0.1, 0, 0.55, 0.39, 0.31, 0.62, 0.16, 0.29, 0.47. Row 8: Hospital B, CLABSI, 2.2, 1.99, 2.62, 1.51, 1.09, 0.67, 0.96, 1, 1, 1.48, 1.57, 1.25. Row 9: Hospital B, CAUTI, 3.2, 1.2, 0.9, 0.44, 1.61, 1.19, 0.28, 0.25, 0.89, 1.52, 0.49, 0.65. Row 10: Hospital B, VAP, 0.2, 0.23, 0.24, 0.15, 0.07, 0.07, 0.15, 0.21, 0.37, 0.36, 0.35, 0.31. Row 11: NICU A, CLABSI, 0.8, 0.53, 1.05, 0.45, 1.75, 0.19, 0.45, 0.31, 0.97, 0.38, 0.98, 0.85. Row 12: NICU A, CAUTI, 2.3, 0, 3.3, 0, 0, 0, 2.1, 0, 0, 0, 0, 0. Row 13: NICU A, VAP, 0, 0, 0.3, 0, 0, 0.95, 0.65, 0.54, 0.95, 0.21, 0.39, 0.73. Row 14: NICU B, CLABSI, 1.3, 1.2, 1.32, 0.77, 1.38, 0.4, 0.83, 1.37, 0.79, 1.32, 1.29, 1.03. Row 15: NICU B, CAUTI, 1.7, 1.56, 0, 0, 0, 0, 0, 0, 0, 3.24, 0, 1.49. Row 16: NICU B, VAP, 0, 0.22, 0.25, 0.22, 0, 0, 0.2, 0, 0.16, 0.44, 0.3, 0.28.
CLABSI is central line-associated bloodstream infection. CAUTI is catheter-associated urinary tract infection. VAP is ventilator-associated pneumonia. NICU is neonatal intensive care unit.
CLABSI rate is infections per 1000 line days. CAUTI rate is infections per 1000 catheter days. VAP rate is infections per 1000 ventilator days.
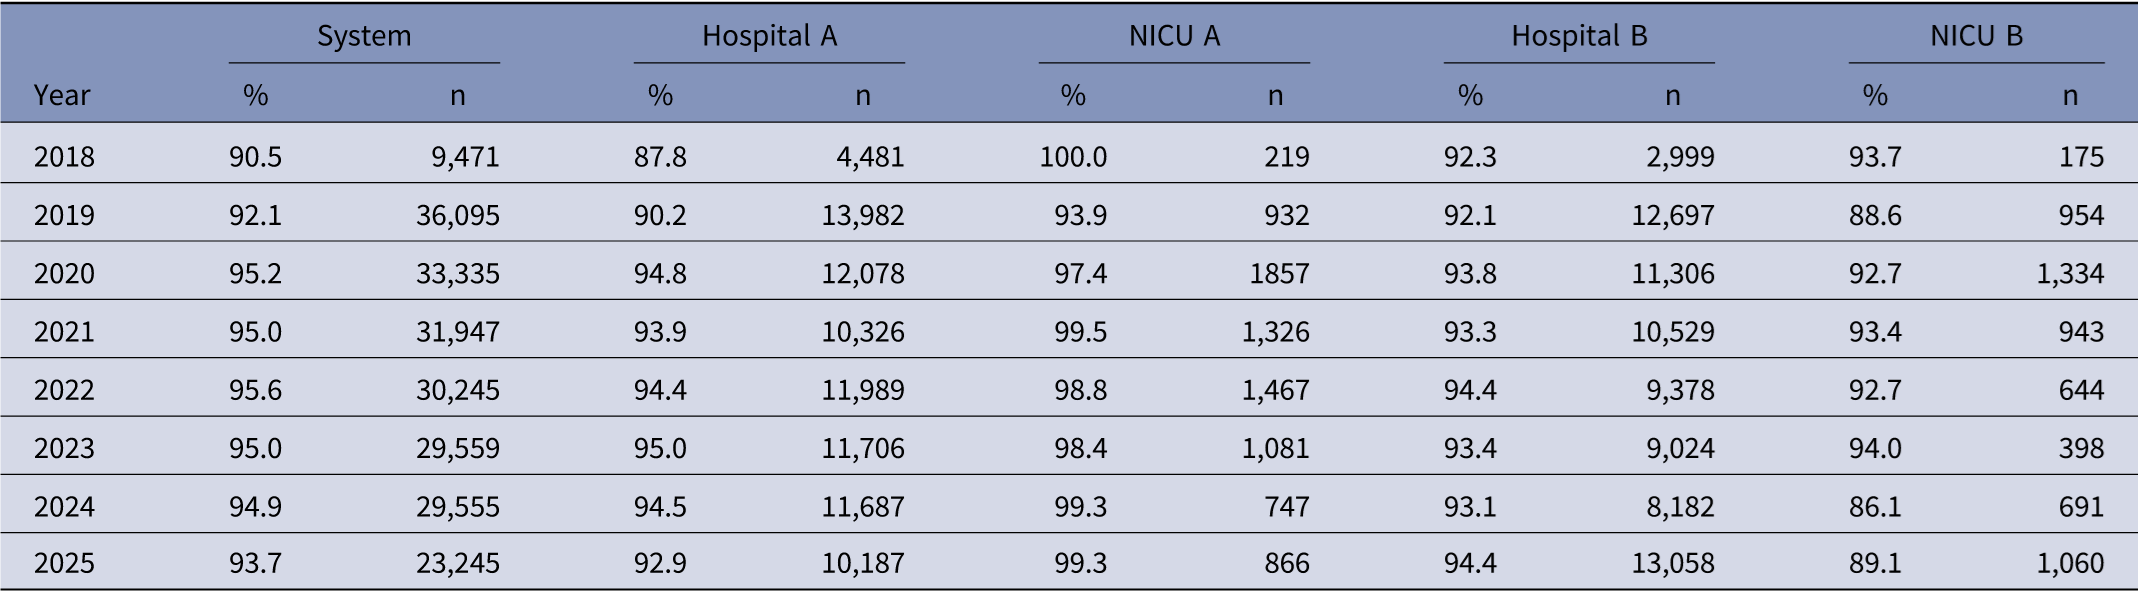
The annual hand hygiene compliance for the healthcare System, Hospitals A and B, and NICUs A and B are shown in Table 2. In general, hand hygiene ranged from 90%–95% for all locations. The annual hand hygiene compliance of the two NICUs differed, NICU A (93.9%–100%) and NICU B (86.1%–94.0%).
Percentage of healthcare worker observations with correct hand hygiene

Table 2. Long description
The table presents annual hand hygiene compliance percentages for a healthcare system, Hospital A, NICU A, Hospital B, and NICU B from 2018 to 2025. It includes six columns: Year, System, Hospital A, NICU A, Hospital B, and NICU B. Each column is divided into percentage and count (n) sub-columns. The table has eight rows, each representing a year from 2018 to 2025. Row 1: 2018, System: 90.5 percent, 9,471; Hospital A: 87.8 percent, 4,481; NICU A: 100.0 percent, 219; Hospital B: 92.3 percent, 2,999; NICU B: 93.7 percent, 175. Row 2: 2019, System: 92.1 percent, 36,095; Hospital A: 90.2 percent, 13,982; NICU A: 93.9 percent, 932; Hospital B: 92.1 percent, 12,697; NICU B: 88.6 percent, 954. Row 3: 2020, System: 95.2 percent, 33,335; Hospital A: 94.8 percent, 12,078; NICU A: 97.4 percent, 1,857; Hospital B: 93.8 percent, 11,306; NICU B: 92.7 percent, 1,334. Row 4: 2021, System: 95.0 percent, 31,947; Hospital A: 93.9 percent, 10,326; NICU A: 99.5 percent, 1,326; Hospital B: 93.3 percent, 10,529; NICU B: 93.4 percent, 943. Row 5: 2022, System: 95.6 percent, 30,245; Hospital A: 94.4 percent, 11,989; NICU A: 98.8 percent, 1,467; Hospital B: 94.4 percent, 9,378; NICU B: 92.7 percent, 644. Row 6: 2023, System: 95.0 percent, 29,559; Hospital A: 95.0 percent, 11,706; NICU A: 98.4 percent, 1,081; Hospital B: 93.4 percent, 9,024; NICU B: 94.0 percent, 398. Row 7: 2024, System: 94.9 percent, 29,555; Hospital A: 94.5 percent, 11,687; NICU A: 99.3 percent, 747; Hospital B: 93.1 percent, 8,182; NICU B: 86.1 percent, 691. Row 8: 2025, System: 93.7 percent, 23,245; Hospital A: 92.9 percent, 10,187; NICU A: 99.3 percent, 866; Hospital B: 94.4 percent, 13,058; NICU B: 89.1 percent, 1,060.
NICU is neonatal intensive care unit.
The current hand hygiene observation program began in July of 2018.
Hand hygiene observations include upon entering and exiting the patient room/bed space and prior to accessing or inserting a line or catheter. Starting in February 2025 observations also included prior to contact with the patient.
Observations were made on a variety of healthcare worker types including nurses, physicians, advance practice providers, respiratory therapists, patient care technicians and resident physicians.
System observations included additional locations within the system other than Hospitals A and B such as urgent cares and outpatient surgery.
Between March 2024 and December 2025, there were 1904 MRSA screening tests performed on 682 patients. Thirty-seven patients (5.4%) had a positive MRSA screening test. Of these, the initial screening test was positive in 16 (2.3%) patients. There were 21 patients (3.1%) who subsequently tested positive for MRSA despite having one or more prior negative MRSA screening tests. The median number of days between their first negative screening test and the positive test was 73 days (range 7–217 d). One of these patients developed a MRSA HAI.
Discussion
We were able to demonstrate in a large quaternary pediatric health system including two large free-standing children’s hospitals that MRSA HAI rates remained stable or decreased for seven years after discontinuing contact precautions for patients infected or colonized with MRSA. This included stable MRSA HAI rates in both NICUs. In addition, active MRSA surveillance in NICU A showed that HA conversion of MRSA surveillance cultures was uncommon despite lack of contact precautions.
The prevalence of MRSA in the community impacts the frequency of MRSA infections in healthcare settings. The increase in community-associated MRSA (CA-MRSA) in the community was followed by an increase in CA-MRSA HAIs. Reference Otter and French20,Reference Skov and Jensen21 Over the past decade, there has been a decreased prevalence of MRSA in the community. Reference Carrel, Smith and Shi22 This has been paralleled by a decrease in MRSA HAIs. Reference Jones, Jernigan, Evans, Roselle, Hatfield and Samore23 Most of the studies examining the impact of discontinuing contact precautions for MRSA have monitored MRSA HAI rates with the goal demonstrating no increase in HAIs. Interestingly, a few of the studies showed decreased MRSA HAI rates that either preceded or coincided the discontinuation of contact precautions. Reference Godbout, Rittmann and Fleming4,Reference Bearman, Abbas and Masroor5,Reference Marra, Edmond, Schweizer, Ryan and Diekema24 Although community rates of MRSA were not reported, the observed decrease was likely at least in part due to the decreasing prevalence of MRSA. Similarly, the annual MRSA HAI rate for our System, Hospital A, and Hospital B decreased, and this coincided with a decrease in statewide MRSA rates from 49% to 33.5% over the past ten years. Reference Linam, Goldstein, Huang, Westbrook, Jerris and Gonzalez25 Baseline low MRSA and VRE HAI rates are found to be an important facilitator of success in discontinuing contact precautions for MRSA and VRE. Reference Martin, Colaianne and Bridge11 Understanding the community prevalence of MRSA and other MDROs also may be important when considering discontinuing contact precautions.
The CLABSI rates for our healthcare system steadily decreased from 2014 through 2019. During the pandemic, there was an increase in CLABSIs across our system, which has since stabilized. Increased device-associated HAIs following the pandemic have been reported in both adult and pediatric settings. Reference Weiner-Lastinger, Pattabiraman and Konnor26,Reference Pérez-Granda, Carrillo and Rabadán27 Interestingly, despite an increase in CLABSI and relative stability of other device-associated HAIs during the pandemic, our MRSA HAI rates remained stable during the same time frame. The decrease in MRSA in our community may have offset the increase in overall HAIs after the pandemic leading to stable MRSA HAI rates during that time.
In addition to tracking the change in the HAI rates for MRSA and VRE, a few studies also measured device-associated HAI rates for all pathogens. Reference Haessler, Martin and Scales3–Reference Bearman, Abbas and Masroor5 In these studies, the decreases in MRSA and VRE HAIs paralleled a decrease in overall device-associated HAI rates. Reference Haessler, Martin and Scales3–Reference Bearman, Abbas and Masroor5 Strong horizontal infection prevention measures were reported as key to safely discontinuing contact precautions. Reference Godbout, Rittmann and Fleming4,Reference Bearman, Abbas and Masroor5 The observed decrease in MRSA HAI rates in our system followed the decrease in overall device-associated HAIs. It is not surprising that interventions such as hand hygiene and prevention bundles for device-associated infections known to reduce HAIs would also reduce HAIs due to MRSA and other MDROs. Our findings add to prior work suggesting that HAI rates for MRSA and other MDROs follow overall HAI rate trends. Low or decreasing overall HAI rates may serve as another important marker as part of a risk assessment for hospitals considering discontinuing contact precautions for MRSA and other MDROs.
A strength of this project is the description of our experience discontinuing contact precautions in our two NICUs. This population is at increased risk of morbidity and mortality due to MRSA infections. Understanding the impact in this high-risk setting is necessary as hospitals assess the risks and benefits of removing contact precautions in the NICU. We demonstrated stable MRSA HAI rates in both NICUs for 7 years after discontinuing contact precautions for MRSA. While this is noteworthy, it is also important to understand MRSA transmission patterns in the NICU and how they may be affected by removing contact precautions for MRSA. Preterm neonates who acquire MRSA colonization are at increased risk of developing MRSA infection. Reference Zervou, Zacharioudakis, Ziakas and Mylonakis28 We collected active surveillance cultures in NICU A for almost two years. While we do not have data prior to removing contact precautions, our surveillance data provide a snapshot of MRSA colonization after the change in isolation process. The overall MRSA positivity in NICU A was 5.4%. A meta-analysis examining MRSA prevalence in children upon ICU admission showed an overall prevalence of 1.9%. Colonization of outborn neonates at the time of NICU admission was higher (5.8%). Reference Zervou, Zacharioudakis, Ziakas and Mylonakis28 That study showed that the pooled rate of MRSA acquisition during ICU admission in children was 4.1%, but it was 6.1% in the NICU. In another study evaluating MRSA acquisition in three US NICUs before and during the SAR-CoV 2 pandemic, HA-MRSA was 14.8% and 15.1%, respectively. Reference Elhaissouni, Arthur and Prochaska29 Acquired colonization of MRSA in NICU A was identified in 3.1% of screened infants, which is lower than reported in some studies. In a German study tracking MRSA in the NICU over an 8-year period, the MRSA rate was low, 0.7 patients per 100 patients, but 50% of the patients acquired MRSA during their NICU stay. Reference Böhne, Knegendorf and Schwab30 Similar to this study, about half of the neonates colonized with MRSA in NICU A acquired colonization after admission. We were unable to determine relative frequency of HA conversion of MRSA due to contaminated healthcare worker hands, contaminated equipment or colonized parents/visitors. When considering discontinuing contact precautions in the NICU for MRSA or other MDROs, the overall HAI rates and hand hygiene behavior of staff describe the infection prevention culture on the unit and are foundational when performing a risk assessment. Pathogen-specific data for HAIs, outbreaks, active surveillance cultures, and community prevalence provide additional guidance when determining whether contact precautions can be modified or discontinued.
There are a few notable limitations. This study was performed in a large pediatric healthcare system with well-developed infection prevention processes; therefore, other pediatric settings may not achieve similar results. This study did not evaluate the impact of discontinuing contact precautions on HAI rates of other MDROs. Active surveillance for MRSA began in March of 2024, so we were unable to compare HA MRSA conversion rates before and after discontinuing contact precautions. Additionally, active surveillance was only performed in NICU A, so the rate of MRSA transmission in other areas is not known. Having said that, if contact precautions were essential, we would expect HA MRSA conversion rates to be stable or higher after discontinuation, and the conversion rate in NICU A was low. Finally, we did not perform whole genome sequencing to determine whether any of the MRSA strains detected in NICU A were related.
In a large pediatric healthcare system with reliable infection prevention processes, including healthcare worker hand hygiene, discontinuing contact precautions for children infected or colonized with MRSA did not result in an increase in MRSA HAI rates, including in high-risk populations such as the NICU. In addition, HA conversion of MRSA in the NICU after discontinuing contact precautions was low. Future studies are needed to determine if contact precautions can safely be discontinued in children for other MDROs such as VRE and ESBL-E.
Acknowledgments
None.
Financial support
None reported.
Competing interests
All authors report no conflicts of interest relevant to this article.



 Open access

