Implications
Experimental findings are essential in feed formulation, especially to ensure an adequate amino acid balance. Despite numerous publications, there is no consensus concerning the Trp requirement in piglets. Because the results from a single trial are specific to the conditions under which observations are made, there is a need to aggregate results from different studies. Modelling the response of piglets to the Trp supply can be used also as a tool to evaluate the cost of the additional Trp supply relative to the risk of reduced performance due to a Trp deficiency.
Introduction
Besides being a constituent of body protein, Trp also plays other important roles in metabolism. It is involved in feed intake regulation (Henry et al., Reference Henry, Sève, Mounier and Ganier1996; Zhang et al., Reference Zhang, Jingdong, Defa, Xuan and Xilong2007) in the immune response and in the animal's defence system (Melchior et al., Reference Melchior, Sève and Le Floc'h2004 and Reference Melchior, Mézière, Sève and Le Floc'h2005). Increasing the Trp content in the diet has also been shown to limit the impact of an unfavourable sanitary environment on performance in pigs (Le Floc'h et al., Reference Le Floc'h, Melchior and Sève2008 and Reference Le Floc'h, Matte, Melchior, van Milgen and Sève2010; Trevisi et al., Reference Trevisi, Melchior, Mazzoni, Casini, Filippi, Minieri, Lalatta-Costerbosa and Bosi2009). Being an indispensable amino acid (AA) for pigs, Trp has to be supplied by the diet in sufficient quantities to cover the animal's requirement.
Although it is difficult to precisely define the term ‘requirement’ (Mercer et al., Reference Mercer, May and Dodds1989), for growing animals it is usually defined as the minimum supply of an AA that maximizes growth. For monogastric animals, AA requirements are often expressed based on the concept of ideal protein. The composition of ideal protein is such that all the AAs are equally limiting for performance. The ideal AA profile (i.e. the composition of ideal protein) corresponds to the minimum supply of AA required to maximize growth, nitrogen retention or another response criterion. Because Lys is the first-limiting AA for performance in growing pigs fed with cereal-based diets, the AA profile is often expressed relative to Lys. Although the concept of ideal protein was developed in the late 1950s and early 1960s, the first quantitative information concerning its composition in growing pigs was reported 30 years later (Wang and Fuller, Reference Wang and Fuller1989). For a given stage of production, the ideal AA profile is often considered to be constant. This means that only variation in the Lys requirement (per kg of feed) has to be accounted for in feed formulation.
Requirements can be determined in dose–response studies; however, reported results can be quite variable. Concerning Trp, the reported standardized ileal digestible (SID) Trp : Lys requirement in piglets varies between 17% and 23% (Lewis et al., Reference Lewis, Peo, Cunningham and Moser1977; Susenbeth and Lucanus, Reference Susenbeth and Lucanus2005; Jansman et al., Reference Jansman, van Diepen and Melchior2010). Because experimental conditions and analysis methods may differ between experiments, direct comparison of the reported requirement estimates is rather delicate. Meta-analyses are often used to combine results of several experiments and allow identifying sources that contribute to variation within an experiment and between experiments (Sauvant et al., Reference Sauvant, Schmidely, Daudin and St-Pierre2008). The objective of this study is to perform a meta-analysis to determine the SID Trp : Lys ratio that maximizes average daily gain (ADG), average daily feed intake (ADFI) and gain-to-feed ratio (G : F) in piglets, as well as to identify factors of variation of the Trp requirement.
Material and methods
Data and preliminary data investigation
A database comprising a total of 130 experiments was constructed from a dataset of 155 scientific publications (articles or abstracts) and trial reports from research institutes. These experiments, reported in 2008 or earlier, concerned piglets between 7 and 25 kg live weight (LW) offered feed ad libitum, and aimed to estimate the Trp requirement using a basal diet supplemented with different levels of crystalline Trp. Only experiments that reported information about the feedstuffs used in the experimental diets were entered in the database. The database contains information about the trial (e.g. authors, date), experimental design (e.g. number of repetitions per treatment, number of animals per repetition, weight range of the piglets), ingredient composition of the basal diet, nutritional values of the experimental diets and performance information (i.e. ADG, ADFI, G : F).
One of the main challenges of the meta-analysis was the evaluation of the experimental diets. Not all publications reported the nutritional composition of the diets, especially for AAs other than Trp, and the methods of expressing these values varied largely between experiments (e.g. anticipated v. measured values, or total v. (apparent or standardized) ileal digestible). To obtain the complete AA profiles and to standardize values on an SID basis, the EvaPig® software (Noblet et al., Reference Noblet, Valancogne and Tran2008), which uses information from the INRA–AFZ (Institut National de la Recherche Agronomique – Association Française de Zootechnie, Paris, France) tables of feedstuffs composition (Sauvant et al., Reference Sauvant, Perez and Tran2004), was used to calculate the nutritional values from the feed ingredients. Calculated nutritional values were compared with those reported by the authors (if available) by regression analysis.
A preliminary graphical analysis was performed using the Minitab 15 Statistical Software (Minitab Inc., Pennsylvania) to identify outliers and to evaluate the nature of the between- and within-study relationships. To facilitate this analysis, different weight categories of piglets were defined using a discriminant analysis with age, initial and final weights and duration of the experiment as predictors.
Experiment selection
To express the Trp requirement as a Trp : Lys ratio, Lys needs to be the second-limiting AA after Trp, whereas the supply of the other AAs should meet or slightly exceed the requirement (Boisen, Reference Boisen2003). To verify that these conditions were respected, two frequently used requirement standards were chosen (National Research Council (NRC), 1998; Whittemore et al., Reference Whittemore, Hazzledine and Close2003). To verify that Lys was indeed limiting in the diets, the SID Lys content of each diet was calculated and compared with the SID Lys requirements for each weight class of piglets, using requirement estimates provided by these two standards. Experiments in which the SID Lys dietary content was greater than the lowest requirement standard were not considered further in the meta-analysis. For the remaining experiments, to ensure that no other indispensable AA (i.e. Thr, Met (+Cys), Val, Ile, Leu, His, Phe (+Tyr), Arg) was limiting for performance before Lys, the SID AA : Lys dietary content was calculated for all other indispensable AAs. If these ratios appeared to be lower than the highest requirement standard, the experiment was not used in the meta-analysis. Also, to ensure that a reasonable dose–response analysis could be carried out, only experiments with at least three levels of Trp were retained initially. Experiments with two levels of Trp and dose–responses published after 2008 (Supplementary Table 1) were used as external data to validate the results.
Statistical models
The response of the piglets to the increasing Trp was modelled using non-linear models: linear-plateau (LP), curvilinear-plateau (CLP) and asymptotic (ASY) models:


where Yij is the response criterion (i.e. ADG, ADFI, G : F) for observation j of experiment i, xij is the SID Trp : Lys supply, Ai is the maximum response for experiment i (i.e. plateau), R is the minimum SID Trp : Lys supply required to reach the plateau and U, a and b are parameters describing the response to the Trp : Lys supply before the plateau value. The residual error term εij is assumed to be independent and normally distributed. Most of the variation between experiments is because of scale differences caused by differences in experimental conditions, including differences in BW. It is for this reason that we included a scale parameter (Ai) and there are thus as many Ai's as there are experiments. The other model parameters were initially assumed to be constant between experiments. The experimental effect Ai was a fixed effect because the plateau values were not normally distributed (data not shown). For models LP and CLP, R can be interpreted as the SID Trp : Lys requirement ratio. Because the Ai is never reached in model ASY, the requirement was calculated as the SID Trp : Lys ratio required to reach 95% of Ai. The PROC NLIN procedure of SAS was used for analysis (Statistical Analysis Systems Institute Inc., 2008). To account for possible variation in R, the analysis has been extended by assuming the existence of two (or more) values for R. For example, the database contains data originating from peer-reviewed journal articles and data from other sources (e.g. abstracts and trial reports). For these two sources of data, different estimates for R were obtained and an F-test was used to test whether these estimates differed (Ratkowsky, Reference Ratkowsky1990). The same approach was used to test whether R depended on the type of diet: corn-based diets (where corn represented more than 60% of the total diet) v. diets based on a mix of cereals. These analyses were carried out with the CLP model. We have taken the approach where all variation between experiments was attributed initially to scale effects, and we then expanded the model to investigate whether other factors (i.e. publication type, diet type) could be included to explain the variation. An alternative approach would be one where all model parameters could vary between experiments and then try to reduce the model by combining parameters across experiments. This approach is more delicate because of the possibility of over-parameterization of the initial model (e.g. a dose–response curve with three points would be explained by a model with three parameters).
Results
Preliminary data investigation
Among the 130 experiments, 25 dealt specifically with prestarter period (piglets of 7 to 10 kg LW), 53 with starter period (11 to 24 kg LW) and 52 with the combined prestarter–starter period (7 to 22 kg LW). The 130 experiments were carried out between 1971 and 2008, with most of these after 2000. Fifty-eight percent of the 130 experiments originated from Europe, 33% from the USA and 9% from other countries. European experiments were more recent (80% were published after 2000) than American experiments (47% since 2000). Among the 130 experiments, 36% were published in peer-reviewed journals, whereas the remainders were not peer-reviewed (50% in trial reports, 12% in publications of congresses and 2% in local magazines).
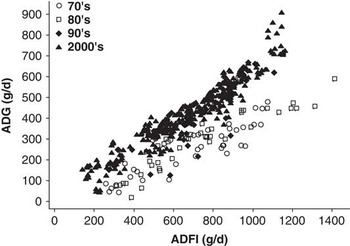
To verify the consistency of the database, ADG was expressed as a function of ADFI (Figure 1). No clear outliers are apparent and there appeared to be two populations of piglets differing in feed efficiency related to the period during which the experiments were carried out. The feed efficiency was lower in older experiments compared with those carried out in the 2000s.
Average daily gain as a function of average daily feed intake for each experiment depending on publication date.

Regressions between calculated and reported nutritional values of the experimental diets showed in general good agreement. In the case of Lys, the slope was not different from 1 (P = 0.78) and intercept from 0 (P = 0.72), meaning that the recalculated values are not different from the reported values. In the case of Trp, the slope was not different from 1 (P = 0.15), but the intercept slightly differed from 0 (P = 0.03). The recalculated Trp values were 0.004% lower than the reported values. To express nutritional values on an SID basis and to verify the complete AA profile for all diets, calculated nutritional values were used in the analyses.
Selection of relevant experiments
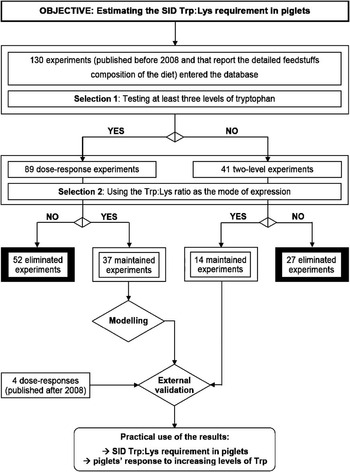
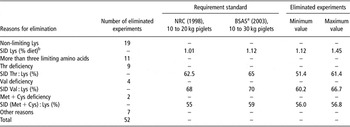
Among the 130 initial experiments, 41 were eliminated because only two levels of Trp were used (Figure 2). Among the 89 remaining experiments, 52 were eliminated either because Lys was not limiting (19 experiments) or because other AAs may have been second-limiting before Lys (Table 1). For example, nine experiments were not considered because of a likely Thr deficiency (with an average value of 58% SID Thr : Lys) and four experiments because of a likely Val deficiency (average value of 64% SID Val : Lys). Thirty-seven experiments were retained in the meta-analysis (Supplementary Table 2).
Schematic representation of the main steps of data selection for the meta-analysis.

Reasons for not considering experiments with at least three levels of Trp in the meta-analysis

NRC = National Research Council; BSAS = British Society of Animal Science; SID = standardized ileal digestible.
aWhittemore et al. (Reference Whittemore, Hazzledine and Close2003).
bThe SID Lys (% diet) reported for BSAS corresponds to the ‘Intermediate’ pig type.
Analysis of the selected experiments
Animal characteristics and nutritional values of the selected experiments are given in Supplementary Tables 3 and 4. The tested SID Trp : Lys ratios followed a normal distribution with an average value of 17.1 ± 4.3%. Most experiments were carried out using an SID Trp : Lys range from 12% to 23%.
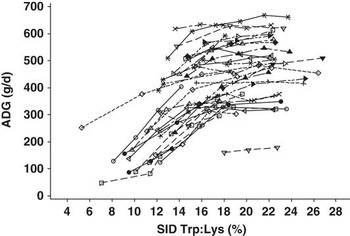
In most experiments, ADG increased with increasing SID Trp : Lys supply to reach a plateau at higher levels of Trp (Figure 3). There appeared to be considerable variation between experiments in the level of the plateau.
Average daily gain as a function of the standardized ileal digestible Trp : Lys content of the diets in the 37 experiments designed to estimate the Trp requirement in piglets as a ratio to Lys.

Estimation of the SID Trp : Lys ratio requirement
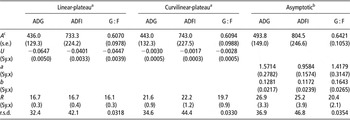
The average value of the estimates of Ai (plateau values) ranged from 436 to 494 g/day for ADG, from 733 to 805 g/day for ADFI and from 0.61 to 0.64 for G : F (Table 2). The lowest estimates for Ai were obtained for model LP and the highest for model ASY. Estimates of R ranged between 16.1% and 26.9% SID Trp : Lys, with the lowest values obtained by model LP and the highest values by model ASY. The R was slightly lower when G : F was used as a response criterion, compared with ADG and ADFI. Results concerning the shape of the curve before the plateau value (U parameter) cannot be compared directly between models LP and CLP because of the structural form of the equations.
Parameters estimates for the different equations and for the different response variables

ADG = average daily gain; ADFI = average daily feed intake; G : F = gain-to-feed ratio; SID = standardized ileal digestible.
Standard errors are given in parentheses: s.e. = standard error of mean; Sy.x = standard error of estimate.
aR parameter corresponds to the SID Trp : Lys (%) level needed to reach the plateau.
bR parameter corresponds to the SID Trp : Lys (%) level needed to reach 95% of the plateau.
cMean of the Ai.
Factors possibly affecting the SID Trp : Lys requirement
In 32 of the 37 experiments, the authors reported both the Lys and Trp contents of the diets. In these 32 experiments, regression analyses were also performed using the reported Trp and Lys contents, combined with the calculated SID. The estimates of the SID Trp : Lys requirement ratio using these data and model CLP were similar to the results presented in Table 2: 21.1% for ADG, 22.0% for ADFI and 20.3% for G : F.
Among the 37 experiments retained, 15 were peer-reviewed and 22 were not. There was no difference in R between the peer-reviewed and the other publications using ADFI as response criterion (P = 0.40). For ADG and G : F, the R was on average 1 percentage-point higher in peer-reviewed experiments compared with that in other studies (P = 0.05 and P = 0.001, for ADG and G : F, respectively).
Nineteen experiments used corn-based diets and 18 experiments used diets based on a mix of cereals. The estimated R was not affected by the source of cereals in the diet (P = 0.11, 0.24 and 0.79, for ADG, ADFI and G : F, respectively).
Model evaluation
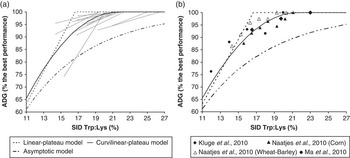
For ADG, model LP predicted an SID Trp : Lys requirement of 16.7% (Table 2). With model CLP, this estimate was higher (21.6%) and this model predicted that ADG would increase by 8% when the SID Trp : Lys supply is increased from 16.7% to 21.6%. To further evaluate the models, results of experiments with two levels of Trp were compared with model predictions. Figure 4a shows that there is a response to an increasing Trp supply in these experiments, even in those where the lowest SID Trp : Lys content was greater than 16.7% (i.e. the requirement estimated by model LP). The average increase (slope) between 16.7% and 21.6% SID Trp : Lys content was 9%, which is similar to that predicted by model CLP.
Average daily gain as a function of the standardized ileal digestible Trp : Lys ratios for experiments using two levels of Trp, and designed to express the Trp requirement relative to Lys (a). Results of experiments published after 2008 are given in (b). The three tested models are represented with their plateau values as 100% of the best performance.

The three estimated models were also compared with dose–responses reported after 2008, which were not used in the meta-analysis (Figure 4b). Among the three models, model CLP appeared to predict these experimental data the best. For instance, in the dose–response by Naatjes et al. (Reference Naatjes, Htoo, Tölle and Susenbeth2010) with corn-based diets, ADG increased by 5% between 15.6% and 16.5% SID Trp : Lys ratios. Between these two levels, model LP predicted an increased ADG of 14%, whereas model CLP estimated it at 3%. Between 17.4% and 21.1% SID Trp : Lys ratios, ADG increases by 6.5% (Naatjes et al., Reference Naatjes, Htoo, Tölle and Susenbeth2010). In this range of Trp variation, model LP predicted no increase, whereas model CLP predicted an ADG increase of 5.5%.
Discussion
The ideal protein concept
The pattern of AAs in the diet that will meet the requirement of an animal without providing an excess is referred to as ‘ideal protein’ or the ‘ideal AA profile’. Because Lys typically is the first-limiting AA in the diet, the ideal AA profile is often expressed relative to the Lys requirement. Different factors can contribute to changes in the ideal AA profile. Because the ileal digestibility can differ between AAs, the AA : Lys ratio expressed on a total basis is not necessarily the same as that expressed on a digestible basis. Also, because endogenous losses differ between AAs (Stein et al., Reference Stein, Sève, Fuller, Moughan and de Lange2007), the ideal AA profile differs between expression on an apparent ileal digestible basis or on an SID basis. This illustrates that it is essential to express requirements and feed values on the same basis. For example, the basal endogenous losses are not specifically accounted for in the apparent ileal digestibility and are considered to be a part of the feed value. The SID corrects the feed value for the basal endogenous losses (assumed to be proportional to the dry matter intake) and these losses therefore have to be accounted for in the requirement (Henry, Reference Henry1993). The AA requirement should cover the requirement for growth and maintenance. Although the ideal AA profile typically is assumed to be constant during growth, different factors may contribute to a changing AA : Lys ratio during growth (e.g. because of the differences between AAs in the requirements for maintenance and for growth, a changing contribution of maintenance to the total requirement or differences between AAs in the efficiency of utilization; Baker, Reference Baker2000). The ideal AA profile also does not account per se for interactions between AAs. For example, it has been shown that excess Leu has a negative effect on growth and aggravates the consequences of a Val deficiency (Wiltafsky et al., Reference Wiltafsky, Pfaffl and Roth2010). This is because of the fact that Leu and Val (and Ile) are branched-chain AAs that share the same enzymes during the first two steps of catabolism.
Lysine is the first-limiting AA when diets are formulated without the use of a crystalline AA. These diets will have a high CP content and most AAs (probably all but Lys) will be provided in excess. The current availability of l-Lys, dl-Met, l-Thr, l-Trp and l-Val makes it technically possible to reduce the dietary CP level and to formulate diets in which six AAs are co-limiting for performance. At the same time, the risk of providing a diet with an insufficient AA supply is therefore greater, and somewhat greater security margins may have to be considered when formulating diets.
Expressing the Trp requirement
In this study, only dose–response experiments where Lys was the second-limiting AA (after Trp) were used to determine the Trp : Lys requirement ratio. If Lys is actually the second-limiting AA after Trp, an increase in Trp supply results in an increase in the performance up to the point where Trp and Lys will be co-limiting, and this point corresponds to the Trp : Lys requirement ratio. When Lys is not second-limiting, another factor (e.g. another AA, energy, feed intake) will at some point be co-limiting with Trp, and the Trp requirement expressed as Trp : Lys will then be underestimated. The constraint where Lys should be second-limiting only applies to experimental studies aiming to express the requirement of an AA relative to Lys. In practical situations, dietary Lys supplies are higher to ensure that the piglets can fully express their growth potential.
In 19 of the 130 experiments initially collected, there were serious doubts whether Lys was the second-limiting AA after Trp. This does not invalidate these studies; however, the reported Trp requirement should not be expressed relative to Lys. For example, Susenbeth and Lucanus (Reference Susenbeth and Lucanus2005) reported an SID Trp : Lys requirement of 17% to 18% for piglets between 15 and 25 kg. The diet contained 1.30% SID Lys, which is higher than recommended for this weight range (Whittemore et al., Reference Whittemore, Hazzledine and Close2003), resulting in a possible underestimation of the Trp : Lys requirement. If Lys is not limiting in an experiment, results should be expressed relative to ADG or as a percentage in the feed.
In 33 of the 130 experiments, one or more AAs (other than Trp and Lys) were likely limiting and in some of these experiments, these AAs may have been limiting before Lys. In this case, the Trp requirement should be expressed relative to the second-limiting AA rather than to Lys. For example, Borg et al. (Reference Borg, Libal and Wahlstrom1987) estimated the SID Trp : Lys requirement at 15%; however, this value was obtained with an SID Val : Lys ratio of 48%, which is considerably lower than the recommended requirement of 70% (Whittemore et al., Reference Whittemore, Hazzledine and Close2003; Barea et al., Reference Barea, Brossard, Le Floc'h, Primot, Melchior and van Milgen2009). Because there was a response to Trp supplementation, Trp was indeed the first-limiting AA. However, at the point beyond which further Trp supplementation did not improve performance, both Trp and Val were co-limiting. This means that the Trp requirement should be expressed relative to Val, which corresponded to 31.3% SID Trp : Val. If the SID Val : Lys requirement is assumed to be at 70%, the estimated SID Trp : Lys requirement would be 21.9%. This value is in the range of requirements we obtained with the CLP model.
Data selection and relevance of the recalculation of the nutritional values
In this study, the nutritional values calculated from feed ingredients are close to those reported by the authors. This allowed evaluating whether nutrients other than Trp and Lys were potentially limiting, even when this information was not reported by the authors. Susenbeth (Reference Susenbeth2006) carried out an analysis similar to this study, but data selection was only based on the reported values. Because the original articles did not report all the nutritional values, the complete AA profiles could not be verified for all experiments. Some experiments have therefore been used in Susenbeth's (Reference Susenbeth2006) study even if the Trp requirement could not be expressed as a ratio to Lys (e.g. Han et al., Reference Han, Chung and Baker1993; Susenbeth and Lucanus, Reference Susenbeth and Lucanus2005). The criterion used by the author to eliminate experiments was a Lys content greater than 7.0 g Lys/100 g CP because some AAs might have been limiting for animal performance. However, even at lower levels, AAs other than Lys and Trp may have been limiting. For example, in Sato et al. (Reference Sato, Kobayashi, Jones and Easter1987 – Experiment 1), the Lys : CP ratio was 5.3% and yet Thr, Phe and His may have been limiting: the levels of 60% SID Thr : Lys, 47% SID Phe : Lys and 27% SID His : Lys are all below the requirements recommended by Whittemore et al. (Reference Whittemore, Hazzledine and Close2003). Because of the inclusion of experiments where AAs other than Lys could be second-limiting, the Trp : Lys ratio may be underestimated in the study of Susenbeth (Reference Susenbeth2006). Among the 33 experiments used in Susenbeth's study, 13 were eliminated in our meta-analysis because one or more AAs were considered limiting before Trp and Lys, or Lys was not considered limiting (four experiments), and 11 experiments were not considered in our study because they concern growing pigs with a BW greater than 25 kg. Because of this elimination, only six experiments were used in both Susenbeth's study (Reference Susenbeth2006) and our study.
The SID Trp : Lys requirement in piglets
The recommendations for the SID Trp : Lys requirements for piglets are quite variable and range from 18% (NRC, 1998) to 20–22% (Fundación Española para el Desarrollo de la Nutrición Animal, FEDNA, 2006 in Spain; Danish Pig Production, 2010 in Denmark). The results of our study (Table 2) confirm that a wide range of estimates can be obtained.
The response criterion used can be one of the factors explaining the variability in Trp : Lys requirement. For models CLP and ASY, requirement estimates were greater for ADG and ADFI than for G : F, which is in agreement with the results reported by Baker et al. (Reference Baker, Allen, Boomgaardt, Graber and Norton1971) and Han et al. (Reference Han, Chung and Baker1993). The observation that ADFI is affected by the Trp supply (partly) explains the effect on ADG. When given the choice between a Trp-deficient diet and a diet with higher dietary Trp content, piglets are able to choose the diet with the highest Trp content (Ettle and Roth, Reference Ettle and Roth2004). This preference can be explained by an aversion for the imbalanced diet. The anorexic effect of imbalanced diets has been described by Harper and Rogers (Reference Harper and Rogers1965) and they hypothesized that an excess of, or imbalance between AAs results in a depression of feed intake to counteract the dietary imbalance. The specific effect of Trp on appetite regulation could be mediated through the regulation of the central production of serotonin. Tryptophan is a precursor for serotonin in the brain, which is thought to influence feed intake and nutrient selection behaviour (Fernstrom, Reference Fernstrom1977 and Reference Fernstrom1985; Harper and Peters, Reference Harper and Peters1989). The negative effect of a Trp deficiency on feed intake can also be explained through a peripheral control of appetite (Eder et al., Reference Eder, Peganova and Kluge2001; Le Floc'h and Sève, Reference Le Floc'h and Sève2007). Bubenik et al. (Reference Bubenik, Pang, Hacker and Smith1996) suggested that the neurohormone melatonin, which is produced from Trp in the gastrointestinal tract, may serve as a signal for synchronizing the ingestion and digestion processes. The effect of Trp on feed intake may also be caused by its effect on gastric emptying (Sève, Reference Sève1999) or on ghrelin (Zhang et al., Reference Zhang, Jingdong, Defa, Xuan and Xilong2007). Ghrelin is a peptide hormone secreted by the stomach and the duodenum, and is involved in the regulation of feed intake and in the signalling between the digestive system and the brain (Inui et al., Reference Inui, Asakawa, Bowers, Mantovani, Laviano, Meguid and Fujimiya2004; Salfen et al., Reference Salfen, Carroll, Keisler and Strauch2004).
The effect of Trp on feed intake and thus on ADG could explain the slightly lower requirement estimate for G : F. Moreover, a large reduction in ADFI increases the relative contribution of maintenance and will result in a lower G : F. In contrast, a small reduction in ADFI often results in slightly leaner animals, thereby increasing the G : F. The combination of these two phenomena may explain why we observed a response of G : F to the Trp supply (i.e. due to the increase in G : F for a small reduction in ADFI) and that the requirement estimate for G : F was lower than for ADFI and ADG (i.e. due to the greater contribution of maintenance).
Diets typically used in North America are based on corn, whereas diets used in Europe are mostly based on a mix of cereals. In our analysis, the SID Trp : Lys requirement estimate was not affected by the source of cereals, and this result agrees with experimental results reported by Jansman et al. (Reference Jansman, van Diepen and Melchior2010) and Naatjes et al. (Reference Naatjes, Htoo, Tölle and Susenbeth2010). Estimates of the SID Trp : Lys requirement were slightly higher when only peer-reviewed publications were used. The reason for this difference is not known; however, it underlines the fact that there is a potential bias depending on the source of data used.
Modelling the piglet response to determine a nutrient requirement
Our results indicate that the choice of the statistical model has an important impact on the Trp requirement estimate and this observation is in line with those of Baker (Reference Baker1986), Shearer (Reference Shearer2000) and Barea et al. (Reference Barea, Brossard, Le Floc'h, Primot, Melchior and van Milgen2009). Requirement estimates should therefore be reported together with the method of estimation. All three tested models have the same number of parameters, and the potential to distinguish between models on statistical grounds is limited. However, the models differ in the way they should be interpreted.
The adequacy of the LP model is not always supported by experimental results (Baker, Reference Baker1986; Pomar et al., Reference Pomar, Kyriazakis, Emmans and Knap2003). The comparison between the estimated response-curves and external data (Figure 4) shows that the CLP model is the best-adapted model to depict these data. This may be explained by the shape of the curves per se. The LP model assumes a constant marginal efficiency (slope) up to the requirement, to become zero thereafter. In model CLP, the marginal efficiency diminishes linearly with increasing Trp supply to reach zero when the requirement is reached (Pesti et al., Reference Pesti, Vedenov, Cason and Billard2009). It has been demonstrated that the variation between the animals contributes to the apparent decrease in nutrient efficiency at higher nutrient levels (Curnow, Reference Curnow1973; Hauschild et al., Reference Hauschild, Pomar and Lovatto2010).
In experimental studies, requirements are often estimated for an average pig. If a diet is formulated based on this ‘average requirement’, the requirement of only half of the population will be met and the realized performance will then be lower than expected (Brossard et al., Reference Brossard, Dourmad, Rivest and van Milgen2009). This implies that the requirement of a population is higher than the ‘average requirement’ to allow each individual in the population to reach their potential performance. To adequately feed all the animals in the population, the requirement has therefore to be estimated for the whole population, meaning that the models that are designed to simulate population responses need to represent the population itself and not an individual animal even if it is representative for the population (Wellock et al., Reference Wellock, Emmans and Kyriazakis2004; Hauschild et al., Reference Hauschild, Pomar and Lovatto2010). If the response of an individual animal is described by model LP, the response of the population will be described by a curvilinear response (Morris, Reference Morris1983; Leclercq and Beaumont, Reference Leclercq and Beaumont2000) and the curvilinearity can be explained by variation in nutrient requirements between animals in the population (Pomar et al., Reference Pomar, Kyriazakis, Emmans and Knap2003). To adequately predict the response of a population in a given environment, it is therefore necessary to take account of between-animal variation (Fisher et al., Reference Fisher, Morris and Jennings1973; Wellock et al., Reference Wellock, Emmans and Kyriazakis2004); model CLP is thus considered more suitable than the other models to represent the response of a population of animals (Curnow, Reference Curnow1973; Hauschild et al., Reference Hauschild, Pomar and Lovatto2010).
The choice of the statistical model used to interpret dose–response experiments is also important in feed formulation. Models LP and CLP differ in the way they take into account the response of an animal (or a population of animals) to a variation in the Trp supply. A reduction of 5% in the achievement of the targeted Trp content will lead to a decrease in the expected performance of 5.4% according to the LP model and of 0.3% according to the CLP model. The requirement estimate of the CLP model therefore includes a safety margin. The response curve of model CLP can also be used to evaluate the risk of decreased performance relative to the price that has to be paid for the increase in Trp content. However, the estimated SID Trp : Lys requirement does not imply an economic optimization, and the economically most optimal solution may vary from one environment to another.
Conclusion
Between experimental studies, there is considerable variation in the reported SID Trp : Lys requirement ratio. The statistical model used to analyse the data appeared to have an important impact on the Trp : Lys requirement estimate. Using the same dataset, model LP estimated the SID Trp : Lys requirement at 17%, whereas model CLP estimated it at 22%. The main difference between these models is the way they represent the response of the animal (or the response of a population of animals) to an increasing Trp supply. With model CLP, increasing the SID Trp : Lys content from 17% to 22% resulted in an increase in ADG by 8%. Reporting nutrient requirements by itself has little value if the model with which these have been estimated is not reported as well.
Supplementary material
The supplementary material referred to in this article is available online at http://www.journals.cambridge.org/anm