1 Introduction
As venerable methods of protecting individual identities in research data have been shown to fail—including de-identification, restricted views, clean rooms, and others (see Dwork and Roth Reference Dwork and Roth2014; Sweeney Reference Sweeney1997)—differential privacy has emerged as a popular replacement and is now supported by a burgeoning literature (Dwork et al. Reference Dwork, McSherry, Nissim and Smith2006). It offers a rigorous mathematical quantification of privacy loss and mechanisms to satisfy it. One class of differentially private algorithms adds specially calibrated random noise to a dataset, which is released to the public or researchers. The noise is calibrated so reliably identifying any research subject is mathematically impossible, but learning insights about aggregate patterns (where enough of the noise effectively cancels out) is still possible.
Differential privacy, which seems to satisfy regulators, has the potential to give social scientists access to more data from industry and government than ever before, and in much safer ways for individuals who may be represented in the data (King and Persily Reference King and Persily2020). However, from a statistical perspective, adding random noise is equivalent to intentionally creating data with measurement error which can induce statistical bias in any direction or magnitude (depending on the data and quantities of interest). This conclusion may be obvious to social scientists and statisticians, but it is usually not discussed in the computer science literature where differentially private algorithms are developed.
Put differently, a central goal of social science is inference to unobserved populations from which the (private) data are selected or processes from which the observed data were generated. Yet, in this part of the computer science literature, the goal instead is to infer to the (private) database, so that if without added noise, we could merely calculate a desired quantity directly from the data, with no need to correct for the measurement error and produce estimators with known statistical properties (like consistency, unbiasedness, etc.) or accurate uncertainty intervals. As a result, the measures of “utility” being optimized in this literature often provide little utility for social science analysts.
We thus adapt methods to our application from the vast statistical literature seeking to correct for naturally occurring measurement error. Much of the complication in that literature stems from its goal of estimating quantities of interest from data generation processes with unknown noise processes, unverifiable assumptions, and unavoidably high levels of model dependence. In contrast, a principle of differential privacy is that the noise process is always known exactly and made public (reflecting the view in the cryptography literature that trying to achieve “security by obscurity” does not work), which enables us to simplify features of these methods and apply them with fewer assumptions and more confidence.
We use as a running example the “URLs dataset” that Facebook and Social Science One (SocialScience.one) recently released, containing more than 40 trillion cell values (Messing et al. Reference Messing, DeGregorio, Hillenbrand, King, Mahanti, Muk-erjee, Nayak, Persily, State and Wilkins2020). This is both one of the largest social science research datasets in existence and perhaps the largest differentially private dataset available for scholarly research in any field. Over 100 social scientists in 17 teams from 10 countries have been given access to this dataset so far, with more in the approval process. These researchers are studying social media’s effect on elections and democracy in many countries, including online disinformation, polarization, echo chambers, false news, political advertising, and the relationship between social media and the traditional news media.
The methods we introduce are designed for the specific error process in the URLs dataset and others like it (such as the Google COVID-19 Community Mobility Reports; Aktay et al. Reference Aktay2020). Although the URLs dataset includes one of the most commonly discussed noise processes in the computer science literature, modifications to our methods are required for other types of differentially private datasets, such as for the differentially private tables the U.S. Census is planning to release (Garfinkel, Abowd, and Powazek Reference Garfinkel, Abowd and Powazek2018).
In this paper, we offer a method of analyzing this type of differentially private data release with point estimates and standard errors that are statistically consistent, approximately unbiased, and computationally feasible even for exceptionally large datasets. This method estimates the same quantities that could have been estimated with ordinary linear regression if researchers had access to the confidential data (i.e., without noise). Although standard errors from our approach are larger than in the absence of noise, they will be correct (and, of course, vastly smaller than the only feasible alternative, which is no data access at all). Researchers using this approach need little expertise beyond knowing how to run a linear regression on nonconfidential data.
We describe the concept of differential privacy and the URLs dataset in Section 2; our regression estimator in Section 3; and several practical extensions in Section 4, including variable transformations and how to understand information loss due to the privacy preserving procedures by equating it to the familiar uncertainties in sample surveys. Then, in Section 5, we show how to compute descriptive statistics and regression diagnostics from differentially private data. We would like to do actual analyses of confidential data and then compare the results to analyses with our methods of differentially private data, but this would violate the privacy of those represented in the data and so is not possible. However, the noise processes here are completely known and so we are in the unusual situation of knowing all the features of the noise process needed to develop useful methods without further assumptions.Footnote 1
We provide open source software for implementing all our methods available now; Facebook has also produced a highly engineered version of our software that works for very large datasets. The methods offered here will also be included in general open source differential privacy software being developed in a collaboration between Microsoft and Harvard University.
2 Differential Privacy and the Facebook URLs Dataset
Instead of trying to summarize the extensive and fast growing differential privacy literature, we provide intuition by simplifying as much as possible, and afterwards add complications only when necessary to analyze the URLs Dataset. Our goal here is to provide only enough information about differential privacy so researchers can analyze data protected by it. For more extensive introductions to differential privacy, see Dwork and Roth (Reference Dwork and Roth2014) and Vadhan (Reference Vadhan2017) from a computer science perspective and Evans et al. (Reference Evans, King, Schwenzfeier and Thakurta2020) and Oberski and Kreuter (Reference Oberski and Kreuter2020) from a social science perspective. Dwork et al. (Reference Dwork, McSherry, Nissim and Smith2006) first defined differential privacy by generalizing the social science technique of “randomized response” used to elicit sensitive information in surveys (e.g., Blair, Imai, and Zhou Reference Blair, Imai and Zhou2015; Glynn Reference Glynn2013).
Let D be a confidential dataset, and
 $M(D)$
—a function of the data—be a randomized mechanism for producing a “differentially private statistic” from D, such as a simple cell value, the entire dataset, or a statistical estimator. Including random noise as part of
 $M(D)$
is what makes its output privacy protective. A simple example adds mean zero independent Gaussian noise,
 $\mathcal {N}(0,S^2)$
, to each cell value in D, with
 $S^2$
defined by a careful analysis of the precise effect on D of the inclusion or exclusion any one individual (possibly varying within the dataset).
Consider now two datasets D and
 $D'$
that differ by, at most, one research subject. (For a standard rectangular dataset with independent observations like a survey, D and
 $D'$
differ by at most one row.) The principle of differential privacy is to choose S so that
 $M(D)$
is indistinguishable from
 $M(D')$
, where “indistinguishable” has a precise mathematical definition. The simplest version of this definition (assuming a discrete sample space) defines mechanism M as
 $\epsilon $
-differentially private if
 $$ \begin{align} \frac{\Pr[M(D)=m]}{\Pr[M(D')=m]} \leq e^\epsilon \end{align} $$
for any value m (in the range of
 $M(D)$
) and any datasets D and
 $D'$
that differ by no more than one research subject, where
 $\epsilon $
is a policy choice made by the data provider that quantifies the maximum level of privacy leakage allowed with smaller values potentially giving away less privacy. Equation 1 can be written more intuitively as
 $\Pr [M(D)=m]/\Pr [M(D')=m]\in 1\pm \epsilon $
(because
 $e^\epsilon \approx 1+\epsilon $
for small
 $\epsilon $
). The probabilities in this expression treat the datasets as treated as fixed with uncertainty coming solely from the randomized mechanism (e.g., the Gaussian distribution). The bound provides only a worst case scenario, in that the average or likely level of privacy leakage is considerably less than
 $\epsilon $
, often by orders of magnitude (Jayaraman and Evans Reference Jayaraman and Evans2019).
A slightly relaxed definition, used in the URLs dataset, is known as (
 $\epsilon ,\delta $
)-differential privacy (or “approximate differential privacy”). This definition adds a small offset
 $\delta $
to the numerator of Equation 1 (a special case of which, with
 $\delta =0$
, is
 $\epsilon $
-differential privacy), thus requiring that one of the probabilities be bounded by a linear function of the other:
 $$ \begin{align} \Pr[M(D)=m]\quad\leq\quad\delta + e^\epsilon\cdot\Pr[M(D')=m]. \end{align} $$
The URLs dataset was constructed with
 $\delta =0.00005$
and
 $\epsilon $
varying by variable. The noise S is then defined, also separately for each variable, to optimize the privacy-utility trade off by computing a deterministic function of these parameters (as described in Bun and Steinke Reference Bun and Steinke2016).
To be specific, we focus on the “breakdown table” in the URLs dataset, which is a rectangular dataset containing about 634 billion rows and 14 confidential variables (the table also contains a range of nonconfidential variables). All the confidential variables in this dataset are counts, to which mean-zero independent Gaussian noise is added before researchers are allowed access. (The privatized variables are thus no longer restricted to be nonnegative integers.)
To provide some context, we describe the construction of the raw, confidential data and then explain how noise was added. In this dataset, each row represents one cell of a large cross-classification (after removing rows with structural zeros) of 38 million URLs (shared publicly more than about 100 times worldwide), by 38 countries, by 31 year-months, by 7 age groups, by 3 gender groups, and (for the United States) by a 5 category political page-affinity variable. Then, for each of these rows representing a type of user, the confidential variables are counts of the number of users who take a particular action with respect to the URL, with actions (and the standard deviation of the noise S for the corresponding variable) including view (
 $S=2228$
), click (
 $S=40$
), share (
 $S=14$
), like (
 $S=22$
), and share_without_click, comment, angry, haha, love, sad, wow, marked_as_false_news, marked_as_hate_speech, marked_as_spam, marked_as_spam (each with
 $S=10$
). User-actions are counted only once for any one variable in a row, and so a user who “clicks” on the same URL multiple times adds only 1 to the total count in that row. The specific values of S for each variable are computed based on how many different types of actions each user takes on average in the data. Different levels of noise were added to different variables because, in this dataset, each user may be represented in the data in multiple rows (by clicking on multiple URLs) and because users tend to take some actions (like “views,” which are merely items that pass by on a user’s Facebook news feed) more than others (like actively clicking “angry”). Detailed privacy justification for how S was determined for each column appear in Messing et al. (Reference Messing, DeGregorio, Hillenbrand, King, Mahanti, Muk-erjee, Nayak, Persily, State and Wilkins2020); for statistical purposes, however, the values of S for each variable is all we need to know to build the bias corrections below, and to analyze the data.
Differential privacy has many important properties, but two are especially relevant here: First, the
 $\epsilon $
and
 $\delta $
values used for different cell values in a dataset compose in that if one cell value is protected by
 $\epsilon _1,\delta _1$
and a second cell is protected by
 $\epsilon _2,\delta _2$
, the two cell values together are
 $(\epsilon _1+\epsilon _2, \delta _1+\delta _2)$
-differentially private (with the same logic extending to any number of cells). This enables data providers to decide how much privacy they are willing to expend on the entire dataset, to parcel it out, and to rigorously enforce it.
Second, the properties of differential privacy are retained under post-processing, meaning that once differentially private data is created, any analyses of any type or number may be conducted without further potential privacy loss. In particular, for any statistic
 $s(\cdot )$
that does not use confidential information, if dataset
 $M(D)$
is (
 $\epsilon ,\delta $
)-differentially private, then
 $s(M(D))$
is also (
 $\epsilon ,\delta $
)-differentially private, regardless of
 $s(\cdot )$
, potential adversaries, threat models, or external information. This enables us to develop statistical procedures to correct bias without risk of degrading privacy guarantees.
3 Linear Regression Analysis
We now provide a tool intended to provide estimates from a linear regression analysis on the confidential data. We present an overview in the form of intuition and notation (Section 3.1, point (Section 3.2) and variance (Section 3.3) estimation, Monte Carlo Evidence (Section 3.4), and a reanalysis of real data from a published article (Section 3.5).
3.1 Intuition and Notation
Suppose, we obtain access to the codebook for a large dataset but not the dataset itself. The codebook completely documents the dataset without revealing any of the raw data. To decide whether it is worth trying to obtain full access, we plan a data analysis strategy. For simplicity and computational feasibility for very large collections like the URLs dataset, we decide to approximate whatever the optimal strategy is with a linear regression. Even if the true functional form is not linear, this would still give the best linear approximation to the true form (Goldberger Reference Goldberger1991). (We know that more sophisticated statistical methods applied to nonconfidential data can be superior to linear regression, but it is an open question as to whether estimates from those models, suitably corrected for noise in the context of differential privacy, would give substantively different answers to social science research questions or whether the extra uncertainty induced by the noise would make the differences undetectable.)
To formalize, let y be an
 $n\times 1$
vector generated as
 $y=Z\beta +\epsilon $
, where Z is an
 $n\times K$
matrix of explanatory variables,
 $\beta $
is a vector of K coefficients, and
 $\epsilon $
(reusing the same Greek letter as in Section 2 for this alternative purpose) is a
 $n\times 1$
vector distributed with mean vector 0 and variance matrix
 $\sigma ^2I$
; the error term
 $\epsilon $
can be normal but need not be. The goal is to estimate
 $\beta $
and
 $\sigma ^2$
along with standard errors.
If we obtained access to y and Z, estimation would be easy: we merely run a linear regression. However, suppose the dataset is confidential and the data provider gives us access to y but not Z, which we are permitted to see only through a differentially private mechanism. (The dependent variable will also typically be obscured by a similar random observation mechanism, but it creates only minor statistical problems and so we assume y is observed until Section 4.1.) This mechanism enables us to observe
 $X=M(Z)=Z+\nu $
, where
 $\nu $
is unobserved independent random Gausssian noise
 $\nu \sim \mathcal {N}(0,S^2)$
. The error term
 $\nu $
has the same
 $n\times K$
dimensions as X and Z so that the variance matrix
 $S^2\equiv E(\nu '\nu /n)$
that generates it can have any structure chosen by the data provider. For the URLs data,
 $S^2$
is diagonal, to apply different noise to each variable depending on its sensitivity, although in many applications it is equal to
 $s^2I$
for scalar
 $s^2$
, meaning that the same level of independent noise is applied to every dataset cell value. (With more general notation than we give here,
 $S^2$
could also be chosen so that different noise levels are applied to different data subsets.)
In statistics, this random mechanism is known as “classical measurement error” (Blackwell, Honaker, and King Reference Blackwell, Honaker and King2017; Stefanski Reference Stefanski2000). With a single explanatory variable, classical measurement error is well known to bias the least squares coefficient toward zero. With more than one explanatory variable, and one or more with error, bias can be in any direction, including sign switches. For intuition, suppose the true model is
 $y=\beta _0+\beta _1Z_1+ \beta _2Z_2+\epsilon $
and
 $\beta _1>0$
. Suppose also
 $Z_2$
is a necessary control, meaning that failing to control for it yields a negative least squares estimate of
 $\beta _1$
. Now suppose,
 $Z_2$
is not observed and so instead we attempt to estimate the same model by regressing y on
 $Z_1$
and
 $X_2=Z_2+\nu $
. If the noise added is large enough,
 $X_2$
will be an ineffective control and so the least squares estimate of
 $\beta _1$
will be biased and negative rather than positive.
The goal of this paper is to use the differentially private data to estimate the same linear regression as we would if we had access to the confidential data: to produce consistent and unbiased estimates of
 $\beta $
,
 $\sigma ^2$
, and the standard errors. Our methods are designed so that researchers can interpret results in the same way as if they had estimates from a regression of y on Z. The only difference is that we will have larger standard errors by observing X rather than Z. In fact, as we show in Section 4.3, our results are equivalent to analyzing a random sample of the confidential data (of a size we estimate) rather than all of it.
Although the methods we introduce can also be used to correct for measurement error occurring naturally, we have the great advantage here of knowing the noise mechanism
 $M(\cdot )$
exactly rather than having to justify assumptions about it.
3.2 Point Estimation
The linear regression model has two unknown parameters, the effect parameters
 $\beta $
and the standard error of the regression,
 $\sigma ^2$
. We now introduce consistent estimators of each in turn. For expository purposes, we do this in three stages for each: a consistent but infeasible estimator, an inconsistent but feasible estimator, and a consistent and feasible estimator. We show in Section 3.4 that for finite samples each of the consistent and feasible estimators is also approximately unbiased.
3.2.1 Estimating
 $\beta $

We begin with estimators for
 $\beta $
. First is the consistent but infeasible estimator, which is based on a regression of y on Z (which is infeasible because Z is unobserved). The coefficient vector is
 $$ \begin{align} \hat\beta = (Z'Z)^{-1}Z'y = (Z'Z)^{-1}Z'(Z\beta+\epsilon) = \beta +(Z'Z)^{-1}Z'\epsilon. \end{align} $$
Letting
 $\Omega \equiv \mathrm{plim}(Z'Z/n)$
(the probability limit) and noting that
 $\mathrm{plim}(Z'\epsilon /n)=0$
, it is easy to show that this estimator is statistically consistent:
 $\mathrm{plim}(\hat \beta )=\beta +\Omega ^{-1}0=\beta $
.
Second is our inconsistent but feasible estimator, based on a regression of y on X. Letting
 $Q=X'X$
, we define this estimator as
 $$ \begin{align} b = Q^{-1}X'y = Q^{-1}X'Z\beta + Q^{-1}X'\epsilon. \end{align} $$
Because
 $Q = Z'Z+\nu '\nu + Z'\nu + \nu 'Z$
and
 $X'Z = Z'Z+\nu 'Z$
, we have
 $\mathrm{plim}(Q/n)=\Omega +S^2$
and
 $\mathrm{plim}(X'Z/n)=\mathrm{plim}(Z'Z/n)=\Omega $
. Then we write
 $\mathrm{plim}(b) = (\Omega +S^2)^{-1}\Omega \beta = C\beta $
where
 $$ \begin{align} C=(\Omega+S^2)^{-1}\Omega. \end{align} $$
As long as there is some measurement error (i.e.,
 $S^2\ne 0$
),
 $C\ne I$
, and so b is statistically inconsistent:
 $\mathrm{plim}(b)\ne \beta $
. This expression also shows why the inconsistency leads to attenuation with one covariate (since S is a scalar), but may result in any other type of bias with more covariates.
Finally, we give a statistically consistent and feasible estimator (see Warren, White, and Fuller Reference Warren, White and Fuller1974). To begin, eliminate the effect of the noise by defining
 $\hat \Omega =Q/n-S^2$
, which leads to the estimator
 $\hat C^{-1}=\hat \Omega ^{-1}(\hat \Omega +S^2)=[(Q/n)-S^2]^{-1}(Q/n)$
. Then we can write our estimator as:
 $$ \begin{align} \tilde\beta = \hat{C}^{-1}b = \left(\frac{X'X}{n} - S^2\right)^{-1}\frac{X'y}{n}, \end{align} $$
which is statistically consistent:
 $\mathrm{plim}(\tilde \beta ) = \beta $
.
3.2.2 Estimating
$\sigma ^2$

Next, we follow the same strategy in developing estimators for
 $\sigma ^2$
. First, the consistent but infeasible estimator is
 $V(y-Z\beta )$
. Second, we construct the inconsistent but feasible estimator by first using the observed X in place of Z:
 $$ \begin{align*} V(y-X\beta) &= V[y-(Z+\nu)\beta]\\ &= V(y-Z\beta) + \beta' S^2\beta\\ &= \sigma^2 +\beta' S^2\beta. \end{align*} $$
And so even if we observed
 $\beta $
, the usual estimator of
 $\sigma ^2$
would be inconsistent. Finally, our consistent and feasible estimator uses a simple correction
 $$ \begin{align} \hat\sigma^2 = \frac{1}{n}(y-X\tilde\beta)'(y-X\tilde\beta) - \tilde\beta' S^2\tilde\beta, \end{align} $$
which is statistically consistent:
 $\mathrm{plim}(\hat \sigma ^2)=\sigma ^2$
.
3.3 Variance Estimation
Our goal in this section is to develop a computationally efficient variance estimator for
 $\tilde \beta $
that works even for exceptionally large datasets. This is especially valuable because the computational speed of bootstrapping and direct analytical approaches (Buonaccorsi Reference Buonaccorsi2010) degrade fast as n increases (see Section 3.4). We develop an approach so that, after computing the point estimates, most of the computational complexity is not a function of the dataset size.
We estimate the variance using extensions of standard simulation methods (King, Tomz, and Wittenberg Reference King, Tomz and Wittenberg2000). To do this, note that
 $\tilde \beta $
in Equation 6 is a function of two sets of random variables,
 $X'X$
and
 $X'y$
. Because we cannot reasonably make the independence assumptions required for Wishart-related distributions, we take advantage of the central limit theorem (and extensive finite sample tests) and approximate the
 $[K(K+1)/2+K]\times 1$
vector
 $T=\text {vec}(X'X,X'y)$
by simulating from a multivariate normal,
 $\tilde T\sim \mathcal {N}\left (T,\hat {V}(T)\right )$
, with means computed from the observed value of T and covariance matrix:

Appendix A derives the three types of covariances,
 $\text {Cov}(X_k'X_j, X_{\ell }'X_m)$
,
 $\text {Cov}(X_k'y, X_j'y)$
, and
 $\text {Cov}(X_k'y, X_j'X_m)$
, and gives consistent estimators for each. Then we simply draw many values of T from this distribution, substitute each in to Equation 6 to yield simulations of the vector
 $\tilde \beta $
, and finally compute the sample variance matrix over these vectors.
3.4 Monte Carlo Evaluation
Thus far, we have shown that our estimator and standard errors are statistically consistent, which is a useful statistical property for analyzing the huge URLs dataset. We now go further and illustrate some of its finite sample properties via Monte Carlo simulations. Let
 $Z_1\sim \text {Poisson}(7)$
, and (to induce a correlation)
 $Z_2=\text {Poisson}(9)+2Z_1$
. Then for each of 500 simulations, draw
 $y=10+12Z_1-3Z_2+\epsilon $
, where
 $\epsilon \sim \mathcal {N}(0,2^2)$
. This means that the outcome variable is conditionally normal without differentially private noise added. We also add a different noise variance for each covariate, with
 $S_2$
(the standard deviation of the noise for the second variable) fixed at 1 for all simulations. We have studied many data generation processes for these simulations, including nonlinearities, error structures, variance matrices, and distributions, all with similar results. Parameter values we used are given in the results we now present. Our figures reflect typical analyses of large datasets, such as the Facebook URLs data, using
 $n=100,000$
. Because the point of differential privacy is to hide the contribution of any one research subject, very small datasets require enough noise, for a given privacy parameter, to prevent a researcher from making valid inferences about any individual who may be in the data. We find that our estimator is approximately unbiased in sample sizes down to about
 $n=2,000$
with moderate noise and smaller with less noise, the results for which we also discuss.
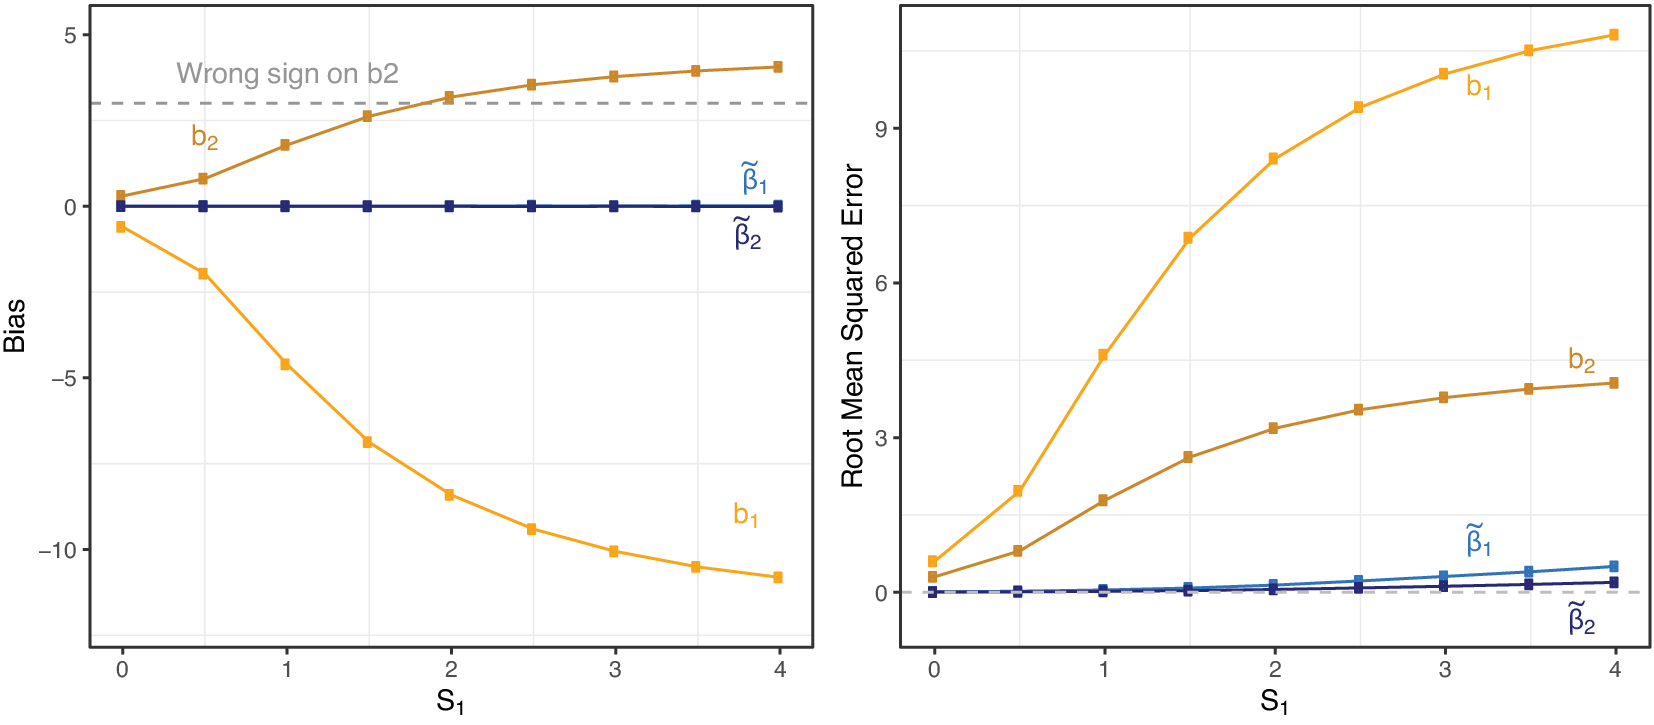
In Figure 1, we give results for point estimates averaged over our 500 simulations. In the left panel, we plot statistical bias vertically by
 $S_1$
(the standard deviation of the differentially private noise added to the first variable) horizontally. The least squares slope coefficients (
 $b_1$
and
 $b_2$
in orange) indicate little bias when
 $S_1=0$
(at the left) and fast increasing bias as the noise increases. (In addition to bias,
 $b_2$
has the wrong sign when
 $S_1>2$
.) In contrast, our alternative estimator for both coefficients (
 $\tilde \beta _1$
and
 $\tilde \beta _2$
in different shades of blue) is always unbiased, which can be seen by the horizontal lines plotted in blue at about zero bias for all levels of
 $S_1$
. This estimator even remains unbiased for all levels of error, even when the measurement error in X has more than twice the variance as the systematic variation due to the true
 $Z_1$
.
Point Estimates, evaluated with respect to statistical bias (left panel) and root mean square standard error (right panel). In both panels, results for least square coefficients are in orange and for our estimators are in shades of blue.

The right panel of Figure 1 plots vertically the root mean square error over the 500 simulations, by
 $S_1$
horizontally. With no noise at the left side of the plot, both estimators and coefficients are about the same (they are not zero because
 $S_2=1$
for the entire simulation). As the noise increases (and we move horizontally), the root mean square error increases dramatically for both least squares coefficients (in orange) but stays much lower for both of the estimators from our proposed approach (in blue).
To illustrate performance in smaller samples, we reran the analyses in the left panel of Figure 1 with
 $n=2,000$
and
 $S_1$
between 0 and 2 in increments of 0.5. The average bias in these runs is 0.0095 for
 $\tilde \beta _1$
and 0.0118 for
 $\tilde \beta _2$
. With many fewer observations or smaller values of the privacy parameter
 $\epsilon $
, differential privacy obscures too much of the remaining signal to be useful, leaving open the possibility of bias or unacceptably large standard errors. This is of course by the design of differential privacy because with smaller numbers of observations obscuring the presence or absence of a large outlier requires substantially more noise.
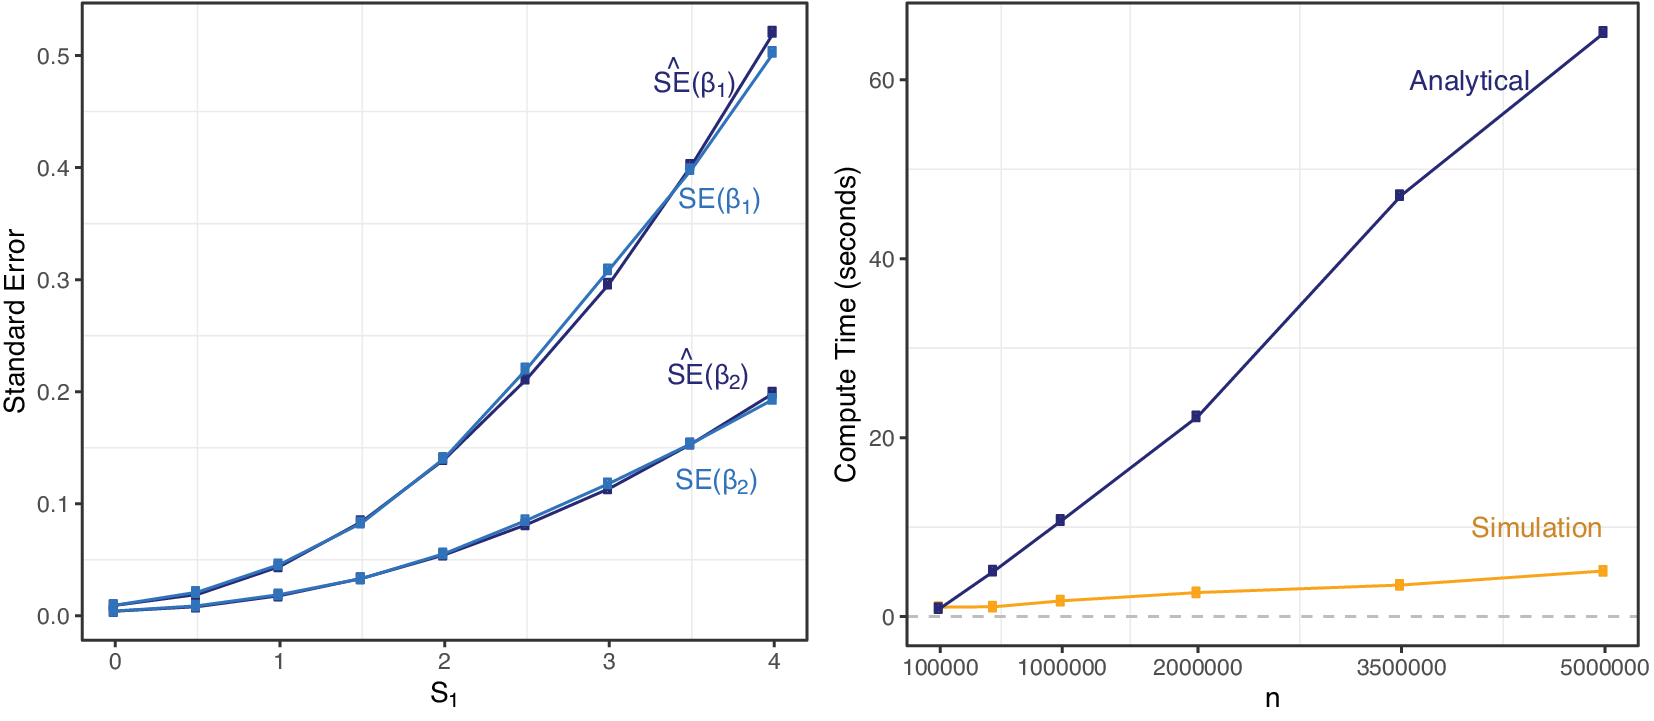
We also study the properties of the standard errors of our estimator in Figure 2. The left panel plots the true standard deviation vertically in light blue for each coefficient and the standard error in dark blue. For each coefficient, our standard error (averaged over the 500 simulations) is approximately equal to the true standard deviation for all values of
 $S_1$
.
Standard Errors, evaluated in terms of bias (left panel) and time to completion (right panel). In both panels, results for least square coefficients are in orange and for our estimators are in shades of blue.

Finally, in the right panel of Figure 2, we summarize the compute time of our estimator (labeled “simulation”) compared to an available analytical approach (Buonaccorsi Reference Buonaccorsi2010, p.117), with time to completion vertically and n horizontally. Obviously, our approach is much more computationally efficient. Between
 $n=100,000$
and
 $n=5,000,000$
, the two end points of the sample sizes we studied, time to completion increased by a factor of 70 for the analytical solution but only 4.85 for our approach. For applications we designed this method for, with much larger sample sizes, the analytical approach is infeasible and these dramatic speed increases may be especially valuable.
3.5 Empirical Evaluations
We now conduct two empirical evaluations: First, we use Facebook URLs data to evaluate the impact of our corrections and how badly we would be mislead without them. Second, we use a publicly available dataset and treat it as if it were private but we happen to have access, thus enabling us to compare our estimates to that from an analysis of the true “private” data.
3.5.1 Facebook URLs Data
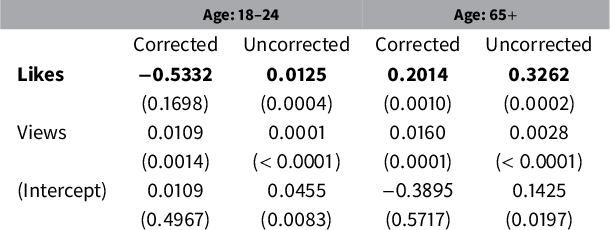
For this illustration of our methodology, we study age differences in “sharing” behavior of ideologically conservative Facebook users for URLs that are “liked” more often (controlling how often they are viewed).Footnote 2 We thus specify a regression of the number of times a user “shares” a URL with their friends as a function of the number of users who indicate that they “like” it, conditional on the number who have viewed it. We estimate this regression model for the young (18–24 year olds) and the elderly (those over 65) on 1.37 million URLs as observations.
Uncorrected versus corrected regression estimates in Facebook URLs data. Bold entries are discussed in the text. (Estimates computed by the authors.)

Figure 1 gives our results with key estimates in bold. We find overall that, in aggregate, the young tend to share articles they disagree with, whereas the elderly tend to share articles they agree with—but this result would be missed entirely without our approximately unbiased estimator. Our estimator (in columns marked “Corrected”) reveals that a URL with a thousand more likes is shared 533 fewer times for the young but 201 more times for the elderly (both with small standard errors). However, estimates for the (standard biased ordinary least squares) regression estimator (in columns marked “Uncorrected”) miss this pattern completely, as both coefficients are positive, with very small standard errors.
3.5.2 Private versus Privatized Data Analyses
We now illustrate our technology by comparing analyses on private data (from Hersh and Nall Reference Hersh and Nall2016) with that on noisy privatized data. We start with publicly available data, add differentially private noise, and then show the consequences of ignoring and then correcting for this noise, in comparison to the analysis on the private data. This dataset and all our code is available in the replication data file accompanying this article.
We first run a linear regression, across 2,575 state legislative election districts in 29 states, of the Republican proportion of those registered on the proportion of registered voters who are African American, controlling for median district income, and a binary indicator for the South. Our quantity of interest is the conditional effect of race on registration, under this specification. We run the analysis first in the private data and obtain an estimate of approximately
 $-0.3$
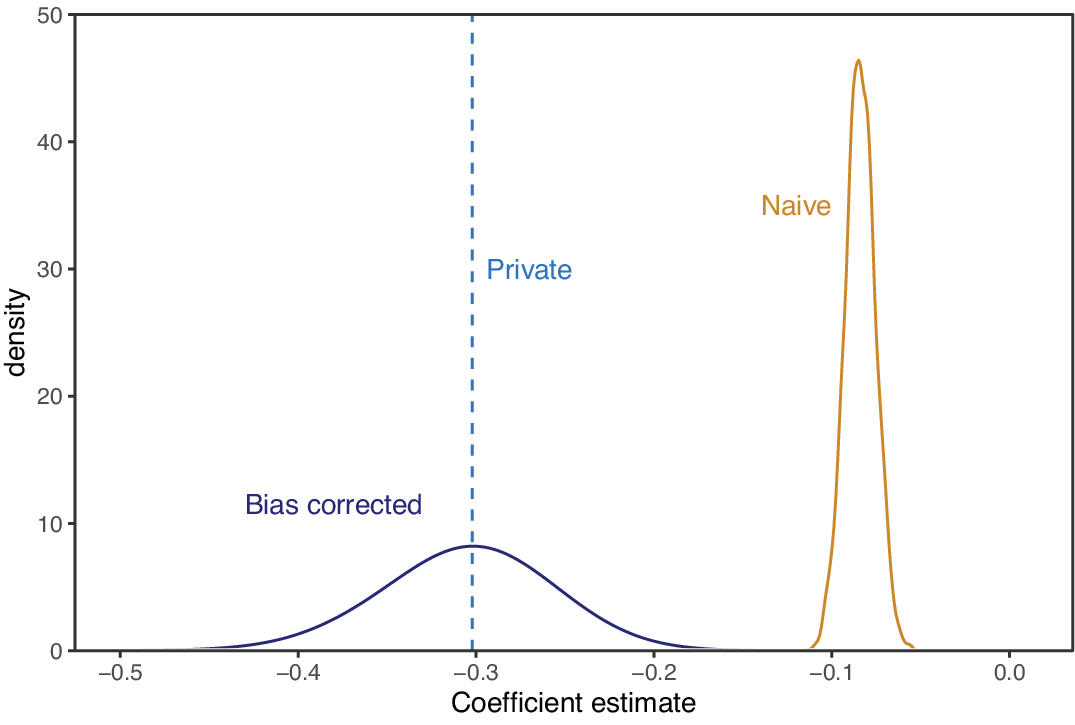
, meaning that a homogeneous African American district has 30 percentage points less Republican registration than a district without any African Americans, even after adjusting for income and region. This result is illustrated in Figure 3 with the vertical dashed blue line marked “Private.”
The consequences of correcting versus ignoring noise.

We then create 500 datasets by adding differentially privatizing noise to the percentage African Americans and the median income and, for each, rerun this regression both ignoring the noise and then correcting for it. We plot a histogram of the 500 runs ignoring the noise in Figure 3 (in orange marked “Naive”). This density is both far from the true private estimate and overconfident, the combination of which is especially dangerous of course: ignoring the noise would be a big mistake. We also plot a histogram of our bias corrected estimates (in blue marked “bias corrected”) which is centered around the true private estimate indicating that it is approximately unbiased; its variance reflects the uncertainty due to the added noise.
4 Extensions
We now extend our regression model to differentially private dependent variables and transformations of explanatory variables, and we show how to quantify the noise-induced information loss in easy-to-understand terms.
4.1 Differentially Private Dependent Variables
Until now, we have assumed that y is observed. However, suppose instead y is confidential and so we are only permitted to observe a differentially private version
 $w=M(y)=y+\eta $
, where
 $\eta \sim \mathcal {N}(0,S_y^2)$
and
 $S_y^2$
is the variance of the noise chosen by the data provider.
We are thus interested in the regression
 $w = Z\beta +\epsilon $
, where as in Equation 3.1
 $\epsilon $
has mean zero and variance
 $\sigma ^2$
. For this goal, our estimators for
 $\tilde \beta $
and its standard errors retain all their original properties and so no change is needed. The only difference is the estimator for
 $\sigma ^2$
. One possibility is to redefine this quantity as including all unknown error, which is
 $\epsilon -\nu $
. If, instead, we wish
 $\sigma ^2$
to retain its original definition, then we would simply use an adjusted estimator:
 $\tilde \sigma ^2 = \hat \sigma ^2-S_y^2$
.
These results also indicate that if we have a dependent variable with noise but no explanatory variables, or explanatory variables observed without error, using
 $\tilde \beta $
is unnecessary. A simple linear regression will remain unbiased. This also means that descriptive statistics involving averages, or other linear statistics like counts, of only the dependent variable require no adjustments. Finally, we note that the results in this section apply directly to problems with error in both explanatory and dependent variables.
4.2 Transformations
Privacy protective procedures also complicate the proper treatment of transformations. We consider two examples here. First, scholars often normalize variables by creating ratios, such as dividing counts by the total population. Unfortunately, the ratio of variables constructed by adding independent Gaussian noise to both the numerator and denominator has a very long tailed distribution with no finite moments. This means that the distribution can be unimodal, bimodal, symmetric, or asymmetric and will often have extreme outliers (Diaz-Frances and Rubio Reference Diaz-Frances and Rubio2013). In addition to the bias analyzed above, this distribution is obviously a nightmare for data analysis and should be avoided. In its place, we recommend merely adding what would be the denominator as an additional control variable, which under the approach here will return consistent and approximately unbiased estimates. See Evans and King (Reference Evans and King2021b) for methodological extensions to proportions and weighted averages.
Second, because interactions are inherently nonlinear in both the variables and the noise, different statistical procedures are needed to avoid bias. Consider two options. In one, we can condition on known variables that may be in the data, such as defined by subgroups or time periods. One way to do this properly is to compute
 $\tilde \beta $
within each subgroup in a separate regression. Then the set of these coefficients can be displayed graphically or modeled, using the methods described here, with
 $\tilde \beta $
as the dependent variable and one or more of the existing observed or differentially private variables on the right side. For example, with a dataset covering 200 countries, we can estimate a regression coefficient within each country, and then run a second regression using the methods described here (at the country level with
 $n=200$
) of
 $\tilde \beta $
, as the dependent variable, on other variables aggregated to the country level. (Aggregating private variables to the country level reduces implied S, which must be included when doing this second run.)
The other way to include interactions is by estimating the parameters of a regression like
 $y = \beta _0+\beta _1X_1+ \beta _2X_2 + \beta _3X_3 + \beta _4(X_1\cdot X_2)+\epsilon $
. To estimate this regression using differentially private data, and without bias, requires some adjustments to our strategy, which we develop in Appendix B and include in our software.
4.3 Quantifying Privacy Information Loss
To quantify the information loss due to differential privacy, we compare the increase in the standard error of the estimate of
 $\beta $
, in analyzing the original confidential dataset using b, to the differentially private dataset standard error we have using
 $\tilde \beta $
. We quantify this information loss following Evans et al. (Reference Evans, King, Schwenzfeier and Thakurta2020) by equating it the analysis of a random sample from the confidential data without noise. The size of this random sample compared to the full sample will be our estimate of the information lost.
Thus define
 $\mathbf {b}_n$
as the (least squares) estimator we would calculate if the data were released without differentially private noise, and
 $\tilde {\beta }_n$
as our estimator, where in both cases the subscript denotes the number of observations on which it is based. We then estimate the vector
 $n^*$
(where
 $n^* < n$
) such that
 $\text {diag}[V(\mathbf {b}_{n^*})] = \text {diag}[V(\tilde {\beta }_{n})]$
. Since most researchers are focused on one quantity of interest (at a time) consider, without loss of generality, just coefficient k. Then since
 $V(\mathbf {b}^k_{n^*}) \propto 1/n^*$
and
 $V(\tilde {\beta }^k_{n}) \propto 1/n$
we can write,
 $V(\mathbf {b}^k_{n^*}) = n V(\mathbf {b}^k_{n})/n^* = V(\tilde {\beta }^k_{n})$
. Hence, the proportion of observations lost to the privacy protective procedures is
 $$ \begin{align} L_k = \frac{n - n^*}{n} = 1 - \frac{V(\mathbf{b}^k_{n})}{V(\tilde{\beta}^k_{n})}. \end{align} $$
We can estimate L easily by estimating its components. Because
 $V(\mathbf {b}^k_{n}) = \sigma ^2(Z'Z)^{-1}$
, we estimate it as
 $\hat {V}(\mathbf {b}^k_{n}) = \hat {\sigma }^2\hat \Omega ^{-1}$
. We estimate
 $V(\tilde {\beta }^k_{n})$
with the procedures in Section 3.3.
5 Descriptive Statistics and Diagnostics
Best practices in data analysis normally involves careful balancing: trying not to be fooled either by oneself—due to “p-hacking” or inadvertently biasing analysis decisions in favor of our own pet hypothesis—or by the data—due to missing one of many well known threats to inference. Avoiding the former suggests tying one’s hands through preregistration or correcting for multiple comparison problems ex post, whereas avoiding the latter suggests running as many tests and diagnostics as possible. Remarkably, the noise in differentially private data analysis prevents us from fooling ourselves to a degree automatically, by making some types of overfitting impossible (Dwork et al. Reference Dwork, Feldman, Hardt, Pitassi, Reingold and Roth2015), and thus leaving the best practice for differentially private data analysis to mainly focus on avoiding being fooled by the data. This process is hindered, however, because confidential data are not accessible and directly studying the observed data (with noise) will likely lead to biased conclusions.
Our strategy, then, is to offer methods that enable researchers ways of finding clues about the private data through appropriate descriptive analyses of the available differentially private data. We introduce methods in stages, from simple to more complex, including unbiased estimates of the moments (Section 5.1), histograms (Section 5.2), and regression diagnostics (Section 5.3).
5.1 Moments
We show here how to estimate the sample moments of a confidential variable Z, treated as fixed, given only a differentially private variable
 $X=Z+\nu $
. This is important because, if S (the standard deviation of the noise) is large or the features of interest of X are relatively small, the empirical distribution of X may look very different from Z. We first offer an unbiased estimator of the raw moments and then translate them to the central moments.
Denote the rth raw moment by
 $\mu _r' \equiv E[X^r]$
, and the rth central moment by
 $\mu _r \equiv E[(X - E[X])^r]$
. Then raw moment r is
 $\mu _r' \equiv \frac {1}{N} \sum _i Z_i^r$
(for
 $r=1,\dots $
). Štulajter (Reference Štulajter1978) proves that for normal variables like X (given Z),
 $$ \begin{align} E[S^r H_r(X_i/S)] = Z_i^r, \end{align} $$
where
 $H_r(x)$
is a Hermite polynomial. Therefore, an unbiased estimator is given by:
 $$ \begin{align} \hat{\mu}_r' = \frac{S^r}{n} \sum_i H_r(X_i/S). \end{align} $$
Equation 10 and the linearity of expectations shows that
 $\hat {\mu }_r'$
is unbiased. More precisely,
 $E\left [\frac {S^r}{n} \sum _i H_r(X_i/S)\right ] = E[\hat {\mu }_r'] = \mu _r'$
. With these unbiased estimates, we construct unbiased estimators of the central moments using this relationship (Papoulis Reference Papoulis1984):
 $\mu _r = \sum _{k = 0}^r {r \choose k}(-1)^{n-k}\mu _k'\mu _1^{n-k}$
. For instance, the second moment (the variance),
 $\mu _2$
, is
 $\mu _2 = -\mu _1 + \mu _2'$
and the skewness
 $(\tilde {\mu }_3)$
and kurtosis
 $(\tilde {\mu }_4)$
are transformations:
 $$ \begin{align} \hat{\tilde{\mu}}_3 = \frac{\hat{\mu}_3' - 3\hat{\mu}_1\hat{\mu}_2 + \hat{\mu}_1^3}{\hat{\mu}_2^{3/2}},\qquad \hat{\tilde{\mu}}_4 = \frac{-3\hat{\mu}_1^4 + 6\hat{\mu}_2'\hat{\mu}_1^2 - 4\hat{\mu}_1'\hat{\mu}_3' + \hat{\mu}_4}{\hat{\mu}_2^2}. \end{align} $$
We also derive the variance of these moments in Appendix C.
5.2 Histograms
Because the empirical density of the confidential data Z can be determined by all the moments, we tried to estimate the histogram from the first
 $R\leq n$
moments via methods such as “inversion” (Mnatsakanov Reference Mnatsakanov2008) and “imputation” (Thomas, Stefanski, and Davidian Reference Thomas, Stefanski and Davidian2011). Unfortunately, we found these methods inadequate for differentially private data. When S is large, too few moments can be estimated with enough precision to tell us enough about the density and, when S is small, the estimated distribution of Z closely resembles that of X and so offers no advantage. This problem is not a failure of methodology, but instead, a result of the fundamental nature of differential privacy: While protecting against privacy leakage, it also prevents us from learning some facts about the data that would have been useful for analysis. Statistically, recovering a histogram is especially difficult because the normal noise process is in the class of “supersmooth” densities (Fan Reference Fan1991). This problem is most obvious for outliers, which cannot be detected because extremes in the data are what differential privacy was designed to protect.
Since we cannot make out the outlines of the histogram through the haze of added noise, we turn to a parametric strategy with ex post diagnostic checks. That is, we first assume a plausible distribution for the confidential data and estimate its parameters using our methods from the differentially private data. After this parametric step, we then perform an ex post diagnostic check by comparing the higher-order moments we are able to estimate with reasonable precision (among those not used to determine the parameter values) to those implied by the estimated distribution. A large difference in the estimated higher-order moments suggests that we find a different distribution for the first step.
5.2.1 Distributions
We show how to estimate the parameters from five distributions. First, assume
 $Z\sim \text {Poisson}(\lambda )$
and choose which member of the Poisson family best characterizes our confidential data by estimating the first moment as in Equation 11 and setting
 $\hat \lambda = \frac {S}{n} \sum _{i=1}^n H_1(X_i/S)=\bar X$
. This distribution is our histogram estimate. Second, assume
 $Z\sim \mathcal {N}(\mu ,\sigma ^2)$
, and choose the distribution by setting
 $\hat \mu = \frac {S}{n} \sum _{i=1}^n H_1(X_i/S)$
and
 $\hat \sigma ^2 = -\hat \mu _1-\mu _2'$
. Details for the remaining three distributions, zero-inflated Poisson, Negative Binomial, and zero-inflated Negative Binomial, are given in Appendix D
5.2.2 Diagnostic Checks
We now introduce a diagnostic check for a distributional assumption by evaluating the observable implications in the form of higher-order moments not used in estimating which member of the class of distributions fits best and which are estimable with enough precision to be useful.
For illustration, let the confidential data be
 $Z_i \sim \text {ZINB}(0.4, 0.2, 20)$
and the privatized (differentially private) data
 $X_i \sim \mathcal {N}(Z_i, S^2)$
, with
 $S = 3.12$
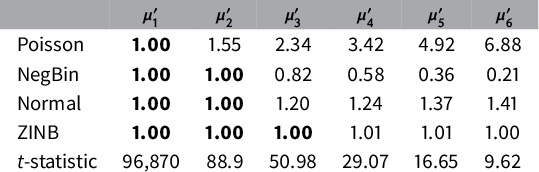
, which is also the standard deviation of Z—meaning that we are adding as much noise to the data as there is signal. Next, estimate each of the first six moments of confidential data directly (i.e., using the methods in Section 5.1) and also given the distributional assumptions. Table 2 reports ratios of these moments (directly estimated divided by the distributional estimate), for three distributional assumptions. The ratios in red are fixed to 1.00 using the direct estimates to determine the member of the class of distributions. The other ratios deviate from 1 as the two estimators diverge. The columns are the moments. The last row, marked “t-statistic” is a measure of the uncertainty of the observable implication—the direct estimate divided by its standard error (as derived in Appendix C). We included only the first six moments because t-statistics for others suggested little information would be gained.
Diagnosing parametric fit. Each table entry is the ratio of the direct to the parametrically estimated moment, with ratios to fixed to be equal in bold. The last row is the directly estimated moment divided by its standard error.

The first row of Table 2 assumes a Poisson distribution, and estimates its parameter by setting
 $\lambda =\hat \mu ^{\prime }_1$
. This means that moments
 $2,\dots ,6$
are observable implications unconstrained by the distributional assumptions. Unfortunately, all of these other moments are far from 1, indicating that the Poisson distribution does not fit the confidential data.
Poisson distributions, which can be thought of as analogous to a normal distribution with the variance set to an arbitrary value, often do not fit because of overdispersion (King Reference King1989; King and Signorino Reference King and Signorino1996). So we use the negative binomial distribution, which adds a dispersion parameter. The second line Table 2 with these results shows that the higher-level moments still do not fit well.
Given that the sample space of Z includes only non-negative integers, a normal distribution would not ordinarily be a first choice. However, as a test of our methodology, we make this assumption and present results in the third row of the table. As expected, it also does not fit well and so we are able to reject this assumption too.
Finally, we test the zero-inflated negative binomial (ZINB), which allows for both overdispersion, like the negative binomial, and excess zeros, as is common in count datasets. Fitting this distribution uses estimates of the first three moments, the ratios of which are set to 1.00 in the table. As we can see by the fourth, fifth, and sixth moments, this assumption fits the data well, as the ratios are all approximately 1.00.
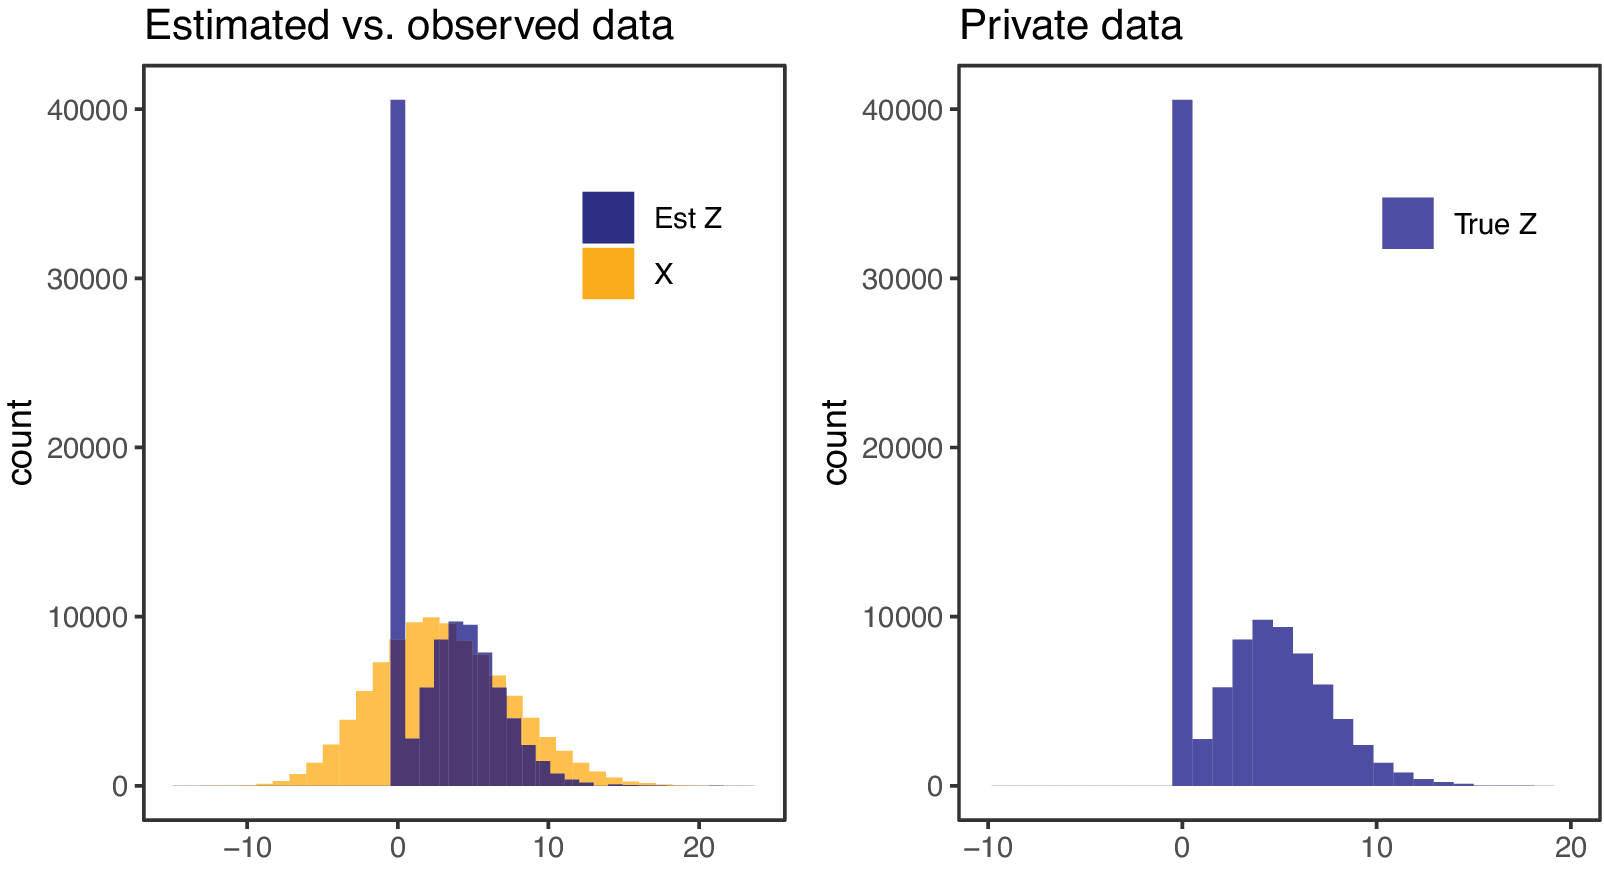
We conclude that ZINB is an appropriate assumption for summarizing the distribution of Z. We plot some of these results in Figure 4. The right panel plots the true distribution of the confidential data, our quantity of interest. The left panel gives the distribution of the private data in blue. This histogram differs considerably from the true distribution and, like the noise, appears normal. In contrast, we now see that the estimated distribution (in orange) is a good approximation for the true distribution in the right panel.
Estimated histograms of confidential data.

5.3 Regression Diagnostics
We now provide methods for detecting non-normal disturbances and heteroskedasticity.
5.3.1 Non-Normal Disturbances
We show here how to diagnose non-normal regression disturbances in confidential data. Non-normal distributions do not violate the assumptions of the classical regression model we estimate in Section 3, but they may well indicate important substantive clues about the variables we are studying, change our understanding of prediction intervals, or indicate the need for more data to achieve asymptotic normality of coefficient estimates.
Thus, instead of observing
 $\{y, Z\}$
, we observe
 $\{w, X\}$
through a differentially private mechanism where
 $X \sim \mathcal {N}(Z, S_x^2)$
and
 $w \sim \mathcal {N}(y, S_y^2)$
. Denote the true regression disturbances as
 $\epsilon = y-Z\beta $
. Then, using the observable variables, define
 $u=w-X\beta $
, which we estimate by substituting our consistent estimate
 $\tilde {\beta }$
for
 $\beta $
. Since normal error is added to w and X independently,
 $u \sim \mathcal {N}(\epsilon , S_y^2 + \beta 'S_x^2\beta )$
. We then estimate the moments of
 $\epsilon $
by direct extension of Section 5.1 and parallel the diagnostic procedure in Section 5.2 to compare the estimated moments to those from the closest normal.
We illustrate this approach with a simple simulated example. Let
 $Z \sim \mathcal {N}(10, 6^2)$
,
 $X \sim \mathcal {N}(Z, 3^2)$
, and
 $y = 10 + 3Z + \epsilon $
, where
 $\epsilon $
violates normality by being drawn from a mixture of two equally weighted independent normals, with zero means but variances
 $1$
and
 $36$
. Finally, we add differentially private noise to the outcome variable by drawing
 $w \sim \mathcal {N}(Y, 6^2)$
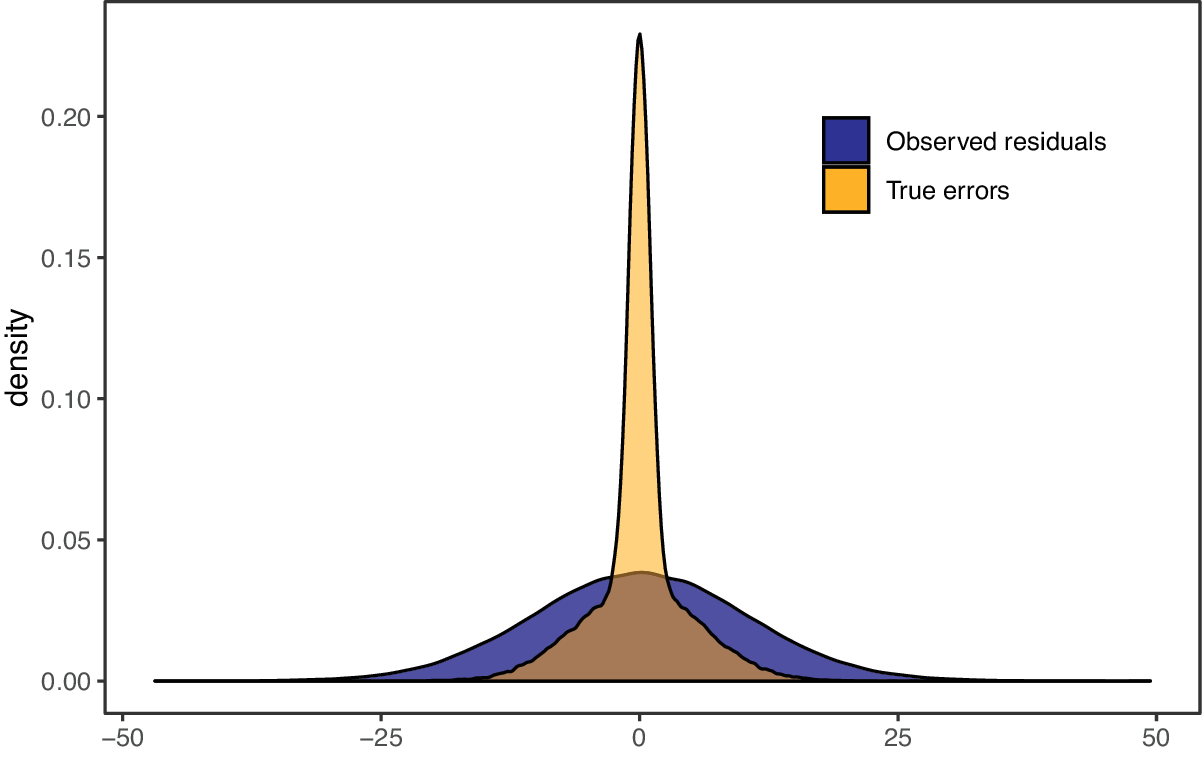
. Figure 5 compares the distribution of the uncorrected observed errors u with the distribution of the true disturbances,
 $\epsilon $
.
Histograms of observed residuals from confidential data with normal noise (in orange) and of the true residuals from the confidential data (in blue).

Although the distributions of the true errors (in blue) sharply deviate from the observed normal errors (in orange), we would not know this by from the observed residuals. Fortunately, because we are aware that direct observation of noisy data is often misleading, we know to turn to estimation of the moments of
 $\epsilon $
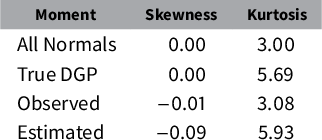
as described above. Thus, to detect non-normality, we use the standardized higher moments which are the same for all normal densities. As the first row of Table 3 shows, all normal distributions have skewness of zero and kurtosis of three. In contrast, our data generation process, although not skewed, is more highly peaked than a normal (as confirmed in the second row of the table). If we ignore the noise, which is itself normal, we would be mislead into seeing near-normal skewness and kurtosis (see the third row). In contrast, we return estimates (as reported in the final row) that are close to the true data generation process (in the second row).
Estimating regression disturbance non-normality.

5.3.2 Heteroskedasticity
Heteroskedasticity is usually taught as a violation of the classical regression model, causing inefficiency and incorrect standard errors, although these problems are less of a concern with immense datasets. A more important reason to search for heteroskedasticity is substantive. Social science hypotheses often concern means, but important substantive issues are related to variances. For example, in the URLs data, scholars may be interested in which regions of the world share false news more frequently or in which regions the variance in the frequency of sharing false news is higher or lower. Whereas a region that shares false news consistently may result from a dependence on the same unreliable news outlet, a region with a high variance would be prone to viral events.
Thus, we now generalize the classical regression model
 $Y = Z'\beta + \epsilon $
with
 $E(\epsilon )=0$
by letting
 $V(\epsilon )=Z'\gamma $
. If we could observe the confidential data, we could regress
 $\epsilon ^2$
on Z, estimating the variance function as a conditional expectation
 $E(\epsilon ^2|Z)=V(\epsilon |Z)=Z\gamma $
, where
 $\gamma $
indicates how the variance of
 $\epsilon $
varies linearly in Z (Z may be multivariate). We now derive a consistent estimator of
 $\gamma $
using the confidential data, which will enable a test of heteroskedasticity under the assumption of this functional form for the variance.
Let
 $u = Y - X'\beta $
. Then, over draws of the noise,
 $E[u^2] = \left [Y - Z'\beta \right ]^2 + \beta 'S^2\beta + S_y^2 = \epsilon ^2 + \beta 'S^2\beta + S_y^2$
, which suggests a plug-in estimator for
 $\epsilon ^2$
:
 $\hat {\epsilon }^2 = u - \tilde {\beta }'S^2\tilde {\beta } - S_y^2$
. However, even with this correction, the regression of
 $\hat {\epsilon }^2$
on X gives biased estimates of
 $\gamma $
, since X is a noise-induced proxy for Z. Thus, we use
 $\text {Cov}(\hat {\epsilon }^2, X|Z) = 0$
; that is, a mean zero normal is uncorrelated with its square. Since our dependent variable,
 $\hat {\epsilon }^2$
, and our explanatory variable, X, are measured with mean 0 random error and uncorrelated, we can use our bias corrected estimator
 $\tilde {\beta }$
. Our procedure then (a) computes
 $\hat \epsilon ^2$
, (b) estimates
 $\gamma $
from the naive regression of
 $\hat {\epsilon }^2$
on X, and (c) applies our bias correction procedure.
6 Concluding Remarks
Differential privacy has the potential to vastly increase access to data from companies, governments, and others by academics seeking to create social good. Data providers can share differentially private data without any meaningful risk of privacy violations, and can quantify the extent of privacy protections. This may solve aspects of the political problem of data sharing technologically. However, providing access to data does little if scholars produce results with statistical bias or incorrect uncertainty estimates, if the difficulty of analyzing the data appropriately causes researchers to not analyze the data at all.
Our goal has been to address these problems by offering an approach to analyzing differentially private data with statistically consistent and approximately unbiased estimates and standard errors. We develop these methods for the most commonly used statistical model in the social sciences, linear regression, and in a way that enables scholars to think about results just as they think about running linear regression analyses on public data. Point and uncertainty estimates are interpreted in the same way. We also quantify the privacy information loss by equating it to the familiar framework of obtaining a sample from the original (confidential) data rather than all of it, and introduce a variety of diagnostics and descriptive statistics that may be useful in practice.
We consider two directions that would be valuable for future research. First, linear regression obviously has substantial advantages in terms of computational efficiency. It is also helpful because linear regression estimates give the best linear approximation to any functional form, regardless of the functional form or distribution from the data generation process. However, scholars have gotten much value out of a vast array of other approaches in analyzing nonconfidential data, and so extending our approach to these other statistical methods or ideally a generic approach would be well worth pursuing, if indeed, they turn out to make it possible to unearth information not available via a linear approach. Finally, although censoring was not used in the Facebook URLs data, it is sometimes used to reduce the amount of noise added and so requires more substantial corrections (Evans et al. Reference Evans, King, Schwenzfeier and Thakurta2020). Building methods that correct differentially private data analyses for censoring would also be an important contribution.
Appendix A. Covariance Derivations
We now derive the covariances and estimators for the three types of elements of the variance matrix in Equation 8. First, we have
 $$ \begin{align*} \text{Cov}(X_k'X_j, X_{\ell}'X_m) &= \text{Cov}[(Z_k + \nu_k)'(Z_j + \nu_j),\ (Z_m + \nu_m)'(Z_{\ell} + \nu_{\ell})]\\ &= Z_k'Z_{\ell}S^2_{jm} + Z_k'Z_mS^2_{jl} + Z_j'Z_{\ell}S^2_{km} + Z_j'Z_mS^2_{k\ell} + n\left[S^2_{k\ell}S^2_{jm} + S^2_{km}S^2_{j\ell}\right] \end{align*} $$
and the consistent estimator:
 $$ \begin{align} \widehat{\text{Cov}}(X_k'X_j, X_{\ell}'X_m) = \left(\hat{\Omega}_{k\ell}S^2_{jm}+ \hat{\Omega}_{km}S^2_{jl} + \hat{\Omega}_{j\ell}S^2_{km} + \hat{\Omega}_{jm}S^2_{k\ell} + S^2_{k\ell}S^2_{jm} + S^2_{km}S^2_{j\ell}\right)\cdot n \end{align} $$
Next, we have
 $$ \begin{align*} \text{Cov}(X_k'y, X_j'y) &= \text{Cov}[(Z_k + \nu_k)'(Z\beta + \epsilon),\ (Z_j + \nu_j)'(Z\beta + \epsilon)]\\ &= \sigma^2 Z_k'Z_j + S^2_{kj}\left((Z\beta)'(Z\beta) + n\sigma^2\right) \end{align*} $$
for which we use this consistent estimator:
 $$ \begin{align} \widehat{\text{Cov}}(X_k'y, X_j'y) = n \hat{\sigma}^2 \hat{\Omega}_{kj} + S^2_{kj}(y'y). \end{align} $$
And finally, we compute
 $$ \begin{align*} \text{Cov}(X_k'y, X_j'X_m) &= \text{Cov}\left[(Z_k + \nu_k)'((Z\beta) + \epsilon),\ (Z_j + \nu_j)'(Z_m + \nu_m)\right]\\ &= S^2_{km}Z_j'(Z\beta) + S^2_{kj}Z_m'(Z \beta), \end{align*} $$
because
 $\epsilon $
is independent of all other quantities, and
 $Z_k'(Z \beta )$
and
 $Z_j'Z_m$
are constants. Given that
 $E(y) = Z \beta $
and
 $E(X_k) = Z_k$
, we use the consistent estimator
 $$ \begin{align} \widehat{\text{Cov}}(X_k'y, X_j'X_m) = S^2_{km}X_j'y + S^2_{kj}X_m'y. \end{align} $$
Appendix B. Interactions
Beginning with definitions from Section 3.2, we redefine the unobserved true covariates as
 $Z=(\textbf {1},Z_1,Z_2,Z_3,Z_1\cdot Z_2)'$
, where the interaction
 $(Z_1\cdot Z_2)$
is an
 $n\times 1$
vector with elements
 $\{Z_{1i}Z_{2i}\}$
. We then observe
 $X_j=Z_j+\nu _j$
for
 $j=1,2,3$
and define
 $X=(\textbf {1},X_1,X_2,X_3,X_1\cdot X_2)'$
. (The variables
 $X_3$
and
 $Z_3$
can each refer to a vector of any number of covariates not part of the interaction.) As before,
 $\mathrm{plim}(X'Z/n)=\mathrm{plim}(Z'Z/n)=\Omega $
, which is now a
 $5\times 5$
matrix, the upper left
 $4\times 4$
submatrix of which, with
 $x=(\textbf {1},X_1,X_2,X_3)$
, is defined as before:
 $(x'x/n)-S^2$
. We now derive the final column (and, equivalently, row) of
 $\Omega $
, the elements of which we write as (
 $\Omega _{012}, \Omega _{121}, \Omega _{122}, \Omega _{123}, \Omega _{1212}$
), with subscripts indicating variables to be included (0 referring to the intercept).
We then give asymptotically unbiased estimators for each:
 $$ \begin{gather*} \hat{\Omega}_{012} = \frac{\textbf{1}'(X_1\cdot X_2)}{n},\quad \hat{\Omega}_{121} = \frac{(X_1\cdot X_2)'X_1}{n} - S_1^2 \bar{X}_2,\quad \hat{\Omega}_{122} = \frac{(X_1\cdot X_2)'X_2}{n} - S_2^2 \bar{X}_1\\ \hat{\Omega}_{123} = \frac{(X_1\cdot X_2)'X_3}{n},\quad \hat{\Omega}_{1212} = \frac{(X_1\cdot X_2)'(X_1\cdot X_2)}{n} - \left(S_1S_2^2 + S_2^2\hat{\mu}_1^2 + S_1^2\hat{\mu}_2^2\right). \end{gather*} $$
For example, to derive an estimator for
 $\hat {\Omega }_{121}$
, write
 $$ \begin{align*} X_1'(X_1X_2) &= (Z_1 + V_1)'\left[(Z_1 + V_1)(Z_2 + V_2)\right]\\ &= Z_1'[Z_1Z_2 + V_1V_2 + Z_1V_2 + Z_2V_1] + V_1'[Z_1Z_2 + V_1V_2 + Z_1V_2 + Z_2V_1]. \end{align*} $$
We then take the expectation,
 $E[(X_1X_2)'X_1] = Z_1'(Z_1Z_2) + S_1^2 \sum _i Z_{2i}$
, and take the limit
 $$ \begin{align*} \lim_{n \rightarrow \infty} E\left[\frac{(X_1X_2)'X_1}{n}\right] = \Omega_{121} + S_1^2 \mu_{Z_2}, \end{align*} $$
where
 $\text {plim}(\bar {Z_2}) = \mu _{Z_2}$
. Finally, we solve for
 $\Omega _{121}$
, replacing the expected value with the observed value
 $(X_1X_2)'X_1$
leaving
 $\hat {\Omega }_{121}$
.
Appendix C. Variance of Raw Moment Estimates
To derive the variance of
 $\hat {\mu }_r'$
, write:
 $$ \begin{align*} V(\hat{\mu}_r') = V\left(\frac{S^r}{n} \sum_i H_r(X_i/S)\right) = \left(\frac{S^{2r}}{n^2}\right) \sum_i V(H_r(X_i/S)) \end{align*} $$
approximate
 $V(H_r(X_i/S))$
by the delta method,
 $V(H_r(X_i/S)) \approx V(X_i/S) \left (H_r'(X_i/S)\right )^2 = \left (H_r'(X_i/S)\right )^2$
, and use a result from Abramowitz and Stegun (1964), that
 $\frac {d}{dx}H_r(x) = 2rH_{r-1}(x)$
, to derive our variance estimate:
 $\hat V(\mu _r') = \left (\frac {4r^2S^{2r}}{n^2}\right )\sum _i \left (H_{r-1}(X_i/S)\right )^2$
.
Appendix D. Parametric Histogram Estimation
The first two distributions are provided in Section 5.2. The third is an empirically common generalization of the Poisson distribution that accounts for the possibility of excess zeros is the zero-inflated Poisson (ZIP) distribution, defined on the non-negative integers:
 $$ \begin{align} \Pr(Z_i = z|\pi,\lambda) = \begin{cases} \pi + (1 - \pi)\text{exp}(-\lambda) & \text{for }z=0,\\ (1 - \pi)\frac{\lambda^z\text{exp}(-\lambda)}{z!} & \text{for }z\geq 1. \end{cases} \end{align} $$
In this case, we have two unknown parameters,
 $\{\pi , \lambda \}$
, which we write as a function of the first two moments, with estimators from Section 5.1, and then solve for the unknowns:
 $\hat {\pi } = 1 - \frac {(\hat {\mu }_1')^2}{\hat {\mu }_2' - \hat {\mu }_1'}$
and
 $\hat {\lambda } = \frac {\hat {\mu }_2' - \hat {\mu }_1'}{\hat {\mu }_1'}$
.
Fourth, a second type of empirically common generalization of the Poisson is the Negative Binomial, which allows for overdispersion (a variance greater than the mean):
 $\Pr (Z_i = z) = \binom {z + r - 1}{z}(1 - p)^r p^z$
for nonnegative integers z. To construct estimators for
 $\{p, r\}$
, write the first two (central) moments as
 $\mu _1 = \frac {pr}{1-p}$
and
 $\mu _2 = \frac {pr}{(1-p)^2}$
. We then solve for the two unknowns
 $\{p, r\}$
and use plug-ins:
 $\hat {p} = 1 - \frac {\hat {\mu }_1}{\hat {\mu }_2},$
 $\hat {r} = \frac {-\hat {\mu }_1^2}{\hat {\mu }_1 - \hat {\mu }_2}$
.
Finally, we introduce the zero-inflated negative binomial (ZINB) which combines a count distribution overdispersion and with excess zeros. Let
 $$ \begin{align} \Pr(Z_i = z|\pi,r,p) = \begin{cases} \pi + (1 - \pi) \binom{r-1}{z} (1 - p)^r & \text{for }z=0,\\ (1 - \pi)\binom{z + r - 1}{z}(1 - p)^r p^z & \text{for }z\geq 1, \end{cases} \end{align} $$
where
 $\pi $
is the zero inflation parameter and
 $E[Z_i] = \frac {p\cdot r}{1-p}$
. We then need to estimate the parameters
 $\{\pi , r, p\}$
using only the observed X. First note that the moment-generating function of the negative binomial is
 $\left (\frac {1 - p}{1 - pe^t}\right )$
, from which we can derive any moments. We then solve for the ZINB moments as a weighted sum of the moments of the zero inflated and negative binomial components, respectively, with the former set equal to
 $0$
:
 $$ \begin{gather*} \mu_1^{\prime} = (1 - \pi) \frac{rp}{1-p},\quad \mu_2^{\prime} = (1 - \pi) \frac{rp(1 + rp)}{(1-p)^2},\quad \mu_3^{\prime} = (1 - \pi) \frac{rp(1 + (1 + 3r)p + r^2p^2)}{(1-p)^3}. \end{gather*} $$
Finally, we obtain our estimator of
 $\{p, r, \pi \}$
by substituting
 $\{\hat {\mu }_1^{\prime }, \hat {\mu }_2^{\prime }, \hat {\mu }_3^{\prime }\}$
for
 $\{\mu _1^{\prime }, \mu _2^{\prime }, \mu _3^{\prime }\}$
and solving this system of equations to produce
 $\{\hat {p}, \hat {r}, \hat {\pi }\}$
:
 $$ \begin{gather*} \hat{\pi} = \frac{(\hat{\mu}_1^{\prime})^2\hat{\mu}_2^{\prime} + \hat{\mu}_1^{\prime}(\hat{\mu}_2^{\prime} + \hat{\mu}_3^{\prime}) - 2(\hat{\mu}_2^{\prime})^2 - (\hat{\mu}_1^{\prime})^3}{\hat{\mu}_1^{\prime}(\hat{\mu}_2^{\prime} + \hat{\mu}_3^{\prime}) - 2(\hat{\mu}_2^{\prime})^2},\qquad \hat{p} = \frac{\hat{\mu}_1^{\prime}(\hat{\mu}_2^{\prime} - \hat{\mu}_3) + (\hat{\mu}_2^{\prime})^2 - (\hat{\mu}_1^{\prime})^2}{(\hat{\mu}_2^{\prime})^2 - \hat{\mu}_1^{\prime}\hat{\mu}_3^{\prime}}\\ \hat{r} = \frac{2\hat{\mu}_2^{\prime 2} - \hat{\mu}_1^{\prime}(\hat{\mu}_2^{\prime} + \hat{\mu}_3^{\prime})}{(\hat{\mu}_1^{\prime})^2 + \hat{\mu}_1^{\prime}(\hat{\mu}_3^{\prime} - \hat{\mu}_2^{\prime}) - (\hat{\mu}_2^{\prime})^2}. \end{gather*} $$
An estimate of the histogram of Z is available by merely plugging the estimated parameters into the ZINB. We can also report some directly meaningful numerical quantities, such as the the overdispersion of the negative binomial component,
 $1/\hat {r}$
and the estimated proportion of
 $0$
s in the data,
 $\hat {\pi }_0 = \hat {\pi } + (1 - \hat {\pi }) \binom {\hat {r} - 1}{1}(1 - \hat {p})^{\hat {r}}$
.
Acknowledgments
The authors thank Nick Beauchamp, Matt Blackwell, Cody Buntain, Ruobin Gong, Max Goplerud, Kosuke Imai, Wenxin Jiang, Shiro Kuriwaki, Solomon Messing, Martin Tanner, and Xiang Zhou for helpful suggestions and Hahn Jung Lheem for expert research assistance.
Data and Code Availability Statement
Open source software that implements the methods in this paper, called PrivacyUnbiased, is available at github.com/georgieevans/PrivacyUnbiased. All information necessary to replicate the results in this paper is available at Evans and King (Reference Evans and King2021a).