Introduction
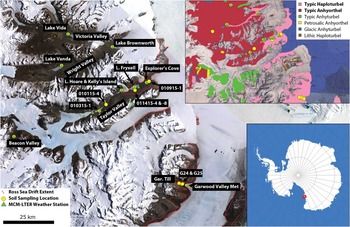
The McMurdo Dry Valleys (MDV) are the largest ice-free area in Antarctica (4500 km2) (Levy Reference Levy2012). They consist of a mosaic of bedrock outcrops, soils, seasonal streams, alpine glaciers and ice-covered lakes (Fig. 1). They host ancient permafrost landscapes, including Miocene-age buried ice deposits and debris-covered glaciers, Pleistocene tills, palaeolake deposits and shoreline deposits that together form the basis for reconstructing Antarctic coastal climate conditions and ice sheet grounding line positions during the Last Glacial Maximum and the transition into the Holocene interglacial. However, because many of these ancient landforms are ice-cemented or ice-cored, they are at risk of being disrupted by melting and thermokarst landscape subsidence (Swanger & Marchant Reference Swanger and Marchant2007, Fountain et al. Reference Fountain, Levy, Gooseff and van Horn2014). Melting of ice-rich permafrost and loss of the geological records of climate-driven surface processes through slope failure has already begun in the MDV (Levy et al. Reference Levy, Fountain, Dickson, Head, Okal, Marchant and Watters2013b) in response to changes in soil and ice surface energy balance.
The McMurdo Dry Valleys (MDV) of Antarctica. Soil sample locations and the locations of current and past MCM-LTER long-term automatic weather stations (AWS) are marked. The extent of the Ross Sea Drift ice-cored glacial till is outlined in red (Stuiver et al. Reference Stuiver, Denton, Hughes and Fastook1981). Lower inset shows the location of the MDV in the Ross Sea sector of Antarctica (red box). Upper inset shows the locations of sampling sites and MCM-LTER AWS installations in the context of the (Bockheim et al. Reference Bockheim, Prentice and McLeod2008) soil map of the MDV. Soils sampled in this study represent diverse examples of Typic Haploturbels and Anhyorthels.

Landscape disruption and loss of terrestrial palaeoclimate records in melting permafrost and ground ice is not a uniquely Antarctic phenomenon. Melting of Arctic permafrost deposits is widespread (Gooseff et al. Reference Gooseff, Balser, Bowden and Jones2011) and is resulting in regional reorganization of hydrological systems. At temperate latitudes, melt-out from alpine permafrost, rock glaciers and debris-covered glaciers is resulting in mixing of Holocene deposits of different ages with modern surface waters (Caine Reference Caine2010). While in the tropics, high alpine permafrost and debris-covered ice deposits are also becoming unstable and ablating (Thompson et al. Reference Thompson, Brecher, Mosley-Thompson, Hardy and Mark2009). Ablation of shallow ground ice may even be shaping the morphology of the surface of Mars (Mustard et al. Reference Mustard, Cooper and Rifkin2001). The common mechanism in these melting and ablation events is the presence of a sediment or soil cover over the ground ice or permafrost that is insufficiently thick to damp out the seasonal thermal wave to an amplitude below which the ground ice is stable against melting or sublimation.
In order to better understand its history and to predict the stability of Antarctic ground ice and permafrost in response to future warming (Chapman & Walsh Reference Chapman and Walsh2007), several investigators have examined the thermal characteristics of soils in the MDV (Campbell et al. Reference Campbell, MacCulloch and Campbell1997a). The most important physical properties for understanding the thermal regime of a soil are its heat capacity, c (here, in volumetric form MJ m-3 K-1), its thermal conductivity, k (W m-1 K-1), and its thermal diffusivity, D, the ratio of conductivity and heat capacity (mm2 s-1). Alternatively, a material’s specific heat capacity (MJ m-3 K-1) and density (kg m-3) can be measured to determine thermal diffusivity as the ratio of conductivity to specific heat capacity times density. In general, previous investigations have considered best-fit values for c, k and D or have considered values as a function of ice content. For D, previous measurements range from extremely high (2–3 mm2 s-1) in high elevation ice-cemented soils and rock (Pringle et al. Reference Pringle, Dickinson, Trodahl and Pyne2003) to values more typical of dry sand (0.2–0.3 mm2 s-1) (Oke Reference Oke1987, Swanger & Marchant Reference Swanger and Marchant2007) to relatively low values for loose soils in ice-free areas of northern and southern Victoria Land (<0.1–0.13 mm2 s-1) (MacCulloch Reference MacCulloch1996, Ikard et al. Reference Ikard, Gooseff, Barrett and Takacs-Vesbach2009). Other workers have inverted field temperature measurements to generate a D value (assuming constant heat capacity, density and conductivity) and then determined best-fit k values of 0.6 and 2.5 W m-1 K-1 for dry and ice-saturated soils, respectively, using separately measured values of heat capacity and density (McKay et al. Reference McKay, Mellon and Friedmann1998, McKay Reference McKay2009).
As noted by Ikard et al. (Reference Ikard, Gooseff, Barrett and Takacs-Vesbach2009), even in the MDV where soils are typically extremely dry (~1 wt.% water on average at the surface, increasing towards up to ~10% at the ice table interface) (Campbell et al. Reference Campbell, Claridge, Balks and Campbell1997b, Reference Campbell, Claridge, Campbell and Balks1998), soil moisture plays a controlling role in determining soil apparent thermal diffusivity. Apparent thermal diffusivity treats all heat transfer as conductive, even if some is convective due to soil moisture circulation. The influence of soil moisture on thermal properties is important for understanding permafrost resistance to thaw and active layer thickness because soil moisture is distributed heterogeneously in the MDV; wet soils thaw deeply, suggesting a possible hydrological control on the stability of underlying permafrost and ground ice. Water in the seasonally thawed portions of Antarctic soils can come from snow melt (Hunt et al. Reference Hunt, Treonis, Wall and Virginia2007), deliquescent brine formation (Levy et al. Reference Levy, Fountain, Welch and Lyons2012), melt of underlying ground ice (Lyons et al. Reference Lyons, Welch, Carey, Doran, Wall, Virginia, Fountain, Csatho and Tremper2005, Levy et al. Reference Levy, Fountain, Gooseff, Welch and Lyons2011) or hyporheic exchange with streams (McKnight et al. Reference McKnight, Niyogi, Alger, Bomblies, Conovitz and Tate1999). Water tracks, hillslope-scale groundwater channels, currently cover ~1–5% of MDV soils and are expected to become even more widespread in response to regional warming and increases in snowfall (Levy et al. Reference Levy, Fountain, Gooseff, Welch and Lyons2011), expanding the land area affected by wetted soils.
Therefore, in order to help predict the response of Antarctic active layers and permafrost to changing soil moisture conditions, the thermal properties of a range of MDV soils were measured under the full range of soil moisture conditions encountered in the field (dry to water-saturated). Laboratory measurements of c, k and D were then used to calculate a simplified conductive thaw depth for idealized MDV soils to illustrate the maximum possible change in active layer thickness that could occur in thawing soils due to the addition of meltwater. Accordingly, we test the hypothesis that heterogeneities in MDV soil thermal properties can explain the geomorphical response of landscapes to ongoing changes to surface energy budgets, and identify a potential positive feedback cycle in which melting ground ice features accelerate future thaw by increasing soil thermal diffusivity.
Regional setting
Soils were sampled from valley bottoms in the MDV in southern Victoria Land (Fig. 1). With mean annual temperatures of -18°C (Doran et al. Reference Doran, Dana, Hastings and Wharton1995) and 3–50 mm of snowfall precipitation per year, most of which sublimates (Fountain et al. 2009), all soils sampled in this investigation are classified as Gelisols (Bockheim et al. Reference Bockheim, Prentice and McLeod2008, Ugolini & Bockheim Reference Ugolini and Bockheim2008). The soils were collected from sites dominated by Typic Haploturbels and Anhyorthels, and whenever possible, were collected from the vicinity of active or former McMurdo Dry Valleys Long-Term Ecological Research programme (MCM-LTER) automatic weather stations to provide a proximal, long-term dataset for modelling of heat transfer in soil (Fig. 1). Soils were collected from the active layer above the continuous permafrost that dominates the region (Bockheim et al. Reference Bockheim, Campbell and McLeod2007), from soils overlying dry frozen permafrost, ice-cemented permafrost and buried ice. Soils in the region generally contain little organic matter, typically <0.5 wt.% (Campbell et al. Reference Campbell, Claridge, Campbell and Balks1998), although organic matter enrichments up to several weight percent can occur in streams and water tracks where microbial mats occur (Levy et al. Reference Levy, Fountain, Gooseff, Barrett, Vantreese, Welch, Lyons, Nielsen and Wall2013c). The MDV soils exhibit abundant evidence of physical modification, including thermal contraction crack polygons, inflated desert pavements (Bockheim Reference Bockheim2010), ventifaction, etc. Soils were collected from dry active layer soils (Bockheim et al. Reference Bockheim, Campbell and McLeod2007) and not from visibly wetted water tracks or wet patches.
Methods
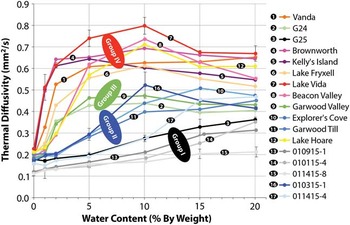
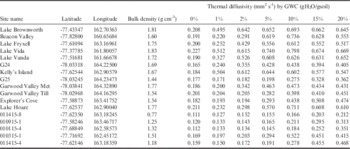
Soil samples were collected in 2009 and 2015 from the upper 10 cm of the soil column at 17 sites in Taylor, Wright, Beacon and Garwood valleys (Fig. 1, Table I). Soils were stored frozen in Whirl-Pak bags and were oven-dried at 105°C for 24 hours prior to being shipped to the University of Texas, Austin. Sediments were then homogenized and manually compressed to field density in a beaker. Sample density was matched with soil dry bulk density measured previously using a volumetric sampler (PVC tube) inserted into the soil column (Levy et al. Reference Levy, Fountain, Gooseff, Welch and Lyons2011). Soil thermal properties (k, c, D) were measured using a Decagon Devices KD2 Pro thermal properties analyzer (Pullman, WA) with a dual needle SH-1 probe inserted into the soil sample. The dual needle probe works by heating one needle and recording temperature change from ambient conditions on the second needle. The KD2 Pro software then fits the heating response on the measurement needle to best-fit values of k and D, from which c is subsequently calculated. The KD2 Pro has a measurement accuracy of ±10% for c, k and D. Triplicate measurements were conducted on each sample at each level of water saturation. Measured masses of water were added to each sample sequentially, raising the soil moisture content from 0% to 1%, 2%, 5%, 10%, 15% and 20% by mass (Fig. 2, Table I and supplemental data found at http://dx.doi.org/10.1017/S0954102016000201). After wetting experiments, soils were oven-dried and sieved to determine grain size distributions.
Soil thermal diffusivity as a function of soil moisture. Four groups of soil behaviour can be observed: low D (group I, grey), moderate D with low soil moisture sensitivity (group II, blue), moderate D with high soil moisture sensitivity (group III, green) and high D (group IV, warm colours). Error bars are the standard deviation of three measurements and are shown for four example curves. All standard deviations are below instrumental uncertainty. Samples are numbered for clarity.

Sample locations, bulk density and thermal diffusivity measurements.

GWC=gravimetric water content; Met=meteorological station.
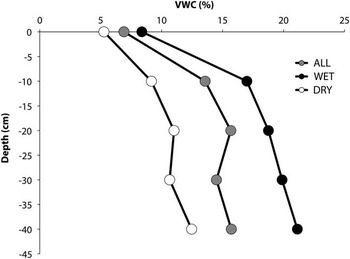
In order to compare soil thermal properties to field conditions, soil moisture content was measured in 23 soil excavations in Taylor Valley on visibly wet (dark) and dry (bright) soils from the surface down to ~40 cm (the depth of the ice table) (Fig. 3). Soil temperature, electrical conductivity and volumetric water content were measured using a Decagon Devices 5-TE probe (Pullman, WA) and a Taylor Valley-specific soil moisture calibration (resulting in volumetric water content measurements with uncertainty of <2%) (Levy et al. Reference Levy, Fountain, Gooseff, Welch and Lyons2011). The 5-TE measures temperature using a surface-mounted thermistor, conductivity by inverting the measured resistivity between two electrodes separated by the soil medium, and soil volumetric water content by measuring the dielectric permittivity of the soil via the charging of a sensor prong stimulated through the soil medium by a 70 MHz oscillating electric field. From these measurements, average soil moisture profiles with depth were calculated at 10 cm increments to represent typical field conditions for wet, dry and average soils (Fig. 3 and supplemental data). From these profiles, field-representative thermal diffusivity values were determined.
Field-derived average soil moisture (volumetric water content, VWC) profiles for dry (typical), wet (on water track), and all sampled soils (n=23). Sample locations, sampling dates, etc. are included in the supplemental data found at http://dx.doi.org/10.1017/S0954102016000201. Wet soils are saturated at the base of the soil column.

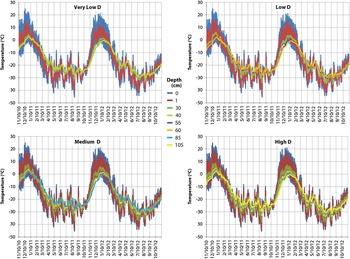
In order to relate laboratory measurements of soil thermal properties to active layer processes, an elementary 1-D thermal model was employed to propagate surface temperatures observed at the Explorer’s Cove MCM-LTER weather station to depth in the soil column (Fig. 4). Surface temperatures are measured with a Campbell Scientific 107 thermistor probe located immediately under the soil surface (~0–1 cm) (Doran et al. Reference Doran, Dana, Hastings and Wharton1995) and are logged at 15 minute intervals on a Campbell Scientific CR-10X datalogger. Thermistor probes are shielded from direct sunlight and are checked one or more times per year to ensure accurate measurement depth. Explorer’s Cove was chosen because it has a long, fully continuous surface temperature record and is located proximally to several samples in this study. In order to calculate the depth that reaches 0°C (the minimum thaw depth) under conductive heating with no phase change, a soil column was simulated with four different thermal diffusivity values based on the laboratory measurements: very low (0.111 mm2 s-1), low (0.25 mm2 s-1), medium (0.5 mm2 s-1) and high (0.763 mm2 s-1). These thermal diffusivity values bracket the range of soil moisture and thermal diffusivity conditions measured in the field observations. The finite difference thermal model was initialized on a 5 cm resolution grid. The upper boundary condition was defined by the measured soil surface temperature from 1 January 2010 to 1 January 2012, and the lower boundary condition (temperature at 10 m depth) was fixed at -18°C, the mean annual temperature. The model was initialized with a linear temperature gradient from the soil surface to 10 m depth, and was driven by varying the surface temperature using the 15 minute soil surface temperature measurements. Soil temperature at depth was then calculated using the discretized form of the heat diffusion equation:
 $$T_{i}^{{n{\plus}1}} =T_{i}^{n} {\plus}D\Delta t{\rm }\left( {{{T_{{i{\plus}1}}^{n} {\minus}2T_{i}^{n} {\plus}T_{{i{\minus}1}}^{n} } \over {\left( {\Delta x} \right)^{2} }}} \right),$$
where i defines the depth grid point (from 5 cm depth to 10 m), n defines the time-step iteration (15 minute intervals, Δt), and x is the grid spacing (5 cm) (Fig. 4). The depth of thaw under the same surface temperature forcing in response to different soil thermal diffusivities was determined by identifying the shallowest depth in each model run at which temperatures reached within 0.1°C of 0°C during the June 2010 to March 2011 (spring-summer-autumn) timeframe.
Modelled soil temperature profiles under different thermal diffusivity regimes. Each plot is driven by the same measured temperature record at the surface (0 cm depth). The minimum depth reaching 0°C is shown for each panel and can be seen reaching the freezing boundary in the centre of each graph (e.g. 30 cm for very low D, 60 cm for low D, 85 cm for medium D and 105 cm for high D).

Finally, in order to evaluate the role of soil thermal properties on landscape evolution, satellite (Quickbird and WorldView-2) and ground-based images of thermokarst landforms in the MDV were examined to determine which soil types were associated with rapidly forming thermokarst landforms. Time-stamped images were co-registered and examined for ice melt-related change as a function of soil type.
Results
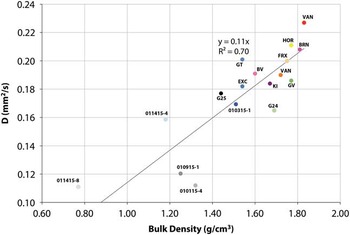
Thermal diffusivity values measured using the methods described above range from ~0.1 mm2 s-1 to ~0.8 mm2 s-1 (Fig. 2). Soil thermal conductivities range from ~0.1 W m-1 K-1 to ~1.8 W m-1 K-1, while soil heat capacity ranged from <1 MJ m-3 K-1 to >3 MJ m-3 K-1. Soil dry bulk density ranged from 0.77 to 1.81 g cm-3 (Table I, Fig. 5), although the occasional presence of pebble sized clasts in the samples can locally raise dry bulk density, suggesting that sample density should be considered to have an uncertainty of ~10%. Soil thermal properties are strongly influenced by soil moisture content. However, the thermal properties of the different soils change heterogeneously; some exhibit rapid increases in thermal conductivity with additions of soil moisture, while others exhibit slow increases in thermal conductivity (see supplemental data found at http://dx.doi.org/10.1017/S0954102016000201).
Soil thermal diffusivity at 0% volumetric water content versus soil bulk density. Colour coding is identical to that used in Fig. 2. A linear fit to the observations is shown (fixed to 0 thermal diffusivity at 0 density).

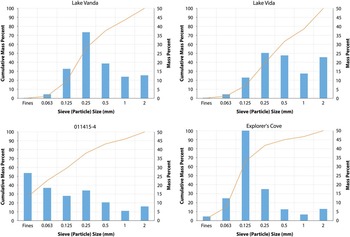
Soils in this study are dominated by sand-sized mineral particles (Fig. 6 and supplemental data), which produce soil diffusivity profiles similar to idealized sand thermal diffusivity curves. No strong correlations exist between grain size and thermal diffusivity; however, the lowest diffusivity soils are all enriched in fines (silt plus clay): 10–35% versus <2% in most other samples. These fines-enriched, low diffusivity samples are either palaeolake lacustrine silts (011415-8), Ross Sea Drift tills (G25, Garwood Valley Till and 010915-1), or aeolian silts that underlie an inflated desert pavement (on or off the Ross Sea Drift till) (010115-4, 010315-1 and 011415-4).
Grain size distribution examples of four sediment samples. Soils are generally sand-dominated (e.g. Lake Vanda) but may be coarser or finer textured (Lake Vida and Explorer’s Cove, respectively). Other soils, particularly those with low thermal diffusivity are silt/clay-dominated and are inferred to be derived largely from inflated aeolian sediments (Bockheim Reference Bockheim2010). See supplemental material for all grain size distribution data (found at http://dx.doi.org/10.1017/S0954102016000201).

Calculated maximum thaw depths range from 30 cm (D=0.1 mm2 s-1) to 105 cm (high diffusivity case), with minimum thaw depth increasing with increasing thermal diffusivity. Model output was compared to measured soil temperatures at 5 and 10 cm depth. For the Explorer’s Cove weather station, RMS errors at 5 and 10 cm depths for 1 January 2011 to January 2012 are 1.5 and 1.4, respectively, for the very low diffusivity model, 1.4 and 1.4 for the low diffusivity model, 1.6 and 1.8 for the medium diffusivity model, and 1.8 and 2.1 for the high diffusivity model. This is consistent with laboratory measured diffusivity values for the Explorer’s Cove soils of ~0.18 mm2 s-1 for low (<3% volumetric water content) soil moisture conditions, which dominate the upper portion of the Taylor Valley soil column (0–10 cm).
Discussion
Our measurements and simplified modelling results suggest that mineral soils in the MDV display markedly different thermal properties in response to wetting, even within the same broad soil type, and that these differences may have profound impacts on the thawing behaviour of the active layer. Here we discuss the experimental and modelling results, and how these different responses to wetting are interpreted to interact with past and present landscape change in the MDV by providing i) local examples of sediment-mediated melt and ii) a proposed feedback mechanism for how MDV surface processes may result in changes to soil thermal properties.
All measured soils have low thermal diffusivity values at low water contents (e.g.~0.1–0.2 mm2 s-1 when dry), similar to D values used in previous studies of soil thermal structure in the MDV. Within the studied soils, four major groups emerge from the analyses that have different responses to wetting. The first group (I, grey in Fig. 2) have low thermal diffusivity at all soil moisture contents, which increases slowly in response to wetting (~0.1 –<0.3 mm2 s-1). The next group of soils (II, blue in Fig. 2) have intermediate wet diffusivities (0.4–0.5 mm2 s-1), but increase slowly in response to wetting, only reaching high D values at soil moisture contents in excess of 10%. In contrast, a third soil group (III, green in Fig. 2) has very similar saturated thermal diffusivity to group II soils but increases from low D (~0.2 mm2 s-1) to moderate D (0.4–0.5 mm2 s-1) as a result of small amounts of water addition (3–5% by weight). Finally, the fourth group of soils (IV) has markedly higher wetted thermal diffusivity, ranging from ~0.5 mm2 s-1 to nearly 0.8 mm2 s-1 (warm colours in Fig. 2).
These results show that the thermal properties of MDV soils are highly variable both spatially (e.g. isolated silt-rich patches versus relatively uniform tills) as well as with depth. Less dense soils (Fig. 5) have lower thermal diffusivities than dense soils, suggesting that both geological control on sediment parent materials (e.g. low density sandstones versus high density dolerites) as well as sedimentological sorting and emplacement processes (lacustrine sedimentation, aeolian inflation, etc.) have the potential to strongly influence soil thermal properties in the MDV. Soil moisture increases with depth in all MDV soils (e.g. Fig. 3) meaning thermal diffusivity increases with depth, even in apparently ‘dry’ soils. Accordingly, even in the absence of changes to surface energy balance, these results suggest that maximum thaw depths (the depth to 0°C in the diffusion model) may vary by nearly a factor of two across the MDV, based only on spatial differences in soil type and heterogeneity in soil moisture distribution.
This numerical calculation of conductive thaw depth is consistent with analytical solutions for temperature structure in soils under periodic thermal cycling, based on the range of measured D values. The damping depth:
 $\sqrt {{{2D} \over \omega }} $
, (2) where ω is the frequency of the annual thermal wave, is the depth of penetration of a thermal wave (Campbell Reference Campbell1977, McKay Reference McKay2009), and should differ by a factor of 2.8 for soils with D values that range over a factor of approximately eight. The differences in analytical and numerical calculations of thaw depth probably arise from the truncated periodic shape of the annual temperature cycle in the MDV (Fig. 4), which produces a muted annual temperature amplitude when compared to a fully periodic model.
This simplified modelling result is conservative and does not consider the maximum thawing depth (overall active layer thickness) (Adlam et al. Reference Adlam, Balks, Seybold and Campbell2010) that would be achieved by further conduction and advection of heat into ice-cemented or meltwater-saturated soil, nor does this result consider the full heat budget associated with phase change during the thawing of ice-cemented permafrost (e.g. Hinzman et al. Reference Hinzman, Goering and Kane1998). Rather, once melting is initiated, provided there is enough ground ice present to keep soils wet or poor enough drainage to keep meltwater from flowing away, these measurements show that, unlike organic-rich arctic soils (for which thermal diffusivity is largely invariant with changes in soil moisture; Campbell Reference Campbell1977) melting of permafrost and buried ice in mineral soil environments produces a positive thermal diffusivity feedback. Wet, meltwater-saturated soils allow for more heat to conduct to the ice table, accelerating melting.
Field observations of rare, water-saturated active layer conditions in the MDV (e.g. within water tracks) indicate that where water is abundant, the markedly higher thermal conductivity in wet soils compared to dry soils overwhelms the added heat capacity of wet soils and the additional latent heat required to thaw ice-cemented soils, resulting in thaw depths that can be more than twice as deep in wet soils than in adjacent dry soils (45 versus 19 cm; Levy et al. Reference Levy, Fountain, Gooseff, Welch and Lyons2011). Ultimately, this proposed wetting-melting feedback requires water to remain in the soils and not run off, evaporate, or re-freeze and sublimate. Outside of snow melt infiltration (Hunt et al. Reference Hunt, Treonis, Wall and Virginia2007), little is known about the distribution and seasonal water budget for active layer water in the MDV; however, field observations of subsurface ponding of water track fluids in low-slope areas (Levy et al. Reference Levy, Fountain, Gooseff, Barrett, Vantreese, Welch, Lyons, Nielsen and Wall2013c) suggest that ground ice melt does flow over the ice table and can participate in heat transfer over the course of the summer.
Sediment-mediated melting examples
What do these different soil responses to wetting suggest about ground ice and permafrost stability in the MDV? The Ross Sea Drift is an ice-cored glacial till that preserves remnants of Pleistocene-age ice sheet material (Stuiver et al. Reference Stuiver, Denton, Hughes and Fastook1981, Levy et al. Reference Levy, Fountain, O’Connor, Welch and Lyons2013a). Across the southern MDV (e.g. Garwood Valley), the maximum depth of thaw in the Ross Sea Drift is demarcated by the transition between overlying sediment and buried ice, indicating that over ~15–18 ka timescales, the depth of annual thaw has not exceeded ~40–60 cm. The Garwood Valley soils studied here (Garwood Valley, Garwood Till, G24 and G25) include the highest D member of group I (G25) and group II/III soils. This thermal response to wetting is consistent with the potential for long-term preservation of buried ice under dry conditions (low to moderate thermal diffusivity), but indicates that the soils can become efficient thermal conductors and potentially drive rapid melting and landscape change when the soils are wetted. This is precisely the soil moisture scenario occurring in central Garwood Valley, where exposure of buried ice is resulting in wetting of overlying sediments and rapid thermokarst erosion of remnant Ross Sea Drift ice-cored till at rates up to approximately ten times the average Holocene rate (Levy et al. Reference Levy, Fountain, Dickson, Head, Okal, Marchant and Watters2013b, Dickson et al. Reference Dickson, Levy and Head2015). This mixed potential for ground ice preservation by tills of intermediate thermal diffusivity is similar to that observed in western Taylor Valley/Pearse Valley, where Bonney Till (similar texturally to our sample 010315-1) has preserved ice-cored moraines from alpine glaciers for up to 130 ka (Swanger et al. Reference Swanger, Marchant, Kowalewski and Head2010). However, the presence of water tracks emanating from these moraines and gelifluction lobes indicates a potential transition to wetted soil conditions and future ground ice melting.
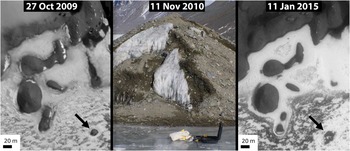
At the local scale, some of the most rapid ice loss and landscape change associated with melting can be observed in association with small sediment and ice deposits, such as the Kelly’s Island sediments (one of the highest diffusivity members of group IV) (Fig. 7). Kelly’s Island was an ice-cored mound located on Lake Hoare in Taylor Valley. It was composed of sandy and cobble-rich sediments overlying a lake ice core. Kelly’s Island was clearly visible in 2009 as a contiguous, convex-up mound of dry till material overlying lake ice. However, by the subsequent year, rapid melting and ablation of the ice core had resulted in removal of sediments by melting and sloughing, resulting in exposure of the underlying ice. Even though the sediment cover was several tens of centimetres thick (Fig. 7), it was insufficient to insulate the ice core from seasonal warming, resulting in complete destruction of the ~2–3 m tall island and flow of the overlying sediment cover by meltwater runoff into an annulus surrounding the former island location by 2015 (Fig. 7).
Sequence of ground-based and satellite images showing the destruction of Kelly’s Island (arrow) as the ice core melted out and the sediments were dispersed. Soil samples were collected in 2010 from dry soils (light-toned in the centre panel) near to dark (wet) disturbed soils. The KD2 Pro thermal properties analyser can be seen in the centre panel. By 2015, the ‘island’ had melted, forming an annulus of sediment around the mound’s former location (arrow).

In contrast to these rapid ice loss scenarios associated with wetted sediments, some locations in the MDV such as Beacon Valley show evidence of long-term preservation of buried ice (up to 8 Ma) (Marchant et al. Reference Marchant, Lewis, Phillips, Moore, Souchez, Denton, Sugden, Potter and Landis2002). What is striking about the Beacon Valley sediments is that they are group IV soils, with some of the highest thermal diffusivities measured by this study. They are also extremely sensitive to wetting, with D values climbing from 0.22 mm2 s-1 at 1% gravimetric water content (GWC) to 0.62 mm2 s-1 at 5% GWC and 0.74 mm2 s-1 at 10% GWC. Despite this potential for large changes in thermal diffusivity in response to small amounts of wetting and the potential for deep thaw under wetted conditions, Beacon Valley soils show little to no evidence of wetting beneath a surface (snow melt influenced) oxidized horizon (Marchant et al. Reference Marchant, Lewis, Phillips, Moore, Souchez, Denton, Sugden, Potter and Landis2002). Accordingly, the presence of ancient buried ice in Beacon Valley despite the unusually high thermal diffusivity of the soil overlying it, suggests that Beacon Valley has remained extremely cold and dry (e.g. little to no active layer formation) since at least the era when the ice was emplaced.
Potential landscape feedbacks
Beyond these specific examples of differential thaw rates that correlate with different soil responses to wetting, these results raise the surprising suggestion that aeolian and/or geological ‘legacy’ processes (Lyons et al. Reference Lyons, Fountain, Doran, Priscu, Neumann and Welch2000) may be shaping the stability of Antarctic permafrost at the landscape scale. The lowest thermal diffusivity soils measured in this study (groups I and II) are overwhelmingly fines-rich. These soils are from isolated and patchy fields of ‘fluff’ collected from beneath a pebble and cobble desert pavement. They are derived from either aeolian inflation of the desert pavements (Bockheim Reference Bockheim2010) or reworking of palaeolake lacustrine silts. In the former case, it suggests that the preservation of knobby, ice-cemented terrain, which acts as a baffle enhancing sediment deposition to leeward (Šabacká et al. Reference Šabacká, Priscu, Basagic, Fountain, Wall, Virginia and Greenwood2012), may be decreasing the thermal diffusivity of ice-poor, subsided surfaces down-wind, helping arrest the rate of ice loss and subsidence by building up low diffusivity silts. In the latter case, the sedimentological legacy (Lyons et al. Reference Lyons, Fountain, Doran, Priscu, Neumann and Welch2000) of Pleistocene and Holocene palaeolakes may be shaping modern patterns of permafrost stability and melt by influencing the fluvial and aeolian distribution of fine-grained sediments.
Both sedimentary processes are likely to be important and can share a common insulating mechanism. Field and laboratory observations of these fines-rich soils indicate that they are extremely hygroscopic (Levy et al. Reference Levy, Fountain, Welch and Lyons2012) and may limit the increase in soil thermal diffusivity in response to wetting by concentrating water in osmotic- or matric potential-driven blobs or blebs. We hypothesize that this increase in heterogeneity could reduce the connectivity of high diffusivity pockets of soil, possibly reducing the soil’s overall ability to conduct heat by surrounding wet, high diffusivity pockets with dry, low diffusivity matrix.
Conclusions
The thermal properties of MDV soils are highly heterogeneous and vary spatially as a function of silt content, bulk density and geological origin; even within soil great groups (Haploturbels and Anhyorthels). Soil thermal diffusivity varies by a factor of eight across the measured MDV soils over soil moisture ranges from 0–20% by weight. This can result in an ~2-fold difference in the predicted maximum thaw depth of MDV soils, depending on their composition and moisture content. Our measurements suggest that melting of Pleistocene (or older) ground ice in the MDV may accelerate in the future as a result of a thermal diffusivity positive feedback in which soils wetted by melting ground ice or buried ice exhibit increased thermal diffusivity, further allowing surface heating to melt underlying permafrost.
Acknowledgements
This work was supported by NSF awards PLR-134385 and PLR-1245749 to JSL. Many thanks to the MCM-LTER for access to met station observations (www.mcm-lter.org), and to Andrew Fountain and Maciej Obryk for helpful conversations. Thanks as well to reviewer Chris McKay and an anonymous reviewer.
Author contribution
Levy designed the experiment and conducted sample collection, interpretation and analysis. Schmidt conducted lab work, figure preparation, data analysis and supporting fieldwork.
Supplementary Material
Supplemental figures, a table and data will be found at http://dx.doi.org/10.1017/S0954102016000201.