Attacking multiculturalism has become a political cliché. In October 2010, when German Chancellor Angela Merkel proclaimed that a multicultural approach had “utterly failed” in Germany, she was echoing a commonly-heard sentiment across Western Europe.Footnote 1 British Prime Minister David Cameron, in February 2011, indicted his country's decades-old policy of state multiculturalism for failing to promote a sense of common identity, and for encouraging Muslim segregation and radicalization.Footnote 2 In 2008, the Council of Europe concluded that multiculturalism has been at least as harmful as the assimilation approach it replaced, while a recent UNESCO World Report on Cultural Diversity takes for granted a new “post-multicultural” age.Footnote 3 Even in Canada, long-identified as a holdout in the backlash against multiculturalism,Footnote 4 resistance to “reasonable accommodation” for immigrants' cultural rights has flared up in response to the proposed use of shari'a law during arbitration and the right to wear the niqab when dealing with government officials. The turn away from multiculturalism and toward a more assimilationist discourse, already noted by academics at the turn of the millenniumFootnote 5 has become a full-fledged battle cry, driving the political success of anti-immigrant politicians like Geert Wilders in the Netherlands and the Sverigedemokraterna party in Sweden.
This juxtaposition—between integration and national attachment on one hand, and multiculturalism on the other—implies that there is a zero-sum trade-off between the two. Such a view is reflected in fears that immigrants and minorities live “parallel lives” due to residential segregation, unemployment, lack of national identity, inadequate community cohesion, and a rejection of common citizenship, a situation encouraged and aggravated by multiculturalism.Footnote 6 Yet the arguments advanced by political theorists who defend a multicultural model posit the exact opposite: by recognizing and accommodating minority cultures, members of those communities will feel increased connection to and engagement in the broader polity.Footnote 7
Here, we investigate the socio-political aspects of integration and ask: do policies of pluralism and diversity undermine immigrants' sense of common membership in their adoptive nation and its people? As we will argue, political theorists of multiculturalism make strong claims about common membership and political community, but not about socio-economic integration. We consequently concentrate on the former, asking whether immigrants identify with their adoptive nation, its people, and its political institutions. We focus on foreign-born residents since much of the backlash against multiculturalism has been expressed, politically, in anti-immigrant politics.Footnote 8 Concerns about the maladaptive consequences of multiculturalism also encompass second and later generation minorities, as concerns about “home-grown” terrorists and disaffected urban youth clearly show. It is usually assumed, however, that such problems arise from integration problems in the immigrant generation, including immigrant parents' detachment from their country of residence.Footnote 9
The question of whether multiculturalism undermines socio-political integration has, perhaps surprisingly, received limited empirical evaluation. As we outline below, much of the concern over multiculturalism is speculative. The empirical work that does exist focuses on the effects of multiculturalism on native-born populations,Footnote 10 or investigates its effect on immigrants' socio-economic and socio-cultural incorporation.Footnote 11 Among studies that do look at socio-political integration or citizenship, most focus on one or a few countriesFootnote 12 or present a series of case studies.Footnote 13 This makes it difficult to evaluate broadly the policy effects of multiculturalism.
We offer several contributions. First, we bring empirical evidence to bear on the question, debated by political theorists, comparative social scientists, and politicians, of whether multiculturalism undermines common membership, as measured by immigrants' expressed levels of trust in others and sense of discrimination, their political interest and participation, and their faith in the political system. Our results, across a wide range of outcomes, speak to the crux of whether policies of minority recognition isolate or integrate foreign-born residents into the civic and political life of their adopted country.
Second, we add to the growing field of immigrant political incorporation by going beyond the existing attention to either the individual-level determinants driving immigrants' attitudes and behaviors (such as socio-economic and national origin effects) or macro-structural factors (such as labor markets and political party structures). Instead, we focus on policy regimes, namely, government initiatives that can be characterized as multicultural and citizenship law. A policy approach offers an expanded analytical focus and, from a practical viewpoint—for those concerned about immigrant incorporation—policy levers are easier to change than individuals' attributes or the structural features of national societies.
Finally, the relative absence of broad comparative research on immigrant political integration often hinged on serious empirical limitations: above all, most major cross-national surveys count only a handful of foreign-born respondents. This situation is changing, especially due to the release of new, large-scale European surveys.Footnote 14 As we outline below, however, there are important analytical benefits to including the traditional Anglo-settler immigrant countries in such analyses. We consequently supplement our comparative analysis of Europe with data from the United States and Canada. This expands the number of cases and adds more variation in the type of policy regimes considered. It also provides some empirical evidence to adjudicate between a nascent debate on whether immigrants' socio-political incorporation will proceed more rapidly and successfully in Europe or North America.
Theory and Literature: Debates over Policy Regimes and Immigrant Incorporation
The word “multiculturalism” appears in many guises. It can be used in a purely descriptive sense, as a label for demographic diversity associated with a mouth-watering array of food metaphors. It can also be invoked as a set of best (or worst) practices or viewed as an ideology. Here, we mainly use it to reference specific government policies designed to positively recognize diversity and help minorities maintain cultural and religious practices while integrating them into public life. As we outline later, such policies include the public funding of cultural maintenance efforts, exemptions from certain laws and regulations that might disadvantage minority groups, and anti-racism legislation that recognizes diversity and takes affirmative steps to overcome discrimination. Multiculturalism as policy is usually intertwined with multiculturalism as a political ideology, but it need not be.Footnote 15
To say that the effect of multiculturalism on integration has been contested is to put the matter mildly. The academic debate, though more reasoned than the political one, can be equally fierce. Political theorists of multiculturalism, drawing on a variety of philosophical traditions, argue that minorities, by definition, are placed in a position of cultural inequality vis-à-vis majority society, so that providing immigrants with citizenship alone is insufficient for inclusion.Footnote 16 Countries should consequently recognize and accommodate minorities' cultural beliefs and practices.Footnote 17 It is assumed that by fostering minorities' sense of legitimate membership through norms and policy, and by encouraging minorities to adopt hyphenated or nested identities, multiculturalism attenuates potential problems posed by pluralism.Footnote 18 Indeed, the failure to adopt multiculturalism, according to this line of reasoning, might alienate minorities from their adoptive nation's political life.
Criticisms of this argument are many and varied. A key objection is that multiculturalism imperils the common sense of “we” that is critical for a modern society to function smoothly. Thus, policies promoting ethnic pluralism undermine the state's ability to create a sense of common purposeFootnote 19 and jeopardize guarantees of individuals' equal status, both of which are necessary to foster trust and reciprocity.Footnote 20 Trust and reciprocity, in turn, undergird people's willingness to contribute to the public good, for example, through civic engagement and voluntarismFootnote 21 or by supporting the redistributive welfare state.Footnote 22 Such arguments feed into an increasingly voluminous empirical scholarship examining the extent to which ethnic diversity, especially through immigration, imperils effective democratic governance by reducing social capital, increasing support for far-right parties, and encouraging more ethnocentric notions of membership.Footnote 23 A different theoretical tradition, social identity theory, suggests that multiculturalism may impede the formation of “superordinate” identities by officially sanctioning the boundaries between groups in society and elevating their salience.Footnote 24 If this is the case, then policies promoting cultural recognition may discourage immigrants' sense of identification with and loyalty to their adoptive nation.
Empirical evidence on the issue is mixed. For example, Wright finds some evidence that citizens in more multicultural nations have moved to embrace more ascriptive—and exclusionary—conceptions of their national community over time, relative to those in less multicultural contexts.Footnote 25 In contrast, Kesler and Bloemraad find that in more multicultural countries, the general population is less likely to report declines in trust, organizational membership, and political participation in the context of ongoing immigration than populations in non-multicultural nations.Footnote 26 However, these studies primarily evaluate the effects of multiculturalism on native populations. It is possible—even plausible—that policies meant to address cultural inequalities could be beneficial to minorities while generating a backlash among the majority.Footnote 27
The empirical research that does focus on immigrants has concentrated on whether multicultural policies hinder immigrants' social and economic integration, such as labor market outcomes, educational attainment, residential segregation and language ability. While the concern with socio-economic integration is understandable, the links to multiculturalism are fuzzy.Footnote 28 As Bloemraad outlines, the philosophical and theoretical arguments for multiculturalism's integrative effect rest primarily on socio-political inclusion, not labor market outcomes or educational attainment.Footnote 29 The mechanisms behind such socio-political integration can be psychological—public recognition of diversity provides a sense of membershipFootnote 30—and it can be behavioral: the group-based identities and mobilization encouraged by multiculturalism, when advanced in a context of open citizenship, can facilitate collective action and political participation.Footnote 31 Bloemraad provides some evidence consistent with the argument, noting that levels of citizenship acquisition and minorities' election to office tend to be higher in multicultural societies.Footnote 32 Data from a five-country study by Koopmans and his colleagues also suggest that immigrants' citizenship and claims-making is rooted more strongly in domestic politics in countries that are more civic and multicultural compared to more ethnic, monocultural states.Footnote 33 Both studies, however, rely on a limited number of cases and are suggestive but not conclusive, especially given the strong political and academic arguments for why multiculturalism undermines common membership.
Citizenship policy is also a critical component of any study assessing immigrants' sense of membership in their adoptive nation. By “citizenship policy,” we refer primarily to the ease with which immigrants gain legal, formal access to citizenship.Footnote 34 Despite moves to decouple some rights from formal citizenship status, it remains necessary for many key electoral activities in most countries, it is usually the ultimate guarantee of rights and liberties, and it implies membership in a national political community.Footnote 35
Policies governing citizenship have been an enduring focus of research on immigrants' political inclusion. Initially, scholars examined how notions of nationhood or philosophies of integration affected laws of citizenship acquisition and naturalization outcomes. Thus, political notions of civic or republican citizenship facilitated inclusive citizenship based on territorial birth (jus soli) in France, ethnic notions of nationhood produced citizenship laws that privileged blood-based ties (jus sanguinis) in Germany, while in Great Britain, citizenship was not just “civic” but also concerned with race relations.Footnote 36 Subsequent scholarship has reacted against such path-dependent accounts, directing attention to party politics, public opinion, and the consequences of elections for citizenship lawFootnote 37 and for civic integration policies.Footnote 38 The change in focus reflects, in part, the fact that many European countries have liberalized their citizenship laws over the past three decades.Footnote 39
For our purposes, we are agnostic on the roots of citizenship policy, but we take it into account to better identify the potential effects of multiculturalism policy on our measures of socio-political integration. Presumably, inclusive citizenship policies communicate a more open national membership, which should increase immigrants' sense of socio-political inclusion. In T.H. Marshall's influential formulation, the extension of civil, political, and social rights within the framework of citizenship generates inclusion and social solidarity in societies with market-based economic inequality.Footnote 40 While Marshall did not consider the case of immigrants, from this perspective the failure to accord equal citizenship to immigrants should impinge on their sense of identification with the adoptive nation.Footnote 41
Interestingly, some recent studies challenge a narrow application of this assumption. Maxwell finds no statistically significant difference in trust in parliament or satisfaction with government between first and second generation migrants who hold citizenship and those who do not,Footnote 42 and Ersanilli and Koopmans report that Turks surveyed in France and the Netherlands—both countries of relatively open citizenship—express higher identification with their host country than those in Germany, regardless of naturalization status.Footnote 43 Yet on aggregate, there is a strong statistical relationship between citizenship acquisition and the openness of nationality laws.Footnote 44 This suggests that all immigrants, regardless of citizenship status, feel more welcomed in countries with inclusive citizenship laws. Law and policy on citizenship (or multiculturalism) may provide symbolic legitimacy and a general sense of membership.Footnote 45
Germane to our analysis, from a conceptual and methodological perspective, countries with limited recognition of cultural pluralism cannot be lumped together; they must be distinguished by their approach to legal citizenship. Some non-multicultural countries erect low barriers to formal citizenship by making naturalization relatively easy and the acquisition of citizenship through territorial birth straightforward while other non-multicultural countries erect high barriers to political membership. Indeed, while some critics of multiculturalism policies might prefer assimilatory and ethno-national notions of membership, many others embrace an integrative, civic citizenship, but one stripped of cultural pluralism and accommodation.Footnote 46 A simple comparison of multicultural and non-multicultural countries is problematic, therefore, since we must be attentive to the possibility that liberal access to citizenship, absent multiculturalism, can generate a heightened sense of political equality and “belonging,” in the Marshallian sense, and along the lines of republican civic inclusion.
Data and Measures
Policy Regimes and Country Cases
Policies on citizenship and cultural pluralism are two distinct axes that could influence immigrants' socio-political incorporation.Footnote 47 Citizenship fundamentally delineates who belongs and who is excluded from membership in the polity. To measure citizenship access, we employ the “CPI” index of citizenship access developed by Howard, which aggregates the following three factors by country as of 2008: whether or not a country grants jus soli citizenship, the minimum years of residency required for naturalization, and whether or not naturalized immigrants are allowed to hold dual citizenship.Footnote 48
To capture policy support for cultural pluralism, we build on the comprehensive efforts to measure political multiculturalism undertaken by Banting and colleagues.Footnote 49 They construct a country-level score of immigrants' “polyethnic rights” by assigning, for each of eight policy areas, one point if a country fully adopted and implemented a measure in the year 2000, half a point if it had done so in a token manner, and zero if it had done nothing. We use seven of these measures: official affirmation of multiculturalism; multiculturalism in the school curriculum; inclusion of ethnic representation/sensitivity in public media and licensing; exemptions from dress codes for minorities; funding of ethnic organizations to support cultural activities; funding of bilingual and mother-tongue instruction; and affirmative action for disadvantaged immigrant groups.Footnote 50 Although multiculturalism doubtlessly varies in other ways, these measures are useful for capturing broad, cross-national differences and have been employed effectively in other studies.Footnote 51 Typically, we see a high degree of overlap between a country's stated multicultural ideology and its policy framework, but in some cases multicultural policies evolve without a national declarative statement, as in the United States. The multicultural index we employ includes six policy dimensions and one item scoring a country's official affirmation of multiculturalism as an important principle of society and government.
To arrive at a suitable typology incorporating both citizenship and multicultural policy, we plot each country's score in two-dimensional space (refer to Figure 1) in a manner similar to Koopmans, et al.Footnote 52 Even a cursory glance at this plot shows countries sorted neatly into three categories: low citizenship access/low MC (hereafter “LL”); high citizenship access/low multiculturalism (hereafter “HL”); and high citizenship access/high multiculturalism (hereafter “HH”). This clearly supports the basic conceptual distinction between citizenship and multiculturalism.
Typology of countries by citizenship access and multiculturalism
Sources: CPI (scored 0 = least liberal to 6 = most liberal) from Howard 2009. For countries where scores were unavailable (Canada, the US, Norway, and Switzerland) they were calculated using his methodology. MCP (scored from 0 = weakest to 7 = strongest) is a recently updated measure from Banting et al Reference Banting, Johnston, Kymlicka, Soroka, Banting and Kymlicka2006. The policies coded in the multiculturalism index are as follows: official affirmation of multiculturalism; multiculturalism in the school curriculum; inclusion of ethnic representation/sensitivity in public media and licensing; exemptions from dress codes; funding of ethnic organizations to support cultural activities; funding of bilingual and mother-tongue instruction; and affirmative action for immigrant groups.

A key contribution of this article is to supplement large-n cross-national analysis with a closer look at two traditional “Anglo-settler” countries of immigration, the United States and Canada. Both are highly diverse immigrant nations originally colonies under the British crown, and both offer liberal access to citizenship. Both have attained a high level of economic development, and, in terms of redistribution, each falls under the “liberal” category in Esping-Andersen's original typology of welfare regimes.Footnote 53 Their most relevant difference—for present purposes—is in how they approach multiculturalism. Canada is substantially more “multicultural” in the political sense than the United States.Footnote 54 Indeed, Canada scores significantly higher on the multiculturalism index (as of 2000) than any other country included in this analysis. Given critics' concern that multiculturalism undermines solidarity, common identity, and socio-political integration, the inclusion of highly multicultural Canada allows us to push the logic of the argument further than a narrower analysis of more limited variation in the European context.Footnote 55
Including the United States and Canada also allows us to speak—albeit tentatively—to recent speculation regarding trans-Atlantic differences in immigrant incorporation. Some commentators have suggested that despite the deep-seated legacies of slavery and race-based citizenship laws in the United States, the United States will face fewer problems incorporating immigrants into the polity, in part because of its relatively liberal access to citizenship and a discursive opportunity structure that valorizes immigration.Footnote 56 Yet some European countries also have liberal citizenship laws, and other scholars question the importance of citizenship given the extension of rights and equality guarantees to noncitizens, a process that has gone further in the member nations of the European Union than in the United States.Footnote 57 It is thus unclear whether the United States (or Canada) will be significantly better placed when it comes to immigrants' political incorporation than European countries.
Survey Data on Immigrants' Attitudes and Activities
The large-scale comparative study of immigrant political opinion and activities has, until recently, been hobbled by the lack of high-quality comparable survey data. Fortunately, a number of recent data collection efforts begin to address this problem. Our primary dataset is the four-wave cumulative file of the European Social Survey (2002–2008), which contains several relevant outcome measures and a large number of foreign-born respondents in each country. To this dataset we add US respondents, surveyed in 2005 as part of the Citizenship, Involvement, Democracy survey,Footnote 58 since much of the questionnaire was designed to replicate the ESS.
We further supplement our analysis with several additional surveys of residents living in the United States and Canada. Three criteria guided our selection of additional surveys: a large enough foreign-born sample to ensure sufficient precision in estimation; attitudinal outcome measures that are both relevant and comparable across countries; and the ability to employ the same suite of individual-level controls we use with the ESS. On the American side, we focus our attention on two national surveys fielded in 2006—the Social Capital Benchmark Footnote 59 and the Faith Matters Survey Footnote 60—which we merge where measures allow. The combined dataset contains nearly 6,000 total respondents, with over 600 of them foreign-born. On the Canadian side, we employ a dataset merging both waves of the Equality, Security, Community Survey, Footnote 61 which yields a total sample of nearly 11,000 and a foreign-born sample of roughly 2,500. Finally, we employ the Canadian Ethnic Diversity Survey, Footnote 62 fielded in 2002 (47,000 total respondents and more than 10,000 foreign-born).Footnote 63
Drawing on these surveys, we examine immigrants' attitudes about and participation in their adoptive nation in three broad areas. The first of these centers on feelings of social inclusion, which includes positive identification with “most people” captured by standard measures of social trust; the ESS's measure of whether or not the respondent perceives discrimination in the country against his or her group along ethnic, racial, linguistic, or religious lines; and, in a US–Canada analysis, the importance of ethnicity and nation in giving respondents a sense of who they are. The second dimension focuses on immigrants' sense of political inclusion. In this vein, we examine measures of political trust, satisfaction with the national government, and the sense that “politicians care about people like me.” The final dimension concerns immigrants' political integration, tapped by self-expressed political interest as well as the extent to which the respondent has participated in the nation's political life.
Analytic Approach
Engagement in the political system is to a substantial degree the product of individual-level factors related to demographics (such as age, race, and gender) as well as “human capital”-related determinants (such as education).Footnote 64 There is some evidence that some of these are weaker predictors of political behavior for immigrants,Footnote 65 but the direction of measured effects remains similar to more general models. For immigrant populations, we must also take into account whether or not people have citizenship, which confers not only political rights but also a sense of duty that may spur greater engagement in political life,Footnote 66 and length of residence in the host country, since time in a country increases familiarity with the political system, integration into local social networks, and the sense of having a “stake” in the system.Footnote 67
Because socio-economic characteristics matter, the unique demographic profile of each nation's immigrant population complicates cross-national comparisons. Our interest lies not with individual-level predictors of socio-political engagement, but with the effect of policy context on immigrants' attitudes and engagement once individual-level predictors have been controlled.Footnote 68 Our survey respondents are nested by country, suggesting multi-level regression analysis as an appropriate technique.Footnote 69 However, in the present context, that approach is problematic. First, our analysis is based on only a limited selection of countries, which does not ensure that the asymptotic properties of the typical maximum-likelihood estimator will “kick in” at the context level.Footnote 70 Furthermore, our selection of countries is not random, which makes traditional interpretations of t- and p-statistics associated with country-level effects problematic. Accordingly, we estimate “regime-level” effects using a variation on the two-step visualization technique suggested by Bowers and Drake.Footnote 71 Our analysis compares the intercept values produced when outcomes are regressed on the predictors in a baseline individual-level model pooled within each policy regime category. Given the way the individual-level predictors are coded, what this amounts to is estimating, for each policy regime category, predicted outcomes for a hypothetical immigrant who is a visible ethnic minority member, has been in the country for between five and ten years, lacks citizenship, is less-educated, young, and has a history of unemployment.Footnote 72 Whenever we refer to immigrant “intercept” scores, we refer to these estimates. Given the political debate over multiculturalism, we believe that it is precisely this sort of immigrant who is at the heart of integration concerns. Our estimator in these equations depends upon the nature of the dependent variable: dichotomous measures employ logistic regression, whereas all other measures (which have four or more response values) are estimated using Ordinary Least Squares.
An important conceptual and methodological challenge in immigrant integration research is establishing a reference point.Footnote 73 Different analytical strategies speak to distinct theoretical interests. We consequently employ two comparisons: one that directly compares predicted values for our hypothetical immigrant across country-level policy categories, and a second that compares country-level gaps between immigrant and native-born means across our policy categories.
The first comparison offers important parsimony: on the whole, do immigrants do better in some policy contexts than others? This type of analysis is useful not only for its simplicity, but also because the outcome measures we assess can be seen as “goods” in and of themselves. Normatively, higher levels of social and political trust and political engagement and lower levels of perceived discrimination are presumably good for immigrants, as well as native populations and the receiving polity.
At the same time, the concept of “integration” connotes movement toward some attitude or behavior consonant with the mainstream position in the host country. Immigrants in France, for example, may evince lower faith in politicians compared to immigrants in other countries precisely because they are integrating into a mainstream population that tends to be distrusting. While theoretically it is not self-evident that the policy effects we analyze should be predicated on natives—especially given that multiculturalism is generally thought to shape native as well as immigrant attitudes, perhaps in opposite directions—the issue of whether immigrants are more “integrated” with respect to the native population is certainly worthy of close examination. While theoretically it is not self-evident that the policy effects we analyze should be predicated on natives—especially given that multiculturalism is generally thought to shape native as well as immigrant attitudes, perhaps in opposite directions—the issue of whether immigrants are more “integrated” with respect to the native population is certainly worthy of close examination.
Our second and complementary analytical approach consequently takes natives' mean scores on our outcomes as “anchor points” to discern how much immigrants differ from the native-born majority.Footnote 74 In the large-n European Social Survey/Community, Involvement Democracy Survey ESS/CID analysis, the outcome variables become the individual-level difference between a given immigrant's score on the measure of interest and the overall mean among native-born respondents in his or her country. In the smaller-scale country comparisons, we observe immigrant means and intercept estimates alongside the mean values estimated for native-born populations in each country. Throughout, our reference point in the “gap analyses” is immigrant scores with respect to the mainstream population within their country (as opposed to, say, within all countries of a specific policy regime). Thus, we are considering gaps between immigrants and their native-born counterparts to assess the “effect” of policy regime, holding constant what some might call “national political culture.”
Country-Level Analysis and Discussion
Social Inclusion: Social Trust, Perceived Discrimination, and Identity
Figure 2 examines the mean intercept values on both generalized trust and perceived discrimination in the merged ESS/CID sample, broken down by the typology presented in figure 1. Here and throughout, detailed information about variable construction is presented in the notes to the figures. In the top panel of each graph, we depict immigrant scores in absolute levels on the outcome measure; in the bottom panel, we depict them relative to native respondents' mean scores within a country. The difference between the top and bottom panels lies in the outcome measure: in the former case, it is individual-level immigrant responses on the measure of interest; in the latter, it is the individual-level difference between a given immigrant's expressed attitude and the native-born mean in his or her adoptive country. This amounts to the difference between asking “how trusting is a hypothetical immigrant to Germany” and “how trusting is the same hypothetical immigrant to Germany compared to the average native-born German?”
Incorporation regime and generalized trust/perceived discrimination
Notes: Plots represent intercept values when the outcome is regressed within policy category on individual level predictors (see footnote #11 for details). Generalized Trust is a 3-item scale scored from 0 = lowest to 1 = highest. Perceived Discrimination is a dichotomous indicator toggled “1” if a respondent perceives discrimination against his or her group in the country along either racial, ethnic, linguistic, religious, or national lines. For the former, the estimator is OLS regression; for the latter, it is logistic regression. Standard errors are corrected for clustering by country. For perceived discrimination, rather than “Gaps w/Natives,” the bottom panel depicts the predicted probability of perceiving discrimination when all covariates are set at 0. Samples include only foreign-born respondents, though “Gap” scores are estimated via native samples. Analyses are weighted by ESS Design Weight.
Source: ESS 4-Wave Cumulative plus US CID Survey.

The top panel of Figure 2 shows that immigrants trust slightly more on average in HL countries than they do in LL countries in absolute terms, and that those in HH countries tend to trust the most of all. That said, an eye on the 95 percent confidence intervals indicates that the only difference that approaches statistical significance is that between the first and last of these categories.Footnote 75 These slight differences disappear altogether when the dependent measure becomes immigrants' distance from the mainstream population (bottom panel).
Stronger differences are visible on the perceived discrimination measure. Both liberal citizenship access and political multiculturalism appear to have a positive influence here, and we note a monotonic decrease from LL through HL, and ultimately to HH. This corresponds to predicted probabilities of perceiving discrimination at 54 percent, 40 percent, and 35 percent, respectively, for our hypothetical immigrant (refer to note Footnote 16). Thus, while the large confidence intervals around these estimates demand caution in interpretation, it does appear in general that immigrants perceive less discrimination in countries with more liberal citizenship policies and the least discrimination in countries that offer both liberal citizenship and political multiculturalism.
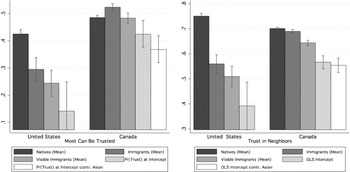
While the US/Canada surveys lack comparable measures of perceived discrimination, we can use them to analyze social trust in two respects: the extent to which a respondent agrees that “most people can be trusted” and the extent to which they trust their neighbors. Figure 3 plots several values for each country: means among the native-born; means for all immigrants; means for immigrants who are a visible minority; and either the probability that our hypothetical immigrant trusts (since the generalized trust measure is dichotomous) or the OLS intercept for trust in neighbors (since it is a four-category ordinal measure).Footnote 76 Both are estimated through immigrants-only regressions. On both outcomes, the picture is unambiguous: while there are small differences in natives' willingness to trust “most people” or their neighbors across the two countries, immigrants express much higher levels of trust in Canada than they do in the United States. The story is the same whether the comparison is “all immigrants,” “visible minority immigrants,” or the estimated probability of trusting/OLS intercept when citizenship, nonminority status, gender, education, age, and income are held at zero. It even holds true if we leverage the EDS's huge immigrant sample to control for Asian origin, an oft-claimed source of “Canadian exceptionalism,” along with the “points system,” that favors immigrants who are better off in socio-economic terms. Including a regressor tapping Asian origin along with the other socio-economic controls attenuates predicted probability/OLS intercepts somewhat, but the cross-national differences remain stark.
Social trust in the US and Canada by immigrant category
Notes: Generalized Trust is a dichotomous indicator score 0 = “Can”t be too careful” and 1 = “Most can be trusted.” Trust in Neighbors is a single 4-category indicator scored from 0 = “Not at all” to 1 = “A lot.” “(Mean)” bars in both panels depict mean values for the indicated subgroup. For the former, “Intercept” bars indicate the predicted probability of expressing trust from an immigrants-only logistic regression model, with citizenship and non-minority status, two-category length of residence, gender, age, education, and household income all held at “0”. For the latter, “Intercept” bars indicate the constant from an immigrants-only OLS regression containing the same covariates. Red caps depict 95 percent confidence intervals. Analyses are weighted.
Sources: Combined SCB Benchmark 2006/Faith Matters 2006; EDS 2002.

One of the most vocal complaints made about multiculturalism, in the normative literature on the subject and in political practice, is that it encourages a heightened awareness of immigrants' ethnic identity at the expense of their allegiance to their adoptive nation. While the ESS lacks good measures of ethnic and political identity, we can address this question in a more limited way by looking at how important respondents claim their ethnicity and nation are to their sense of “who they are,” using US and Canadian data. In Figure 4, we adopt an approach similar to Figure 3, though turning to the ECS survey means that we can no longer control for Asian origin without sacrificing much-needed precision.
Importance of ethnicity and nation, US and Canada
Notes: Each outcome is a single item tapping how important—on a four-category scale re-scored from 0 = “not at all” to 1 = “very important”—the item is to defining “who you are.” “(Mean)” bars in both panels depict mean values for the indicated subgroup. “Intercept” bars indicate the constant from an immigrants-only OLS regression including citizenship and non-minority status, five-category length of residence, gender, age, education, and household income. Red caps depict 95 percent confidence intervals. Analyses are weighted.
Sources: Combined SCB Benchmark 2006/Faith Matters 2006; ESC 2000/2003.

As posited, the salience of ethnicity appears higher in more multicultural Canada across the board, even among native Canadians. What is more, while the introduction of statistical controls in the immigrant samples appears to decrease ethnic identity in the United States, the opposite is true in Canada: minority immigrants of low socio-economic status are roughly 50 percent more likely to claim a strong role for ethnicity than their counterparts in the United States. On the other hand, the salience of ethnic identity does not appear to come at the cost of devotion to Canada—on that dimension, scores across categories and countries are largely comparable; if anything, Canadian immigrants (overall, and visible-minority immigrants specifically) appear to attach a greater importance to Canada than their counterparts do to the United States, though this difference vanishes once socio-economic factors are taken into account.
Political Inclusion: Trust in Government, Satisfaction with the National Political System
Measures of social inclusion, such as trust, identity and discrimination tapped above, evaluate whether the presumed social fragmentation brought on by multiculturalism lies in the lack of inter-personal cohesion. In a related vein, critiques of multiculturalism also suggest that recognizing pluralism undermines civic cohesion and common citizenship. We examine this possibility through measures of political inclusion, namely reports of political trust and satisfaction with the political system. Figure 5 explores a 2-item additive index of immigrants' trust in the national legislature and in politicians, by policy context. Whether we consider absolute levels (top panel) or immigrant-native born gaps (bottom), political trust among immigrants is higher in HH countries than it is anywhere else, although the statistical significance of the difference is less evident in the “gap” analysis than it is with respect to absolute levels. Furthermore, the difference between LL and HL is essentially nil either way, indicating that whatever differences do exist are not likely to result from differences in citizenship regime alone.
Incorporation regime and political trust
Notes: Plots represent intercept values when the outcome is regressed within policy category on individual level predictors (refer to note Footnote 11 for details). Political Trust is a two-item additive index comprising trust in national legislature and trust in country”s politicians, scored from 0 = “Lowest” to 1 = “Highest.” Estimator is OLS regression. Standard errors are corrected for clustering by country. Samples include only foreign-born respondents, though “Gap” scores are estimated via native samples. Analyses are weighted by ESS Design Weight.
Source: ESS 4-Wave Cumulative plus US CID Survey.

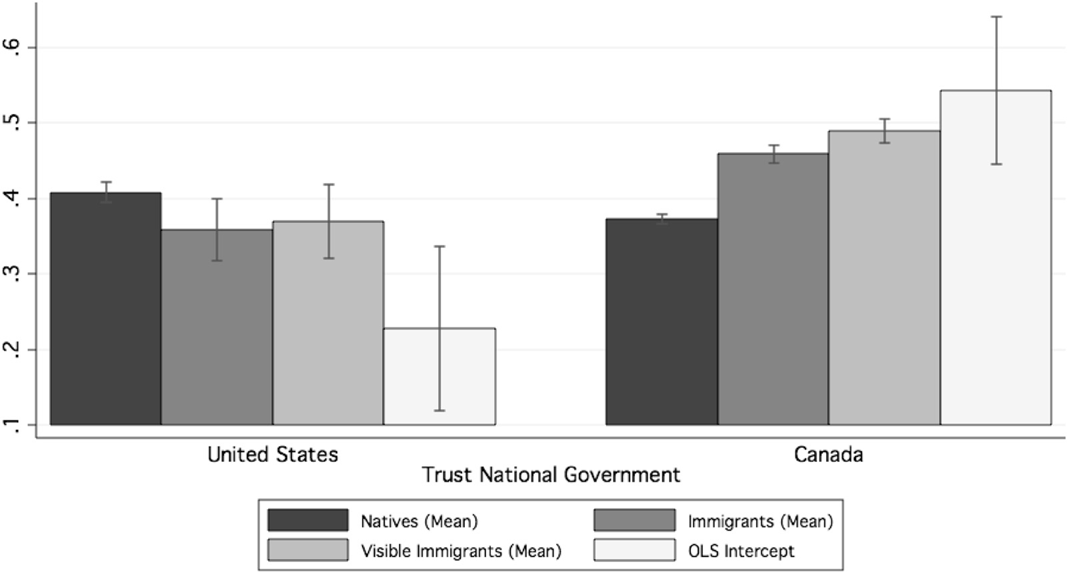
Data from Canada and the United States (Figure 6) also appear to paint a complementary picture: in these datasets, whether we care more about absolute levels or comparisons with natives (who evince more-or-less identical levels across countries), political trust scores are substantially higher in Canada than the United States, and this distinction only strengthens with the addition of socio-economic controls.
Trust in national government, US and Canada
Notes: Outcome is a single four-category item tapping how often a respondent trusts national government to “do what is right,” re-scored from 0 = “hardly ever” to 1 = “Just about always.” “(Mean)” bars in both panels depict mean values for the indicated subgroup. “Intercept” bars indicate the constant from an immigrants-only OLS regression including citizenship and non-minority status, five-category length of residence, gender, age, education, and household income. Red caps depict 95 percent confidence intervals. Analyses are weighted.
Sources: Combined SCB Benchmark 2006/Faith Matters 2006; ECS 2000/200

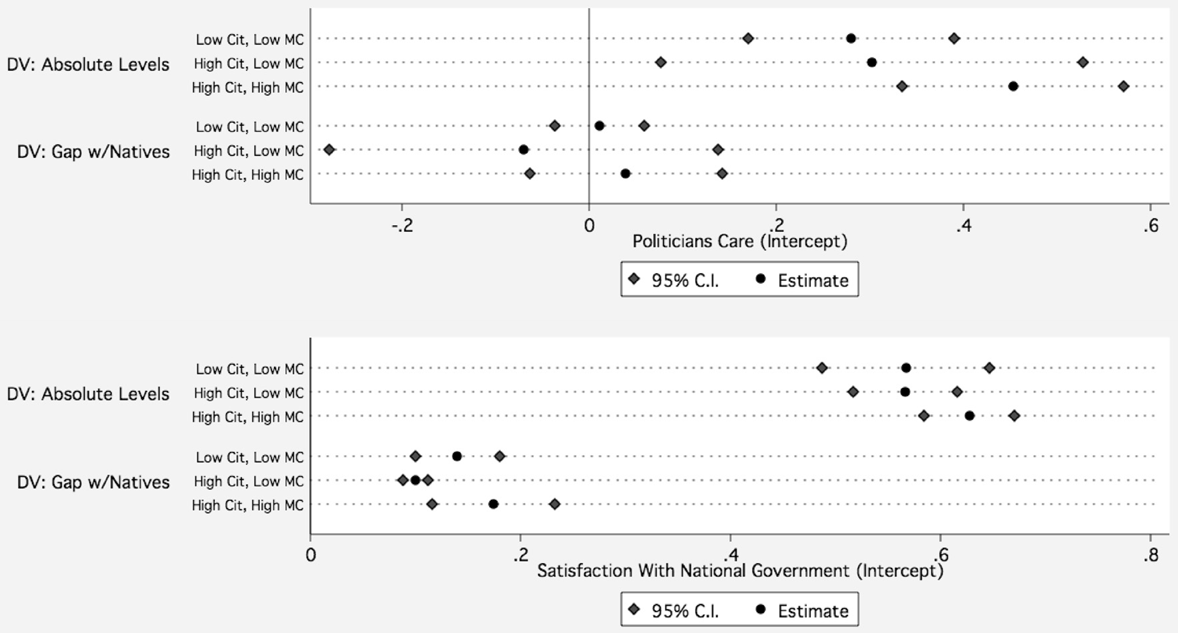
Finally, we consider the extent to which immigrants feel that politicians care about people like them and their overall level of satisfaction with the national government (Figure 7). Once again, in absolute terms we find a discernible difference in favor of HH countries, with LL and HL countries essentially identical to each other. The pattern, however, is tempered to some extent by the breadth of the confidence intervals, and it is substantively reduced to nil once native means are taken into account. In terms of satisfaction with the national government, immigrants in HH countries feel slightly better about the political system, whether we consider absolute levels or gaps. There is no difference, substantively or statistically, between LL and HL countries on this measure.
Incorporation and “politicians care,” satisfaction with national government
Notes: Plots represent intercept values when the outcome is regressed within policy category on individual level predictors (refer to note Footnote 11 for details). Politicians Care is a single 5-category item scored from 0 = “Hardly any politicians care” to 1 = “Most politicians care”; Satisfaction With National Government is a single 11-category item scaled from 0 = “Extremely dissatisfied” to 1 = “Extremely satisfied.” Estimator for both is OLS regression. Standard errors are corrected for clustering by country. Samples include only foreign-born respondents, though “Gap” scores are estimated via native samples. Analyses are weighted by ESS Design Weight.
Source: ESS 4-Wave Cumulative plus US CID Survey.

Political Integration: Interest and Participation
Implicit in fear over the socio-political effects of multiculturalism is the fear that immigrants neither care nor participate in political or civic life where they live; rather, they remain in isolated ethnic silos, or they engage in transnational politics of the homeland. We thus also consider political integration, measured by political interest and participation. Figure 8 maps intercept scores for interest in politics and political participation in the ESS/CID sample. In terms of the former, we find some support (albeit qualified by confidence intervals) for the notion that immigrants in HH countries are more interested in politics than their counterparts in the two other regime types. However, while the distinction appears in absolute terms, it is reduced when we shift the emphasis to gaps from natives—in other words, immigrants may be slightly more interested in politics in High MC countries, but so, too, are the native-born.
Incorporation regime and political interest/political participation
Notes: Plots represent intercept values when the outcome is regressed within policy category on individual level predictors (refer to note Footnote 12 for details). Political Interest is a single 4-category indicator scored from 0 = “Not at all interested” to 1 = “Very Interested.” Political Participation summarizes respondent participation in six different kinds of political activity—contacting a party/official, working in a political party/action group, working in another political organization, wearing/displaying a campaign badge/sticker, signing a petition, taking part in a lawful demonstration—in the past 12 months, re-scored from 0 = “none” to 1 = “all six”. Estimator for both is OLS regression. Standard errors are corrected for clustering by country. Samples include only foreign-born respondents, though “Gap” scores are estimated via native samples. Analyses are weighted by ESS Design Weight.
Source: ESS 4-Wave Cumulative plus US CID Survey.

What variation there is in political interest does not translate to increased political participation, regardless of whether the outcome of interest is absolute levels of participation or gaps with the native-born. Indeed, policy context appears to have no discernable effect on the measure of immigrants' political participation, a somewhat surprising finding given the arguments of political theorists either lauding or bemoaning the effect of cultural pluralism policies or the extensive literature positing the integrative consequences of open citizenship regimes. Possibly the institutional structures of political systems are much more determinative of participation than the policies we examine here. It is also possible that real differences in participation exist, but in the target and types of political action, as suggested by Koopmans et al., rather than the absolute level of such acts.Footnote 77
Discussion and Conclusion
The contemporary move away from official support for cultural pluralism and toward an emphasis on a common national culture and “community cohesion”Footnote 78 is widespread among politicians and pundits in advanced Western democracies. Many scholars, though more tempered in their rhetoric, also support this move. In this article, we assessed the effects of multicultural and citizenship policy on immigrants' socio-political integration, probing senses of trust, discrimination, identity, political interest, and non-electoral participation across three different kinds of policy regimes. We compared absolute levels of immigrants' scores on these measures across policy regimes and we also compared immigrant/native-born gaps in outcomes to address the possibility that regime-level differences might be a function of the “national culture” into which immigrants are integrating.
On two fronts, the findings are unequivocal. First, we observe no evidence that immigrants in countries with stronger policies of cultural recognition are less attached to or less engaged in the political community—understood as a collective of people and political institutions—than those in either Low Citizenship/Low Multicultural countries or, more importantly, High Citizenship Access/Low Multicultural countries. Academic research tends to downplay null findings, but in this case these findings carry enormous theoretical and policy significance: the most important rationale for the political backlash against multicultural policies—that they impede or hurt socio-political integration—appears unfounded empirically.
Second, our US/Canada comparisons reveal that Canadian immigrants appear substantially more “integrated” than their American counterparts, exhibiting higher levels of both social and political trust. The lone exception appears to be their greater emphasis on ethnic identity—as both proponents and critics of multiculturalism would expect—but importantly this does not come at the expense of a “national” attachment. Given that Canada scores by far the highest on the multiculturalism policy index, this finding could be taken as evidence for the idea that multiculturalism promotes hyphenated or nested identities rather than exclusive ethnic identities.Footnote 79 The evidence mustered here thus challenges the image of first-generation immigrants leading “parallel” lives in more multicultural societies, at least in terms of their expressed sense of socio-political inclusion.
Evidence for an outright positive effect of multiculturalism is more equivocal. In the ESS/CID analysis, immigrants in High Citizenship Access/High Multicultural countries appear to feel more included by and trusting of their fellow residents and of their government institutions than their counterparts elsewhere, even those living in open citizenship countries with limited multiculturalism. This pattern is especially evident when we compare values for immigrants across policy regimes. However, the evidence is not always strong in a statistical sense, and inter-regime differences often disappear once native levels are taken into account.
This attenuation in findings—depending on whether we compare across policy regimes or to native-born averages—provides support for the idea that immigrants are integrating into their adoptive countries, and that they do so toward majority attitudes on inter-personal trust, political interest and political efficacy. The idea of progressive integration garners further support in an analysis of trust in parliament and satisfaction with government by Maxwell, who finds that second generation attitudes converge to the native-born “mainstream” position such that the two groups are often statistically indistinguishable.Footnote 80
Intriguingly, many of the outcomes where we find a positive relationship with open citizenship laws and multicultural policies are related to attitudinal measures such as trust, immigrants' sense of inclusion and their (relative) lack of perceived discrimination, not to reported participation. This is in line with the premise advanced by political philosophers who contend that minorities gain a greater sense of legitimacy and recognition from policies of cultural pluralism, which in turn facilitates cognitive and emotional allegiance to the adoptive country and ultimately political cohesion. In contrast, multiculturalism viewed from the perspective of mobilization receives limited support in the European data; data constraints prevented us from a closer examination with the US/Canada survey data. For those interested in immigrant political participation, future research should consider the relative effects of multiculturalism on political behavior compared to other policies or institutional features of the political system.
The independent effect of closed or open citizenship regimes is harder to discern, but if the effects of multiculturalism appeared somewhat weak, the effect of liberal citizenship policies, by themselves, appears even more so. We find very limited differences between countries with low access to citizenship and limited multiculturalism, on the one hand, and countries with high access to citizenship and limited multiculturalism, on the other. Ultimately, immigrants seem to do best in countries combining open citizenship and multiculturalism, although definitive conclusions are difficult to make without countries that fall into a hypothetical—but conceptually difficult to imagine—“Low Citizenship/High Multiculturalism” policy regime.
We feel that the wide scope of our analysis provides a broader examination of multiculturalism and immigrant political integration than previous scholarly discussions of the issue. Not only do we consider a wide range of outcomes and European countries, but the inclusion of two North American nations allows us to test the logical extension of concerns over multiculturalism to additional cases, one of which is more multicultural than all others. As noted above, if multicultural policies undermine socio-political integration and common membership, we should see these negative effects most strongly in Canada. Instead, we find the opposite on many measures. Of course, some might argue that the traditional immigrant-receiving societies of North America are fundamentally different from Europe, or that this is a story about “Canadian exceptionalism” rather than a more general truth about multiculturalism. This might be the case. But if so, the political theory and policy analysis of multiculturalism (and citizenship policy) must be re-conceptualized to explain why the posited mechanisms driving positive or negative socio-political integration vary by country or region.
Given the wide scope of our analysis, over-simplification is inevitable. Controlling for individual-level determinants and observing intercept values across policy regimes is a straightforward but simplistic way of putting all countries on an “equal footing” for comparative purposes. For example, while we were able to distinguish immigrants of “visible minority” and “majority” status, we were—with the notable exception of our efforts to account for “Asian exceptionalism” in some of the Canadian analysis—unable to make more fine-grained distinctions between Somali migrants, on the one hand, and Chinese migrants, on the other. Various scholars suggest that immigrant political incorporation may depend on country of birth or political socialization in the homeland.Footnote 81 Similarly, in Europe, much of the concern over multiculturalism and integration targets Muslim minorities. Due to data constraints, we cannot examine outcomes separately for Muslim and non-Muslim migrants. These topics are areas for further research as data collection efforts increasingly over-sample immigrant and minority populations and ask more sophisticated questions to get at the diversity of the foreign-born population and their descendants.
Another issue only lightly touched upon here concerns the other prong of the recent anti-immigrant backlash in Europe: political elites have also increasingly demanded mandatory “civic integration” policies—language and civics classes, for example—to better incorporate new immigrants into the body politic.Footnote 82 As Goodman notes, such policies have become more prevalent throughout Europe since 1997, though with substantial variation between countries.Footnote 83 This issue is beyond the scope of the present analysis, but the question of whether these kinds of policies actually work in incorporating immigrants—economically, socially, and politically—is one that is very much in need of systematic research. It is worth noting, in this context, that both the United States and Canada require evidence of civic knowledge and linguistic ability in the majority language to naturalize, and Canada makes it somewhat easier for English- or French-speaking individuals to migrate to the country. An interesting question for future research is whether government-promoted integration efforts have different effects in more or less multicultural countries. Perhaps, in a country like Canada, integration programs are not seen by immigrants as onerous or assimilatory given the existence of multicultural policies.
One of the limits of our analysis is the focused attention on foreign-born migrants to the exclusion of their native-born offspring. Contemporary concern in Europe, in particular over “home-grown” terrorists, rioting urban youth, and minorities' social isolation, encompasses a population of second- and third-generation minorities, not just immigrants. Since our analysis centered uniquely on the foreign-born population, it is possible that multiculturalism imperils a common sense of “we” among second and third generation immigrants. Since political debates surrounding multiculturalism apply to immigrants as well as their descendants, there is clearly a need for more research on the attitudes and behaviors of those born of immigrant parents. Our analysis is also limited by its attention to socio-political outcomes. We believe this focus is justified because the theoretical claims made by the proponents of multiculturalism primarily center on the issues of trust, identity, and political inclusion that we measure here. It is possible that effects in others domains, such as housing segregation, employment, language ability, or other socio-economic outcomes could differ.
Despite data limits, we believe that our analysis offers an important corrective to the heated political rhetoric of recent years and it offers an important empirical intervention on a longstanding theoretical debate. We find no evidence that multiculturalism hinders socio-political integration, at least among first generation immigrants, and much to suggest it fosters political inclusion. Clearly the political climates in many of the countries under analysis have become hostile to the concept of multiculturalism. This is evident among elites,Footnote 84 with evidence of a “trickle down” effect to mass attitudes.Footnote 85 We thus face the possibility that immigrants—who are easily painted as scapegoats and sources of cultural or economic threat—may lose the right to cultural recognition and the policies that flow from it, much to the detriment of their ability to engage with and feel like valued members of their adoptive national community. It is beyond the scope of our empirical analysis to offer a full-fledged normative critique of such a political outcome. But there are two things that we can say with confidence. The first is that the conventional public rationale for the move against multicultural policies—that they fail to promote civic integration—is false, at least as borne out by the kinds of survey data that we have analyzed. The second, which follows, is that repeal of such policies is likely to have the perverse effect of further marginalizing, and alienating, immigrant populations, to the detriment of both civic inclusion and political legitimacy. This surely cannot be a good thing for the future of liberal democracy.
Appendix: Data Sources
ESS 4-Wave Cumulative Combined with US CID Survey

* only one wave of the US CID survey (2005/2006) was fielded. For further details on survey methodology, see: http://www.europeansocialsurvey.org/
Single-Country Surveys

* English, French, Mandarin, Cantonese, Italian, Punjabi, Portuguese, Vietnamese and Spanish
** For analysis, income is transformed into quintiles (based on entire rather than foreign-born only sample).
Supplementary Materials
Explanatory File
http://journals.cambridge.org/pps2012001
Stata Code
http://journals.cambridge.org/pps2012002
Coding Guide and Notes
http://journals.cambridge.org/pps2012003
ESSCID 4-Round Final Data
http://journals.cambridge.org/pps2012004
SCB & FM 06 Data
http://journals.cambridge.org/pps2012005
Canada ESC Merged Data
http://journals.cambridge.org/pps2012006
EDS 2002 Data