By the dawn of the twentieth century, fertility rates in the United States had undergone a century of steady decline. In 1800 white American females could expect to bear 7.0 children on average; by 1900 this number was 3.6.Footnote 1 The factors behind the nineteenth-century decline have been the subject of a lengthy literature highlighting the importance of intergenerational bequests, the economic value of children, and the cultural context for American family formation.
Yasukichi Yasuba initiated the literature on the importance of land availability to the bequest process, noting that those locations with lower land prices experienced higher fertility rates and vice versa.Footnote 2 William Sundstrom and Paul David and Susan B. Carter, Roger L. Ransom, and Richard Sutch present alternatives to the land availability hypothesis for explaining the nineteenth-century decline emphasizing the role of economic modernization.Footnote 3 The empirical evidence seems to indicate a role for bequest and land availability explanations of fertility decline early in the nineteenth century while economic modernization variables (levels of industrialization, urbanization, child labor laws, average wages, literacy rates, and education levels) hold better explanatory power for the postbellum era.Footnote 4 But despite these conclusions, the impact of these economic modernization correlates on fertility rates has yet to be measured in anything more than a cross-section, observational framework.
This article is motivated by the concern that previous estimates of the relationship between industrialization and fertility were measured with simultaneity bias. An empirical observation that industrialization and fertility are negatively correlated is not informative about causation. Falling fertility may have spurred industrialization rather than vice versa, or external factors may have contributed to both simultaneously.
There are a number of mechanisms by which industrialization may have altered a household's fertility outcome. First, several models of economic growth and fertility decline highlight the role of human capital in increasing the incentives of households to invest in child quality over quantity, thereby reducing the number of children born.Footnote 5 Second, industrialization may have induced a rise in the implicit costs of raising children. In particular, industries with high rates of female employment increased the opportunity cost of female time. Under the assumption that the child production process is female time-intensive, this would have reduced the incentive to bear children.Footnote 6 Third, the movement away from agricultural and at-home production to centralized production, in addition to more restrictive child labor laws, may have reduced the economic return to children, again lowering parental demand and fertility rates.Footnote 7 Fourth, industrialization was associated with increased urbanization and the crowding that occurred may have increased the explicit costs of raising children through higher housing and food costs without an associated increase in the benefit.Footnote 8 Finally, the developing economy in the United States witnessed decreases in child mortality rates, especially after 1880.Footnote 9
I exploit the circumstances surrounding industrialization in South Carolina between 1880 and 1900 to identify a plausibly exogenous change in the level of industrialization. I argue that the emerging geography of South Carolina's textile industry was driven by water power concerns and was unlikely to have been correlated with fertility ex ante. Using a sample of rural townships in South Carolina, including locations that did and did not establish textile mills over this period, I estimate a reduction in fertility of between 6 and 10 percent following textile mill establishment.
These data indicate that an increase in urbanization and the costs of raising children, including a rising opportunity cost of female time, can explain part of the observed reduction in fertility in South Carolina industrial locations. At the same time, I find no support for mechanisms relying on human capital considerations and increases in the adult/child wage differential. Differential infant mortality among industrial workers may also have been a factor in fertility reduction.
EMPIRICAL STRATEGY
This article measures the impact of industrialization on fertility rates using data from rural areas of South Carolina between 1880 and 1900. In 1880 South Carolina was home to 14 textile mills and 84,424 spindles. By 1900 the state housed 93 mills and 1,693,649 spindles, an increase of almost 2,000 percent.Footnote 10
There are several unique aspects of the South Carolina industrialization process that make it an ideal laboratory in which to test hypotheses about industrialization and fertility decline. First, prior to 1910 or so, textile mills provided the overwhelming majority of industrial employment in the state. In 1900, 30 percent of males and 57 percent of females employed in manufacturing were textile workers. No other industry came close to matching the textile share of employment, and the vast majority of the runners-up involved manufacturing in a decentralized setting.Footnote 11 As a result, South Carolina industrialization in general can be proxied by the textile industry in particular.
Second, the historical record indicates that the Piedmont region, where textile manufacturing focused after 1880, was homogenous in terms of its economic activity, socioeconomic characteristics, and climate prior to industrialization.Footnote 12 Further, the particular locations of textile mills in rural areas were primarily determined by concerns about water power rather than demographic characteristics of the local population and, in particular, their fertility. In many ways, “if you build it they will come” applied to the South Carolina rural population in this period. Rural households were desperate to leave their farming professions as cotton and tobacco prices plummeted in the 1890s. Mill owners could have chosen virtually any rural location and they would have found a local labor force eager to become mill workers. The uniformity of the Piedmont area gave mill proprietors the opportunity to select locations based on other criteria.
In the early part of the industrialization period, particularly prior to 1890, mills located on the banks of rapidly flowing rivers. These location decisions were driven both by concerns about water power and by the need for natural humidity to support the manufacturing process. Any river location could supply humidity, so the availability of quickly flowing water capable of driving a water wheel dictated location in this early period. The demographics of the local population would have been, if anything, secondary.
The first steam-powered mill was built in South Carolina in 1881 and, after 1890 steam power began to dominate as a power source. “Cotton mills among the cotton fields” became possible, and mill proprietors were freed somewhat from their reliance on fast-flowing water. At first, steam and water were used in combination to power textile mills, but by the second half of the 1890s, most mills ran on steam alone.Footnote 13 Proximity to water was still desirable for waste removal and natural humidity.Footnote 14
After 1900 the pre-1900 drivers of location decisions were waning. Labor market considerations were becoming more important as South Carolina mills began producing a higher quality cloth that required skilled labor, and electric power was freeing firms from prior geographic constraints.Footnote 15 As a result, 1900 was chosen as the endpoint for this analysis.
Even given the site selection process described above, it is likely that townships with a water supply suitable for water-powered manufacturing were different from other locations ex ante.Footnote 16 As a result, I use a difference-in-difference estimator to account for any preexisting differences in fertility in estimating the impact of mill establishment on fertility. Using this methodology, the estimated impact of industrialization on fertility is 6 to 10 percent.
In order to determine the importance of migration in this result, I incorporate household-level data and conclude that declining fertility can be entirely attributed to migrating households. Given this result, I evaluate the potential mechanisms at play and find that higher rates of textile employment and child mortality characterized the migrant experience. In addition, I hypothesize that the loss of an extended family raised the implicit costs of child rearing for these households. I further argue that alternative explanations for the observed relationship between industrialization and fertility are not supported for this particular historical episode.
TOWNSHIP DATA
Demographic and fertility data comes from the manuscript returns of the United States Census. The U.S. Census was taken at the individual level. Individuals were grouped into households which were, in turn, grouped into townships. Townships were grouped into counties and then into states. Using data from the online genealogy tool Ancestry.com, I assemble age structure and marital status data for townships in both 1880 and 1900 to measure a township-level impact of industrialization on fertility.Footnote 17 I focus on marital fertility rates as almost all fertility occurred within marriage and declines in marital fertility, rather than declines in marriage rates, contributed most to the U.S. decline in this period.Footnote 18 In each year (t = 1880, 1900), I calculate F5 fertility rates:

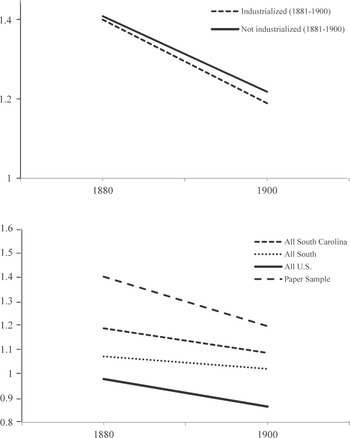
The F5 fertility rate calculated in this manner will be sensitive to child mortality, a topic I address later in the article.Footnote 19 I also perform sensitivity analysis in the next section using F3 fertility rates and eliminating widowed and divorced women from the denominator. A comparison of F5 fertility rates for the townships included in the main results of this article, all of South Carolina, all of the South, and the United States appear in Figure 1. Figure 1 also shows a comparison of F5 fertility rates for industrial and nonindustrial townships in South Carolina in both 1880 and 1900.
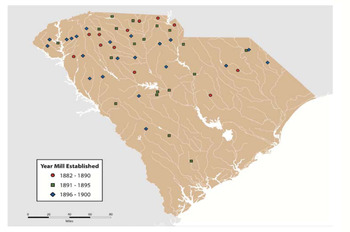
Industrialization data comes from Davison's Textile Blue Book, a directory of textile mills in the United States. The directory was printed biannually beginning in 1888. I use the 1902/03 edition to generate a timeline of mill establishment in South Carolina prior to 1900.Footnote 20Davison's gives an establishment date for each indexed mill, and Figure 2 shows a map of South Carolina with markers for textile mills that were established between 1880 and 1900. From this data, I generate two industrialization indicators: I 1895 = 1 if a mill was established in township j by 1895 and I 1900 = 1 if a mill was established between 1896 and 1900. The F5 fertility measure described above, when measured in 1900, incorporates all fertility over a 5-year window from 1896 to 1900. Given this time frame, it is important to separately identify townships with mills established prior to the beginning of the fertility measure (I 1895) whose fertility response may conceivably be fully captured by the F5 measure and those townships with mills established within the 1896–1900 window (I 1900) and whose fertility response may not be fully accounted for using F5. I 1895 includes townships exposed to industrialization for the entirety of the F5 window while I 1900 includes townships with only partial exposure to a textile mill during that window.
F5 FERTILITY RATES FOR INDUSTRIALIZED AND NONINDUSTRIALIZED SOUTH CAROLINA TOWNSHIPS (TOP PANEL) AND FOR ALL SOUTH CAROLINA, THE SOUTH, UNITED STATES (BOTTOM PANEL)

SOUTH CAROLINA MILL ESTABLISHMENT: 1881–1900

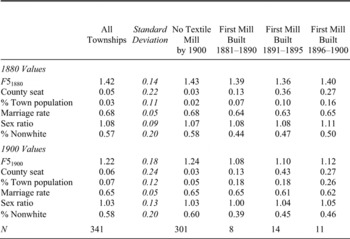
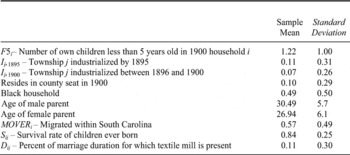
TOWNSHIP DATA VARIABLE SUMMARY

Notes:
Sample includes all non-coastal townships with no textile mill by 1880 and 1900 town population of fewer than 2,500. Corresponds to results in Table 2.
Sources:
See the text.
I incorporate into the analysis several additional explanatory variables: a binary variable for whether the township was a county seat in year, a proxy for urbanization measuring the inhabitants of a census-defined town divided by all township inhabitants, the nonwhite population percentage, the male to female sex ratio for individuals aged 18 to 42, and the marriage rate among females aged 18 to 42.
DIFFERENCE-IN-DIFFERENCE RESULTS
Table 1 summarizes these variables for both 1880 and 1900 for the sample townships, tabulated by the period in which the first mill was established. By 1900 the average fertility rate in industrialized townships was well below the sample average, and a simple OLS estimate of the effect of industrialization (measured by I 1895 and I 1900) on fertility is negative and significant (not shown). But, as is evident from Table 1, townships that industrialized between 1881 and 1900 also had somewhat lower fertility rates ex ante, as measured by F51880. While a “falsification test” which repeats the OLS exercise for F51880 identifies no significant impact on ex ante fertility, the estimated coefficients are large enough to motivate alternative estimators.
To take into account the difference in 1880 fertility levels, I evaluate the impact of mill arrival on fertility rates using a difference-in-difference approach with 1880 and 1900 data.Footnote 21 A difference-in-difference estimator compares the change in fertility between 1880 and 1900 for industrializing townships to the change in fertility between 1880 and 1900 for townships where no textile mill was established. The underlying assumption is that, in the absence of industrialization, the rate of change for these two groups would have been the same and any difference in these rates of change is due to the industrialization process itself.
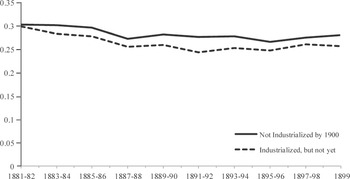
To examine the assumption of similar trends in fertility in both groups, I calculate an annual fertility rate retrospectively from 1881 to 1900 for each township in my sample using the 1900 Census returns.Footnote 22 I regress these annual fertility rates from 1881 to 1900 for townships that do not contain a textile mill in that year on a township fixed effect and a constant and calculate the residuals.Footnote 23 In Figure 3, I plot these smoothed residuals for two types of townships: those that do not industrialize in the 20-year window (“Not industrialized by 1900”) and those that industrialize at some point before 1900 but have not done so by year t (“Industrialized, but not yet”). The strikingly similar trend lines indicate the fertility rates of industrial townships prior to the arrival of textile mills are declining at a rate similar to townships that do not industrialize by 1900. This finding is consistent with the main assumption behind a difference-in-difference model.
RESIDUAL FERTILITY IN NONINDUSTRIAL TOWNSHIPS, BY FUTURE INDUSTRIAL STATUS (1880–1899)

The estimated impact of industrialization on fertility is represented by δ1 and δ2 in equation 1

where Xjt is a vector of township-year characteristics. c is a constant, λj is a township-specific fixed effect, 1(t = 1900) is an indicator for the second year of data, θ is the 1900-specific year effect, and εjt is a random error term. The estimation is performed over t =1880, 1900. The first-difference estimating equation is

where  .
Variable means and standard deviations are located in Table 1. Table 2 contains the estimates from equation 2 under a variety of specifications. As anticipated, a more significant impact of I 1895 on fertility rates than I 1900, both statistically and economically, is observed in Table 2.
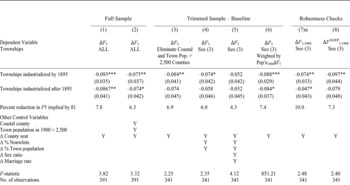
In column 1 of Table 2, I include all townships in the data set, excepting only those that already contained a textile mill in 1880 (1.8 percent of all townships) and incorporating only the political designation of the township as a county seat in Xjt. In column 2, I add two indicators: one for whether the township is located in a county on South Carolina's Atlantic coast and one for whether the size of the town population in 1900 exceeds 2,500. Coastal counties were not as heavily dependent on agriculture prior to the arrival of the mills, did not participate in the textile industry, and were arguably different from the Piedmont counties in other ways as well. The town population measure is a recognition that, in larger towns, industrialization came in forms other than textile mills, and the industrialization proxies used herein are inappropriate.Footnote 24 For both columns 1 and 2, industrialization, as proxied by textile mills, was accompanied by more rapid fertility decline between 1880 and 1900. For a mill built between 1881 and 1895, the estimated additional reduction in fertility is between 6 and 8 percent.
Given these concerns about the adequacy of I 1895 and I 1900 to measure industrialization in coastal counties and in townships with larger town populations, I trim the sample in columns 3–8 to eliminate these counties. This is the baseline specification. The results in column 3 again indicate that textile mill locations exhibited an acceleration in fertility decline between 1880 and 1900 relative to nonindustrial townships. Industrialization prior to 1895 is associated with a differential reduction in fertility of 6.9 percent in this trimmed sample, controlling only for county seat status. This 6.9 percent estimate represents the fertility reduction for the average township. In column 6, I weight the estimate by township population in 1900, which leads to a slightly larger reduction of 7.4 percent as the estimated impact of industrialization.
These results clearly indicate that the presence of a textile mill in a township is correlated with lower fertility rates in 1900. What changes in observable characteristics of textile locations might help explain this correlation? I add controls for the change in the racial composition and density of the township's population in column 4. Industrialization may have induced the small-scale urbanization measured by “town” residents as a percentage of total population and may have altered the ratio of the nonwhite to white population as textile mills employed white workers almost exclusively. Incorporating those two covariates, the estimated impact of industrialization prior to 1895 is reduced by approximately 11 percent, indicating that changes in population density and racial composition accounted for a small proportion of the observed fertility reduction in textile locations.
IMPACT OF INDUSTRIALIZATION ON FERTILITY DIFFERENCE-IN-DIFFERENCE ESTIMATION RESULTS FOR TOWNSHIP SAMPLE (equation 2)

∗ indicates statistical significance at the 10 percent level.
∗∗ indicates statistical significance at the 5 percent level.
∗∗∗ indicates statistical significance at the 1 percent level.
aIn Column 7, I 1895 becomes I 1897 and I 1900 represents only those mills built between 1898 and 1900.
Notes:
Point estimates of coefficients. Standard errors are in parentheses.
Sources:
See the text.
The F5 fertility measure used in these regressions is a marital fertility rate, but it may still be the case that changes in the sex ratio or marriage rates altered fertility within marriage if, for instance, a changing marriage rate impacted the age at which women marry and their fertility window within marriage. I add measures of the change in both the sex ratio and the marriage rate for residents aged 18 to 42 in column 5. The estimated mill impact is reduced relative to column 3 by approximately 30 percent, indicating that changes in the sex ratio and marriage rates account for roughly one-third of the overall decline in fertility observed in textile locations.
In columns 7 and 8 of Table 2, I undertake two robustness checks. To determine the sensitivity of the results to the fertility measure used, I repeat the estimation on F3 measures of fertility. There is little change in coefficients as reported in column 7. In column 8, I limit the denominator to married females (excluding widowed and divorced females). Again, there is little change in the results.
The results from columns 3–6 of Table 2 show that textile mill establishment significantly reduced fertility rates in South Carolina between 1880 and 1900 and that changes in population density, racial composition, sex ratios, and marriage rates of these townships can explain less than half of the fertility reduction. Mill establishment prior to 1895 is associated with a 6.9 percent reduction in fertility rates in a specification with no demographic covariates and 4.3 percent after controlling for these changing aspects of the township population.
A remaining concern is whether differential migration not captured by changes in the racial composition, sex ratio, and marriage rate, is responsible for the observed decline. This concern motivates construction of a household-level data set in the next section.
CONTROLLING FOR MIGRATION
The advantage of township data is that township boundaries are the same throughout the 20-year industrialization period, allowing us to measure a “pre-industrialization” and “post-industrialization” fertility metric and generate a difference-in-difference estimate of the impact of textile mill establishment on fertility. But townships are not composed of an immobile set of individuals, and the fertility pattern documented above could simply be a result of selective migration without changing the fertility outcomes of households per se. In this section, I generate a new sample of households including a measure of migration.
In order to identify migrants, the location of the household at two points in time is needed. The 1900 Census contains information on an individual's state of birth, but not their county or township. As the vast majority of South Carolina residents in 1900 were born in South Carolina, this variable has limited power to identify migrants.
I remedy this problem using the genealogy tool Ancestry.com to link individuals between the 1900 Census and the 1880 Census and use their township location in both to infer migration. The 100 percent sample of the 1880 U.S. Census from the North American Population Project has information on 284,412 South Carolina resident males aged 0 to 20 in 1880.Footnote 25 Of those, 34,841 are uniquely matched to the 1900 U.S. Census using the search function of Ancestry.com and the individual's full name, race, and age (1 year) to make a match.Footnote 26 Of those, 12,999 are married with their spouse present in the household and reside in South Carolina townships with fewer than 2,500 town residents in 1900 and outside of the coastal counties. This subsample of married South Carolina males, aged 19 to 41 in 1900 with a spouse present in the household, is the basis for analysis. The 1900 Census return as transcribed by Ancestry.com contains a full list of household members, their name, relationship to the head of household, age, race, marital status, marital duration, and birthdate. The location of the male head at two points in time, 1880 and 1900, gives a measure of household migration.
A caveat is in order. Because the objects of interest are young, fertile households in 1900, I can only link the male head because he is the only member of the household who would have been alive and with the same last name in 1880. Females would have been enumerated under their maiden name in 1880. That presents the possibility that even though the male head did not migrate between 1880 and 1900, his wife did (or vice versa), and I will not capture that in the subsequent analysis.Footnote 27
MIGRATION RESULTS
To measure the impact of migration on the results previously reported, I estimate an equation of the following form

where  is the (discrete) number of children less than age 5 in household i in township j, analogous to the F5 fertility rate from the township sample. The vector of township characteristics, Xj, was defined previously. Yi contains the matched male's age, age squared, wife's age, age squared, and an indicator for whether the matched male is black. MOVERi is an indicator for whether household i changed township locations between 1880 and 1900. The coefficient α measures differential fertility for township movers. Table 3 gives sample means for variables contained in the household sample. As a consistency check,
 from Table 1 and
 from Table 3 are both equal to 1.22.
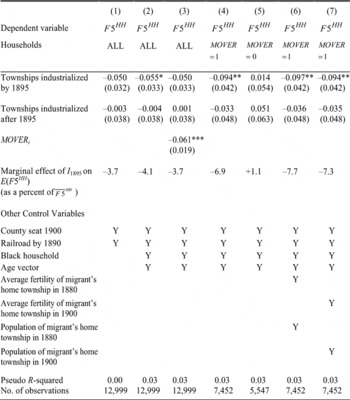
An ordered probit estimator is used for equation 3 because values for  are discrete.Footnote 28 Coefficients and standard errors for δ1, δ2, and α are reported in Table 4, but the coefficients no longer have a marginal effect interpretation. The marginal effect implied by δ1 is listed lower in the table. In column 1 of Table 4, the estimate of the impact of industrialization on fertility controlling only for variables available in the township sample indicates a negative correlation between F5HH and pre-1896 industrialization of about 3.7 percent in the household sample compared to 7.4 percent in the township data weighted by population.

After adding race and age covariates in column 2, the implied reduction in fertility corresponding to pre-1896 industrialization is 4.1 percent.Footnote 29MOVERi, the indicator for migration, is included in column 3 and the negative coefficient implies that migrants had lower fertility. Comparisons of coefficients for the the sample of movers in column 4 and nonmovers in column 5 shows that migrants who resided in townships industrialized by 1895 had 6.9 percent lower fertility than migrants to nonindustrial townships. On the other hand, nonmovers in those same townships exhibited 1.1 percent higher fertility, although the coefficient is not statistically significant. This is a striking result as it indicates that households who remained in textile locations between census enumerations exhibited no change in fertility relative to those households who remained in a non-textile location. The industrialization process was correlated with lower fertility, as earlier results have indicated, but migrating households were responsible for the negative correlation.
There are at least three potential explanations for this result. First, it is possible that migrants to textile townships were disproportionately from low-fertility native townships and brought these fertility patterns with them. But adding covariates for average fertility of the migrant's home township and population of the migrant's home township, either in 1880 (Table 4, column 6) or 1900 (column 7), does not reduce the estimated impact of industrialization.
IMPACT OF INDUSTRIALIZATION ON FERTILITY ORDERED PROBIT RESULTS FOR HOUSEHOLD SAMPLE (equation 3)

∗ indicates statistical significance at the 10 percent level.
∗∗ indicates statistical significance at the 5 percent level.
∗∗∗ indicates statistical significance at the 1 percent level.
Notes:
Point estimates of coefficients. Standard errors are in parentheses.
Source:
See the text.
A second potential explanation is that movers to textile locations had lower initial fertility rates than their native township peers. Perhaps these low-fertility households were attracted to the labor markets in industrial locales and brought their low fertility with them. If so, we would expect migrants to townships where mills were built late in the 1881–1900 timeframe to exhibit low fertility as well, but that is not the case. In every specification of Table 4 involving mover households (columns 4, 6, and 7), the impact of being in a township industrialized by 1895 is large and negative while the impact of location in an industrial township where a new mill was added after 1896 is less negative and statistically insignificant. Migrants exhibited lower fertility than nonmigrants in textile locations, but only in locations where they had been exposed to a textile mill for five years or longer. Migrants to townships where mills were built between 1896 and 1900 did not have lower fertility rates than their peers. This points not to selective migration of households, but to a different fertility response to residence in a textile locale.
This gives rise to a third explanation. I document below that women in the households that migrated to textile townships disproportionately chose textile occupations and experienced higher rates of child mortality. In addition, the loss of proximity to extended family for migrants might have contributed to higher costs of raising children.Footnote 30
MIGRATION, OCCUPATIONAL CHOICE, AND CHILD MORTALITY
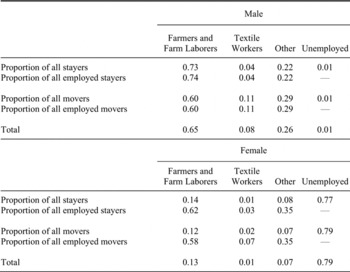
Occupational choice may have contributed to the differing impact of industrialization on movers and stayers. Since Ancestry.com did not report occupations for the sample used in Table 4, I transcribed the occupation of the male and female household heads for the 2,342 households residing in townships in 1900 that were industrialized between 1881 and 1900 from the original census enumerations. The occupation shares in Table 5 show that 11 percent of male heads of migrant households were employed in textile jobs, compared with only 4 percent of stayers; 7 percent of migrant women compared to 3 percent of stayers were in textile jobs. Movers also had a higher rate of employment in nonfarm occupations in general.
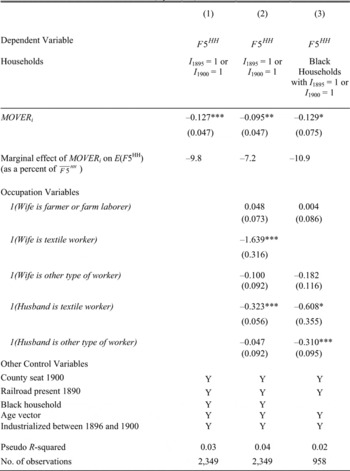
Both nonagricultural employment categories were negatively correlated with fertility. When I estimate fertility for households with occupations listed in the industrial townships as a function only of migration in column 1 of Table 6, fertility is strongly negatively correlated with migrant status in industrial locales. After controlling for the occupations of the male and female household heads in the sample in column 2, households with males and females in the textile industry have lower fertility, while the relationship between fertility and migration is reduced by approximately 25 percent from −9.8 percent to −7.2 percent but remains significant.
MALE AND FEMALE OCCUPATION, TABULATED BY MOVER/STAYER STATUS

Notes:
See the text. The “Other” category is comprised mostly of service occupations.
Sources:
See the text.
The impact of occupations was strong not only for white residents who were likely to experience textile employment, but also for black migrants who very rarely were textile workers. Column 3 of Table 6 limits the sample to black households and the results are largely unchanged. The impact of textile mills, it appears, extended beyond their own employees, perhaps because they altered the labor market for townships in general.
Occupational choice, then, can explain part of the difference in fertility between movers and stayers in textile locations, but a significant portion of the correlation remains unexplained. One further hypothesis is that migration influenced infant mortality which, in turn, affected fertility. Higher rates of infant and child mortality in industrial locations for migrating households in 1900 may be the cause of lower observed fertility in 1900 if replacement is not perfectly achieved.Footnote 31
IMPACT OF MOVER/STAYER STATUS AND OCCUPATIONAL CHOICE ON HOUSEHOLD FERTILITY IN TOWNSHIPS INDUSTRIALIZED BY 1900 (equation 3)

∗ indicates statistical significance at the 10 percent level.
∗∗ indicates statistical significance at the 5 percent level.
∗∗∗ indicates statistical significance at the 1 percent level.
Notes:
Point estimates of coefficients. Standard errors are in parentheses.
Sources:
See the text.
The 1900 Census asked married women how many children they had borne and how many were surviving.Footnote 32 Using the household sample, it is straightforward to calculate a child survival rate as the ratio of the number of children surviving to the number ever born, and then to examine the relationship between that number, industrial residence, and migration.Footnote 33
I estimate the relationship between a married female's reported child survival rate and the presence of a textile mill in the household's 1900 township location, conditional on other characteristics of the household. The estimating equation is

where Sij is the observed child survival rate for household i in township j in 1900. Unlike F5, the survival measure is not limited to the five years prior to the 1900 Census enumeration. Instead, the measure will reflect cumulative infant and child mortality over the entirety of a female's childbearing years and I 1895 and I 1900 are no longer relevant. Instead I construct a variable, Dij, that represents the proportion of household i's marital duration for which township j housed a textile mill. The same set of control variables are used to estimate equation 4 as for equation 3, and the same sample restrictions apply.
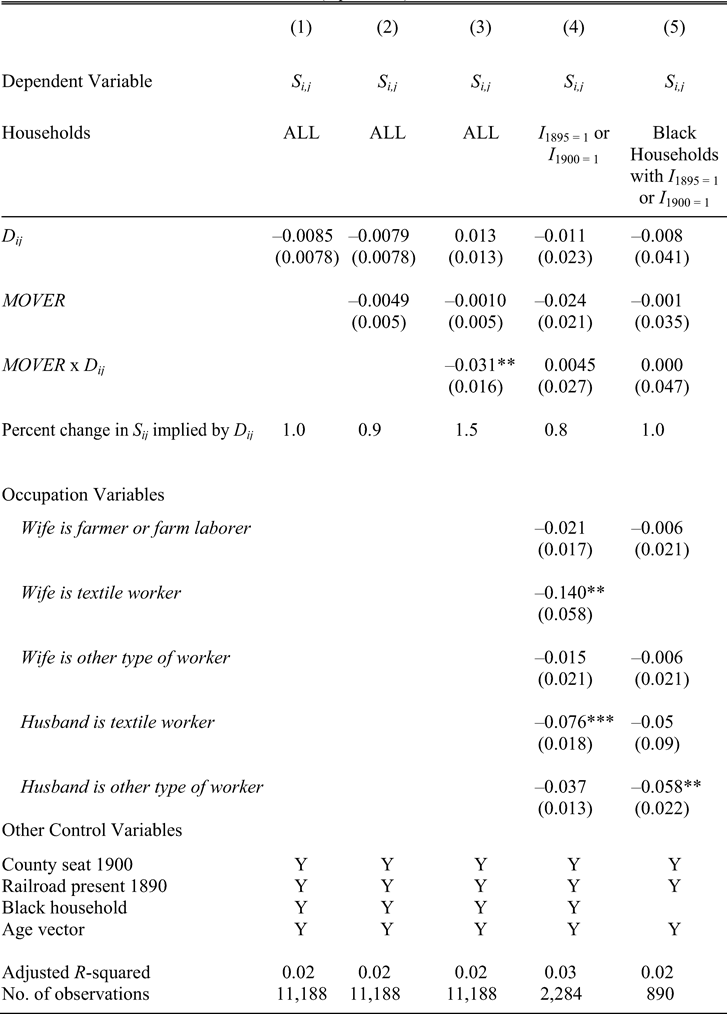
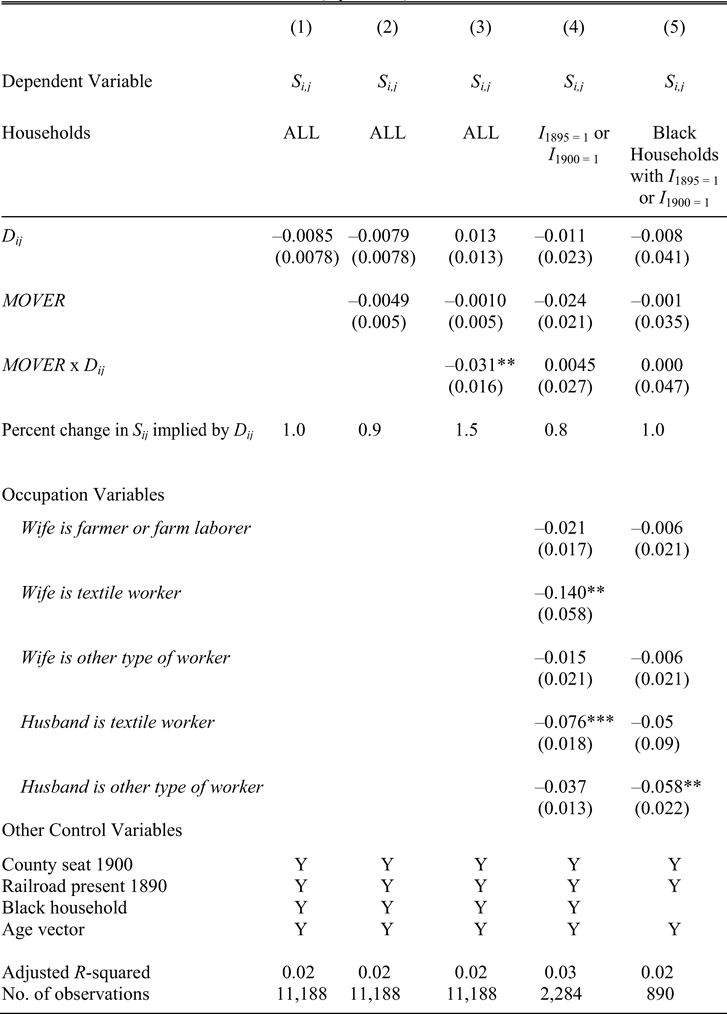
Table 3 gives the mean and standard deviation of Sij and Dij. The results in column 1 of Table 7 indicate no discernible difference in infant and child mortality rates between residents of industrialized and nonindustrialized townships.Footnote 34 These are small numbers; the coefficient in column 1 represents a reduction in survival rates of 1.0 percent.
Adding migration status to the regression (Table 7, column 2) does not affect the results. But in column 3, I add an interaction between mover status and the textile exposure measure, Dij, and the estimates indicate that survival rates were significantly lower among movers to industrial locations than among their peers. A mover to a township with a textile mill present for the entirety of their marriage duration experienced a reduction in child survival rates of 3.7 percent (0.031/0.84) relative to nonmovers or movers to nonindustrial locales. The coefficients when occupations dummies are added to the specification in column 4 indicate that the occupational choice of migrants largely explains the adverse child survival rates. Female employment in a textile mill had a large negative correlation with child survival rates, while employment of the male had a more muted correlation. When the occupation dummies are added the coefficient on the interaction between mover and location in an industrial household turns positive and is statistically insignificant. For black residents (column 5), migration was similarly inconsequential for determining infant and child mortality after controlling for occupation.
REGRESSION RESULTS FOR CHILD SURVIVAL RATES IN THE HOUSEHOLD SAMPLE (equation 4)
∗ indicates statistical significance at the 10 percent level.
∗∗ indicates statistical significance at the 5 percent level.
∗∗∗ indicates statistical significance at the 1 percent level.
Notes:
Point estimates of coefficients. Standard errors are in parentheses.
Sources:
See the text.
The results in Tables 6 and 7 indicate that occupational choice may explain part of the lower observed fertility rates among migrants in industrial locales. A lower child survival rate in migrant households is entirely attributable to occupational choice, lending futher support to this conclusion. If differential fertility among movers to industrial locations was driven by reductions in survival rates, it appears to have been the result of occupational choice. But a significant portion of the mover-stayer fertility differential remains unexplained, even after controlling for occupation in Table 6.
EVALUATING POTENTIAL MECHANISMS
The introduction to this article listed several ways in which economic growth may have affected fertility rates, and I evaluate those potential mechanisms in turn.
First, the available evidence indicates that increases in the costs of raising children contributed to reduced fertility in textile locations. Female occupation is a strong predictor of household fertility in the sample (Table 6), and low migrant fertility can be explained in part by higher rates of female employment in textile and service industries. Fertility is most strongly associated with textile employment where employment would have prevented active childrearing. But there is a significant impact among service workers as well. The arrival of textile mills increased demand for female-provided services such as cooking, laundering, growing small amounts of crop and livestock, and boarding. These occupations were dominated by African American females and this indirect effect can explain the reduction in fertility among this population.
In addition, the observed difference in fertility for migrants relative to natives is consistent with a different cost of children explanation: the costs of child care. For natives in industrialized locales, extended family could have served as a backstop for childcare. But for migrants, this option was not available. Childcare in the mills was sporadically supplied, and most families would have relied on household members for this service. The lack of extended family members to perform this task would have resulted in an increase in the cost of raising children for migrants relative to natives and may have been another cause of the observed fertility differential.Footnote 35
The available data also suggest an increase in population density as an important factor in inducing lower fertility. In the township results of Table 3, controlling for the town population percentage of a township reduces the coefficient on the industrialization proxy in column 5 by 29 percent for townships industrialized after 1895 and by 18 percent for those industrialized before that date.
On the other hand, there is little evidence that child human capital or quality/quantity tradeoff concerns drove fertility reduction. Textile mills relied on low-skilled operatives, and there is no indication that textile manufacturing increased the return to human capital or incentivized parents to invest in child quality over quantity.Footnote 36 A variant of the original quality/quantity hypothesis focuses on the potential impact of an increase in income on parental preference for quality over quantity. But this also has little support in the data as indicators for male occupational status (a proxy for household income) have a muted correlation with fertility in comparison to those for female occupational status (a proxy for both household income and the opportunity cost of female time) in Table 6.
Finally, a decrease in the labor opportunities of children is an improbable mechanism in this context. Available sources indicate that children represented a large proportion of workers in Southern mills, even when mills self-reported their employment numbers. Further, child labor legislation was not passed in South Carolina until 1903, well after the period examined in this article. If changes in the labor opportunities of children drove the industrialization results, it must be that mill employment, extensive as it was, was less well renumerated than their previous employment, generally as farm laborers. This is a questionable assumption, in part because children, with their smaller and more dextrous hands, were actually better suited for some mill tasks than were adults.
I conclude that increases in child mortality, the opportunity cost of female time, and in other costs of raising children, including those resulting from increased population density, are the most likely explanations for lower fertility in South Carolina textile locations.
CONCLUSION
Fertility decline in the nineteenth-century United States has often been attributed to a quickening pace of industrial activity. I exploit the fact that South Carolina's industrial experience between 1881 and 1900 can be proxied by the textile industry in particular and evaluate the impact of the establishment of a textile mill on rural, marital fertility rates in South Carolina. Using a difference-in-difference approach, I estimate a 6 to 10 percent reduction in fertility following textile mill establishment.
In order to evaluate potential mechanisms to explain this result, I build a household data sample. I use the location of male heads of household at two points in time to measure migration and show that migrants exhibited substantially lower fertility than natives in industrial townships. Observing that migrating households were also more likely to be employed in the textile industry, I argue that an increase in the costs of raising children, including a heightened opportunity cost of female time, led to lower household fertility in mill locations. I hypothesize that the separation of migrating households from their extended families may also have raised the costs of childrearing and resulted in lower migrant fertility in industrial locales. Finally, the results indicate that reductions in child survival rates among migrating industrial workers and increases in population density also contributed to the observed fertility reduction.