

Introduction: The dynamics of the global egg industry since 1990
In this report, the dynamics of global egg production since 1990 and patterns of trade in 2006 will be analysed. This time period was chosen, as the political landscape has changed considerably since the early 1990s, especially because of the political and socio-economic developments in Eastern Europe and the former USSR. Some of the Eastern European countries became members of the EU, several former republics of the USSR became independent countries. The consequence was a restructuring of the regional basis for Europe and Asia in the FAO database. FAO also changed the regional pattern in the Americas which deviates from former patterns and does not reflect the economic situation after the formation of the North American Free Trade Agreement (NAFTA) in 1994. In contrast to FAO, in this report North America means Canada, Mexico and the USA, whereas in FAO statistics under Northern America only data for Canada and the USA are subsumed.
The dynamics of the global poultry industry over the past 17 years has been remarkable. No other branch of animal production has shown comparable growth rates. Poultry meat production increased from 41.0 million tons to 86.8 million or by 112% between 1990 and 2007, global egg production from 35.2 million tons to 62.6 million tons or by 78%. The following analysis will show that the growth has not been homogeneous but that regional shifts occurred which have changed the spatial pattern of egg production and of egg trade considerably. Whereas Asia has become the most dynamic growth centre and is dominating global egg production, Europe and North America have lost in importance.
The main objectives of this report are:
• to present an overview about the development of global egg production between 1990 and 2007,
• to analyse the regional development of egg production between 1990 and 2007 and to identify growth centres as well as regions that fell behind the global dynamics,
• to analyse the patterns of global egg exports and imports on a regional basis and to identify the leading egg exporting and egg importing countries,
• to analyse the trade balances of the sub-regions of the continents and to identify egg surplus and egg deficit regions.
The dynamics of global egg production between 1990 and 2007
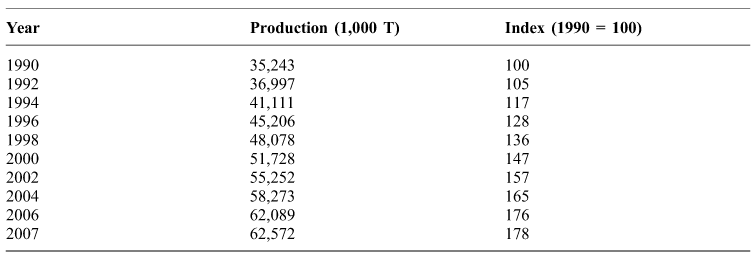
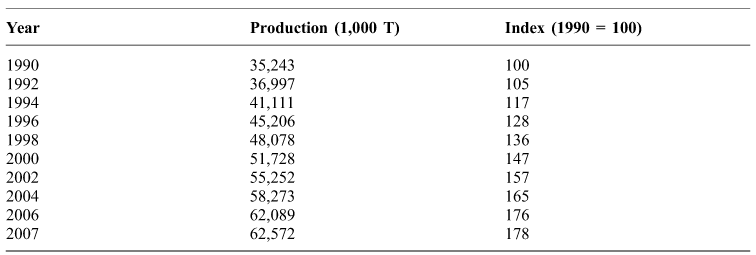
Global egg production increased from 35.2 million tons in 1990 to 62.6 million tons in 2007 or by 78%. Table 1 shows that growth rates were comparatively high in the early and middle 1990s and between 2004 and 2006. Recent growth rates are much lower. This may be a result of higher production costs because of the dramatic increase of feedstuff prices and higher food costs. What impacts the financial crisis in the last quarter of 2008 may have on egg production and egg trade is a still open question. It will, however, definitely slow down the speed of the transformation process from conventional to enriched cages in the EU.
The development of global egg production between 1990 and 2007 (Source: FAO database).
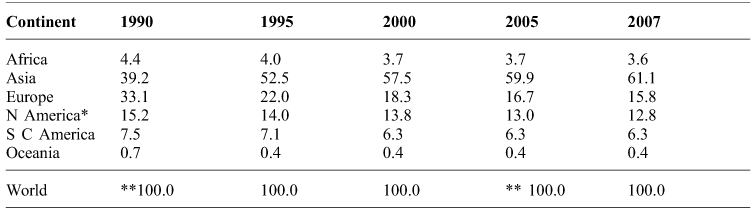
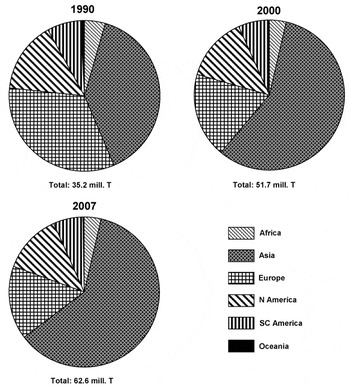
The dramatic spatial shift in global egg production can best be seen from the data in Table 2. In 1990, Asia was already in a leading position with a share of 39.1%, but European countries still contributed almost one third to the global production volume, followed by North America with 15.2%. In the following 17 years, Europe lost more than half of its former share, North America about one fifth and South and Central America one sixth. In the same time period, Asia became the dominating region with a share of 61.1% in 2007 (Figure 1). More details about the dynamic development in Asia can be found in the special report for the IEC Shanghai conference (Windhorst Reference WINDHORST2008a).
The changing contribution of the continents to global egg production between 1990 and 2007; data in% (Source: FAO database).
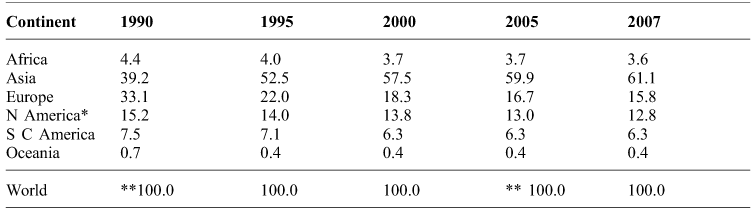
* North America: Canada, Mexico, USA ** sum does not add because of rounding
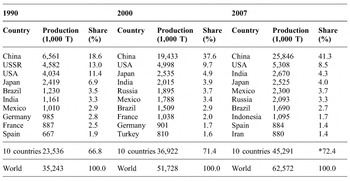
To get a better insight into the spatial dynamics of global egg production, one has to go down to the country level. In 1990, China, the USSR and the USA were the three leading egg producing countries. They contributed 43% to the global production volume. Three European countries, Germany, France and Spain, ranked as numbers 8 to 10. Ten years later, China and the USA ranked in the top two positions. China had more than tripled its production volume and more than doubled its contribution to global egg production. Spain had lost its position among the top ten countries and been substituted by Turkey. Mexico surpassed Brazil and ranked on sixth place. The dramatic growth of egg production in Asia can best be seen from the fact that four of the top ten egg producing countries were located in this continent in 2007. Almost 50% of the global production volume was concentrated in China, India and Japan. Table 3 also documents the fact that Europe has been continuously losing ground. Whereas in 1990 three countries ranked among the top ten, in 2007, only Spain was left with a share of 1.4%. It is obvious that the dominating role of Asia in global egg production is mainly a consequence of the remarkable dynamics in China. But egg production also increased considerably in India and Indonesia.
The changing contribution of the continents to global egg production in 1990, 2000 and 2007 (Source: FAO database).

The ten leading countries in egg production in 1990, 2000 and 2007 (Source: FAO database).

* sum does not add because of rounding
A closer look at the absolute growth rates further documents this regional shift. Between 1990 and 2007, global egg production increased by 27.3 mill. t. About 19.3 million tons or 70.6% of the absolute growth were contributed by China, 1.5 million tons or 5.5% by India, 2.5 million tons or 9.4% by the USA and Mexico. In Europe, countries with the highest production decrease were Germany (- 185,000 t), France (- 120,000 t) and Hungary (- 95.000 t).
The main results of the first step of this analysis can be summarised as follows:
• Global egg production increased by 27.3 million tons between 1990 and 2007 and reached a production volume of 62.6 million tons.
• Within the analysed time period, a remarkable regional shift of egg production can be observed. Whereas Asia became the dominating egg producing continent, Europe and North America had to face severe losses of their production shares.
• More than 75% of the absolute growth of global egg production between 1990 and 2007 were contributed by China and India. Germany, France and Hungary were the three European countries with the highest decrease of their production volumes.
Dynamics of egg production – a regional perspective
In the following chapter, this analysis will deal with the regional dynamics of egg production. The analysis will be carried out on two levels, sub-regions of the continents and individual countries. The single continents will be analysed according to their contribution to the global production volume.
Regional patterns of egg production in Asia
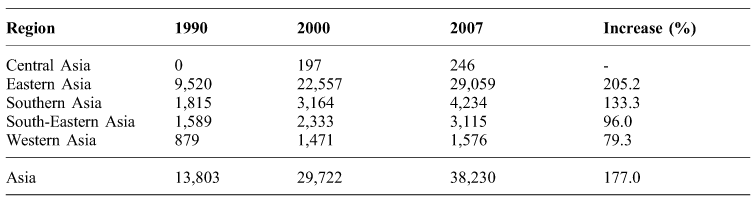
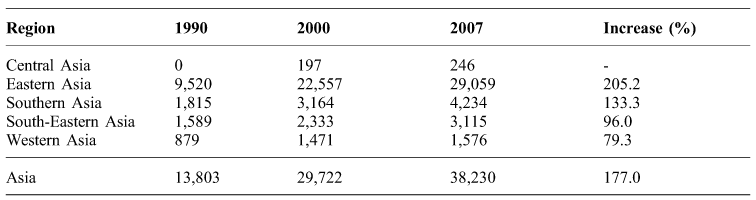
Egg production in Asia increased from 13.8 million tons to 38.2 million tons or by 177% between 1990 and 2007. From the data in Table 4 one can easily see that Eastern Asia is the centre of egg production. The contribution of this sub-region to the overall production volume of Asia increased from 69% in 1990 to 76% in 2007. In spite of absolute growth, all other sub-regions lost market shares. A closer look at the absolute and relative growth rates shows that the production volume increased by 24.4 million tons in the analysed time period. It is not surprising that the countries in Eastern Asia contributed 80% to this increase.
Regional development of egg production in Asia between 1990 and 2007; data in 1,000 t (Source: FAO database).
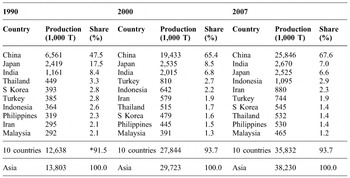
The analysis of the development of egg production in the ten leading countries between 1990 and 2007 shows (Table 5) that the regional concentration increased from 91.5% to 93.7%. The composition of the top ten egg producing countries did not change in the analysed time period. This is not true, however, for the ranking. India surpassed Japan and ranked on second place in 2007. Indonesia gained several places and ranked as number 4. On the other hand, Thailand could not maintain its position because of the impacts of the Avian Influenza outbreaks; the same is true for South Korea. Egg production in Iran almost tripled; rank 5 among the leading countries was the result. The dominating role of China is obvious. More than two thirds of the Asian production volume were concentrated in this country in 2007. China, India, Indonesia and Iran contributed 90% to the absolute production increase of 24.4 million tons, China alone 19.3 million tons or 79%.
The ten leading countries in egg production in Asia in 1990, 2000 and 2007 (Source: FAO database).

* sum does not add because of rounding
Regional patterns of egg production in the Americas
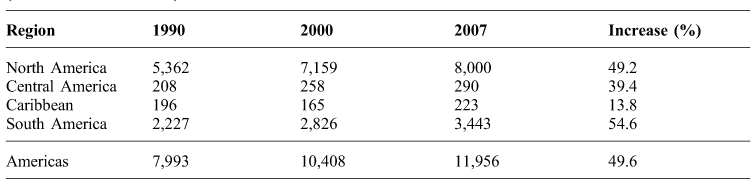
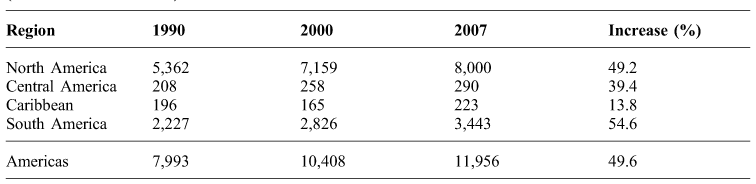
Egg production in the Americas increased from almost 8 million tons in 1990 to 11.9 million tons in 2007 or by 496%. The regional classification differs from FAO statistics, as in this report Mexico is counted under North America and not under Central America. From the data in Table 6 one can see that the three NAFTA member countries contributed 66.9% to the production volume of the Americas, followed by South America with 28.8%. Relative growth rates were highest in the analysed time period in South America with 54.6%, followed by North America with 49.2%. The three North American countries contributed, however, exactly two thirds to the absolute growth of 3.9 million tons South American countries 1.2 million tons or 31%.
Regional development of egg production in the Americas between 1990 and 2007; data in 1,000 t (Source: FAO database).
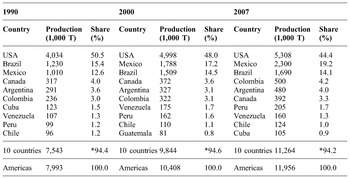
To better understand the time-spatial dynamics, it will be necessary to go to the country level. The data in Table 7 show that the regional concentration remained fairly stable in the analysed time period. The composition of the ten leading egg producing countries did not change with the exception that in 2000 Guatemala replaced Cuba, but the ranking in 2007 differed considerably from that in 1990. Only the USA and Argentina occupied the same ranks in these years.
The ten leading countries in egg production in the Americas in 1990, 2000 and 2007 (Source: FAO database).

* sum does not add because of rounding
From the data in Table 7 one can easily see that the USA in spite of an absolute increase of their production volume (+ 1.27 million tons) lost market shares. Whereas they contributed 50.5% to egg production of the Americas in 1990, their share was reduced to 44.4% in 2007. In contrast, Mexico, ranked as number 2, was able to expand its contribution from 12.6% to 19.2% in the same time period, a result of the absolute increase of egg production by 1.3 million tons. Canada fell from rank 4 to rank 6; Cuba, Venezuela, Peru and Chile changed positions but remained on ranks 7 to 10. The USA, Mexico and Brazil contributed 76.3% or 3 million tons to the absolute increase of egg production between 1990 and 2007. Mexico and the USA alone almost 2.6 million tons or 64.7%. It is obvious that Mexico's egg industry showed a remarkable development in the analysed time period.
Regional patterns of egg production in Europe
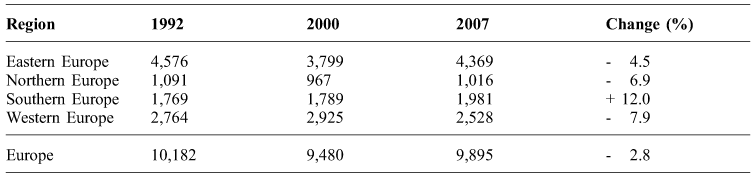
Because of the socio-economic changes in Eastern Europe and the USSR since 1990, a comparison of the regional patterns of egg production in 1990 and 2007 was not possible; therefore data for 1992 will be compared to those of 2000 and 2007 (Table 8).
Regional development of egg production in Europe between 1992 and 2007; data in 1,000 t (Source: FAO database).

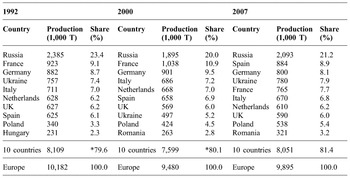
Egg production in Europe decreased from 10.2 million tons in 1992 to 9.9 million tons in 2007 or by 2.8%. As can be seen from the data in Table 8, Western Europe showed the highest decrease. This development is a result of Avian Influenza outbreaks in several countries, which at least for some time led to a lower per capita consumption, as well as of the beginning adaption process to the banning of conventional cages from 2012 on, in Germany and Austria from 2009 on. The second highest relative decrease showed Northern European countries with 6.9%. The highest absolute losses could be observed in the United Kingdom, Estonia, Finland and Denmark; on the other hand, egg production increased in Latvia and Lithuania. The development in Eastern European countries differed considerably. Whereas in Russia egg production decreased by 292,000 t in the analysed time period, Poland showed an increase of 198,000 t. This explains the comparatively low relative decrease by 4.5%. The only sub-region with a positive development was Southern Europe. Here, too, the dynamics differed between single countries. Whereas in Italy because of the Avian Influenza outbreaks egg production decreased by 41,000 t, Spain showed a remarkable absolute growth of 259,000 t (Table 9).
A closer look at the composition and ranking of the ten leading countries in egg production reveals that with the exception of Hungary, which was replaced by Romania, the leading countries in 1992 and 2007 were identical. The regional concentration increased from 79.6% in 1992 to 81.4% in 2007. Russia ranked on first place over the whole time period but lost market shares. The same is true for all other top ranked countries with the exception of Spain, Poland and the Ukraine. Spain climbed from rank 8 in 1992 to rank 2 in 2007, a result of the remarkable increase in the production volume, whereas France fell from second to fifth place. Germany is still ranked as number 3, but it will hardly be able to keep this rank if one considers the recent dynamics in the Ukraine and the fact that conventional cages will be prohibited from 2009 on and the necessary transformation process could not be completed by the end of 2008.
The ten leading countries in egg production in Europe in 1992, 2000 and 2007 (Source: FAO database).

* sum does not add because of rounding
Regional patterns of egg production in Africa
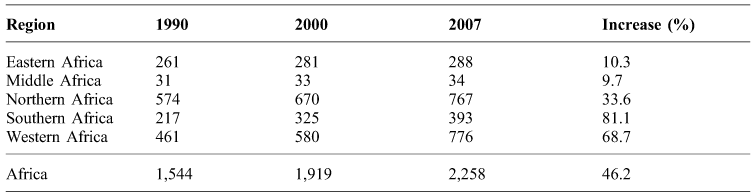
Egg production in Africa increased from 1.5 million tons to 2.3 million tons or by 46.2% between 1990 and 2007. From the data in Table 10 one can see that the highest absolute growth was to be found in Western Africa with 316,000 t, the highest relative growth with 81.1% in Southern Africa. The dynamics of egg production was very low in Eastern and Middle Africa. In these two sub-regions, egg production increased by only 30,000 t in the analysed time period. Political instability, lack of capital, insufficient per capita income and a low development status are the main steering factors. Here, too, a closer look at the dynamics in the single countries will be necessary to better understand the regional differences.
Regional development of egg production in Africa between 1990 and 2007; data in 1,000 t (Source: FAO database).
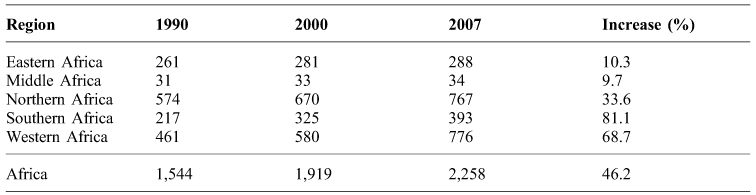
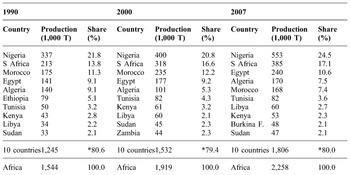
Table 11 shows that the regional concentration remained fairly stable over the analysed time period even though the share of Nigeria and South Africa which ranked as numbers 1 and 2 increased from 35.6% in 1990 to 41.6% in 2007. This reflects the fact that these two countries contributed 388,000 t or 54.4% to the absolute growth of egg production between 1990 and 2007. In all other African countries egg production increased much slower. A closer look at the composition and ranking of the ten leading countries shows that there were only minor changes in the composition. Between 1990 and 2000 Ethiopia was substituted by Zambia, and between 2000 and 2007 Zambia was replaced by Burkina Faso. Morocco, Egypt and Algeria changed places, but remained on positions 3 to 5. It is worth mentioning that all six countries which belong to the sub-region Northern Africa were ranked under the top ten egg producing countries in 2007. Together they contributed 33.9% to the overall production volume.
The ten leading countries in egg production in Africa in 1990, 2000 and 2007 (Source: FAO database).

* sum does not add because of rounding
Regional patterns of egg production in Oceania
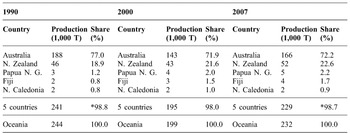
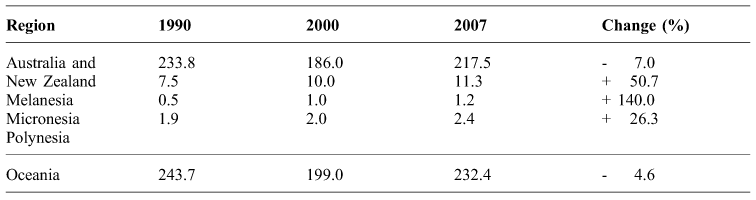
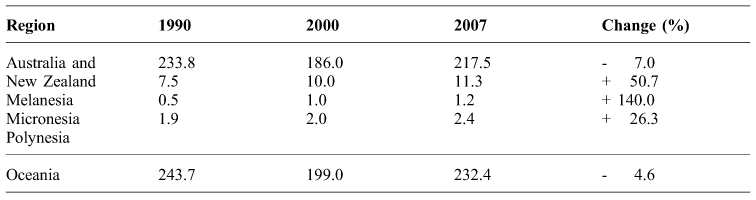
Oceania only contributed 0.4% to global egg production in 2007. Almost 95% of the production volume were concentrated in Australia (72.2%) and New Zealand (22.6%). Production in the other sub-regions was only of minor importance as can be seen from the data in Table 12. Between 1990 and 2007 the production volume decreased from 243,700 t to 232,400 t or by 4.6%. This reflects the fact that egg production in Australia fell from 188,000 t in 1990 to only 166,000 t in 2007. In New Zealand and the other sub-regions the production volume increased.
Regional development of egg production in Oceania between 1990 and 2007; data in 1,000 t (Source: FAO database).

From Table 13 one can see that the composition and ranking of the five leading countries did not change between 1990 and 2007. The dominating role of Australia is obvious and also the extremely high regional concentration. Because of the peripheral location and the low population, egg production will not change very much within the coming years.
The five leading countries in egg production in Oceania in 1990, 2000 and 2007 (Source: FAO database).
* sum does not add because of rounding
The main results of the second part of the analysis can be summarised as follows:
• In Asia, the sub-region Eastern Asia was the centre of egg production in 2007, contributing 76% to the overall production volume of this continent. The dynamic development of egg production in China is unparalleled.
• In the Americas, the three NAFTA member countries contributed almost 67% to the production volume. Mexico showed a very dynamic development of its egg industry.
• In Europe, egg production fell by 0.3 million tons or 2.8% between 1990 and 2007. The highest relative decrease showed Western and Northern European countries, the highest absolute decrease Russia. Egg production in Spain and Poland, on the other hand, grew considerably.
• In Africa, egg production showed a comparatively high relative growth rate of over 46% in the analysed time period. The absolute growth, however, reached only 0.7 mill. t. All Northern African countries ranked among the top ten egg producing countries of this continent.
• Oceania only contributed 0.4% to the global production volume in 2007. The regional concentration is extremely high. Australia and New Zealand contributed nearly 95% to overall egg production of this continent.
Patterns of global egg trade in 2006
The third part of this analysis will give an overview about the global patterns of egg trade. In contrast to the first part, trade patterns in 2006 will not be compared with those in 1990 or 2000 as the data can be reviewed in preceding reports by this author (c.f. Windhorst Reference WINDHORST2006).
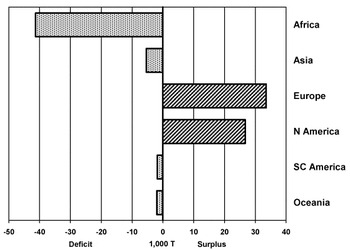
From the data in Table 14 one can see that about 1.2 million tons of shell eggs or 2% of global production were traded in 2006. Europe dominated egg trade with a share of 68.3% of egg exports and 66.1% of egg imports. Asia was in second position contributing 22.7% to the global export volume and 22.3% to the import volume. Table 14 also shows that Europe and North America had a considerable egg surplus whereas Africa showed the highest egg deficit (Figure 2). It is worth mentioning that about 90% off the global shell egg trade are concentrated in Europe and Asia. A third sub-centre is trade among the NAFTA member countries.
Egg exports and egg imports by continents in 2006 (Source: FAO database).

* North America: Canada, Mexico, USA
Trade balance for shell eggs in 2006 by continents (Source: own calculations).

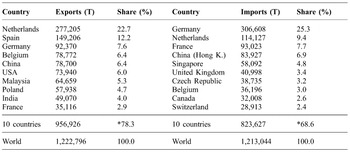
The dominating role of European countries in global egg trade can best be seen from the composition and ranking of the ten leading egg exporting and importing countries (Table 15). Six of the top ranked exporting countries in 2006 were located in Europe and also seven of the leading importing countries. The Netherlands contributed 22.7% to the global export volume and Germany imported 25.3% of the eggs which reached the global market. It is worth mentioning that in spite of a high egg deficit Germany is also one of the leading egg exporting countries. Most of the eggs are exported to the Netherlands where the egg products industry is purchasing eggs that cannot be sold as table egg because of cracks, blood spots etc. This also explains why the Netherlands are located in second place behind Germany among the top ten egg importing countries. Between these two countries a very intensive egg trade has developed over the past decades. A similar situation can be observed in Asia between Singapore and Malaysia. When Singapore decided years ago to abolish any form of poultry production Malaysia stepped in as the leading supplier of eggs (c.f. Windhorst Reference WINDHORST2008a, b).
The ten leading egg exporting and egg importing countries in 2006 (Source: FAO database).

* sum does not add because of rounding
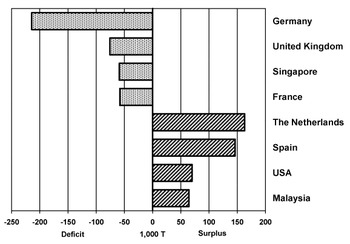
Countries with the highest egg deficit or egg surplus in 2007 (Source: own calculations).

A comparison of the export and import volumes shows (Figure 3) that countries with the highest egg surplus in 2006 were the Netherlands (+ 163,078 t), Spain (+ 146,395 t), the USA (+ 70,221 t) and Malaysia (+ 64,468 t). The highest egg deficits were to be found in Germany (- 214,238 t), the United Kingdom (- 75,672 t), Singapore (- 58,894 t), and France (- 57,967 t).
The main results of the third step of this analysis can be summarised as follows:
• In 2006, about 1.2 million tons of shell eggs were traded worldwide.
• European countries dominated egg exports as well as egg imports with a share of 68% respectively 66%.
• The highest egg surplus showed Europe and North America, the highest egg deficit Africa.
• The Netherlands were the leading egg exporting country with a share of almost 23% of the global export volume.
• Germany was the leading egg importing country with a share of over 25% of the global import volume.
Regional patterns of egg trade in 2006
In a fourth step, regional patterns of egg trade will be analysed for 2006. The analysis will also be carried out on two regional levels, sub-regions of the continents and individual countries. The single continents will be analysed according to their contribution to global egg trade. For the sub-regions the trade balances will be calculated.
Regional patterns of egg trade in Europe
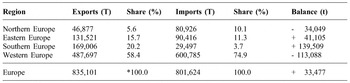
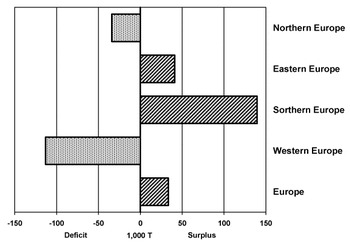
In 2006, over 835,000 t of shell eggs were exported by European countries and almost 602,000 t were imported by them (Table 16). European countries contributed 68.3% to the global export volume and 66.1% to the import volume. It is obvious that egg trade between European countries is of utmost importance from a global perspective. The data in Table 16 show that Western European countries dominated egg exports as well as egg imports in 2006. It is remarkable that almost 75% off all imports had a Western European country as their destination. Southern European countries ranked second among the sub-regions regarding exports. This region also showed the highest egg surplus with 139,509 t. On the other hand, the egg deficit was highest in Western Europe with 113,088 t. The overall balance shows that the surplus was comparatively low with only 33,477 t (Figure 4). It can be expected that this deficit will further increase in 2009 when German egg producers have to give up egg production in conventional cages and in 2012 when this will be the case for all EU member countries. Then, the EU will no longer be an egg surplus region but will have to import considerable amounts of eggs to meet the demand in the member countries with high deficits.
Egg exports from and egg imports into Europe in 2006 (Source: FAO database).

* sum does not add because of rounding
Trade balance for shell eggs in the sub-regions of Europe in 2006 (Source: own calculations).

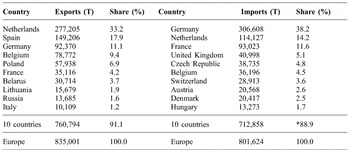
In 2006, the regional concentration of egg trade in Europe was very high, as can be seen from Table 17. The ten leading countries contributed over 91% to the export volume, the Netherlands and Spain alone more than 51%. The same is true for egg imports. Here, almost 90% of all eggs were imported by the ten leading countries, more than 52% by Germany and the Netherlands. The close trade relations between Germany and the Netherlands were already mentioned in the preceding chapter. It will be of great interest to further monitor the development of egg exports and egg imports in Europe because of the banning of conventional cages in the EU (see also Windhorst Reference WINDHORST2008c). Our institute developed scenarios for possible impacts of the banning of conventional cages in Germany in 2009. If the administration should really enforce the law which prohibits conventional cages from January 1st, 2009 on, Germany will have to import in addition to the already imported 5.7 billion shell eggs another 6 to 7 billion eggs as it will not be possible to install either Kleingruppenhaltungen (colony nests) or barn respectively free range systems within the next year for about 25 million layers. For this transformation process 612million € will have to be invested. Apart from the problem to get this money from the banks it will not be easy to receive building permits for large units. It is still an open question were the additional egg could come from as the egg surplus in Europe will not be able to meet this demand. Rising egg prices for the consumers or a sharp decrease of egg consumption might be the result.
The ten leading European countries in egg exports and egg imports in 2006 (Source: FAO database).

* sum does not add because of rounding
Regional patterns of egg trade in Asia
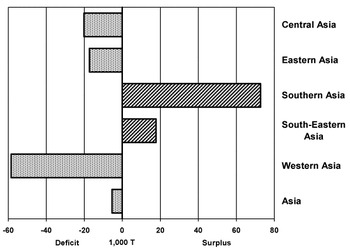
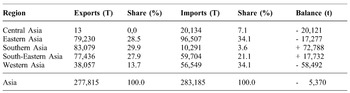
Asia ranked second behind Europe in egg exports and imports in 2006. Asian countries contributed about 23% to the global export and import volumes. From Table 18 one can see in contrast to Europe, no sub-region is dominating exports. Southern, Eastern and South-Eastern Asia contributed almost the same amount to the total export volume, followed by Western Asia. The regional concentration is higher in egg imports. Here, countries in Eastern and Western Asia had a share of 34% each, followed by South-Eastern Asia. Egg surplus was highest in Southern Asia with 72,788 t, egg deficit with 58,492 t in Western Asia (Figure 5).
Trade balance for shell eggs in the sub-regions of Asia in 2006 (Source: own calculations).

Egg exports from and egg imports into Asia in 2006 (Source: FAO database)

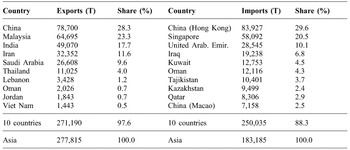
A closer look at the export and import patterns at the country level shows (Table 19) that the regional concentration of egg exports was very high in Asia in 2006. The ten leading countries contributed almost 97.6% to the overall export volume, the four top ranked countries almost 81% with China and Malaysia in leading positions and a share of over 51%. India ranked in third place and has become one of the leading egg and egg products exporting countries over the past years (see also Windhorst Reference WINDHORST2008a, b). Besides Hong Kong and Singapore, countries in Western and Central Asia ranked among the top egg importing countries.
The ten leading Asian countries in egg exports and egg imports in 2006 (Source: FAO database).

The regional concentration in imports is much lower than in exports even though over 50% of the imports went to the top ranked two countries. It will be of great interest to further monitor the development in China. Will the increasing purchasing power of a growing middle class lead to higher egg and egg products consumption or will it lead to a preference of meat, fruits and vegetables? If egg consumption should further increase, China might easily be confronted with the problem of supplying sufficient feed for animal production, in particular when the perspectives for meat consumption are considered. It is worth mentioning that Japan does not play a major role in egg imports. Besides hatching eggs Japan imports mainly egg products.
Regional patterns of egg trade in the Americas
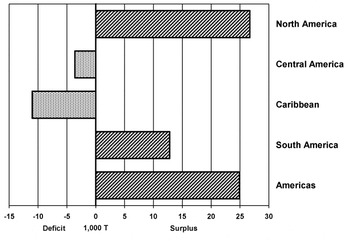
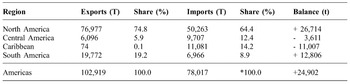
Besides Europe and Asia, a third cluster of egg trade developed in North America, even though the trade volume was much smaller than in the two other continents (see also Windhorst Reference WINDHORST2008d). In 2006, American countries contributed 6.3% to global egg exports and had a share of 4.1% of egg imports. From Table 20 one can see that the three North American countries dominated egg exports with a share of 77.8% and also egg imports with 64.4%. In exports, South American countries ranked second, in egg imports Caribbean countries with a share of 14.2%. Egg surplus was highest in North America with 26,714 t followed by South America, egg deficit reached the highest value with 11,007 t in the Caribbean (Figure 6).
Egg exports from and egg imports into the Americas in 2006 (Source: FAO database).

* sum does not add because of rounding
Trade balance for shell eggs in the sub-regions of the Americas in 2006 (Source: own calculations).

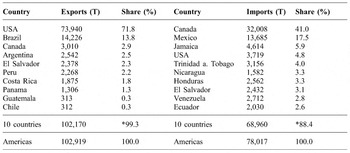
The regional concentration of egg exports was extremely high in the Americas in 2006. As can be seen from Table 21, over 99% of the egg exports were contributed by the ten leading countries. The USA dominated exports with a share of 71.8%, followed by Brazil with 13.8%. All other countries were of minor importance. The regional concentration of egg imports was lower but nevertheless reached 88.4%. Canada and Mexico occupied ranks one and two; together they had a share of 58.5%.
The ten leading American countries in egg exports and egg imports in 2006 (Source: FAO database).

* sum does not add because of rounding
The trade balance of the USA showed a surplus of more than 70,000 t. On the other hand, the deficit of Canada was as high as 29,000 t and that of Mexico reached almost 14,000 t. Both countries imported eggs mainly from the USA. Brazil exported eggs to several South American and Caribbean countries. It will be of interest to further monitor the development of egg exports from the USA. The California referendum on the banning of conventional cages from 2015 on may have impacts on egg exports because of the expected reduction of egg production in California. It may be necessary to ship eggs from the surplus states in the Midwest and the Central Great Plains to California in order to meet the demand in that state. This could reduce the surplus of the USA and result in lower export volumes.
Regional patterns of egg trade in Africa
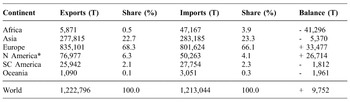
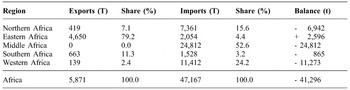
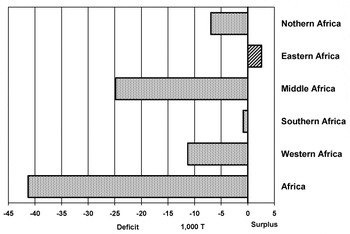
In 2006, Africa was the continent with the highest egg deficit. It was as high as 41,296 t. Nevertheless, this continent shared only 3.9% of the global import volume. From the data in Table 22 one can easily see that countries in Middle Africa and Western Africa showed the highest deficit. Eastern African countries had a surplus of almost 2,600 t (Figure 7). In total, the traded volumes were very small compared to Europe and Asia. Political instability, lack of capital and of know how, a very low buying power and an insufficient infrastructure were the main steering factors behind this situation. Self subsistence animal production is still playing a major role in many African countries.
Egg exports from and egg imports into Africa in 2006 (Source: FAO database).

Trade balance for shell eggs in the sub-regions of Africa in 2006 (Source: own calculations).

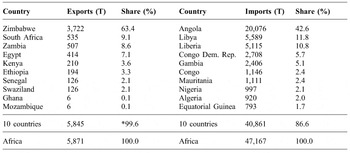
In Africa, the regional concentration of egg exports was also extremely high in 2006 (Table 23). The ten leading countries contributed 99.6% to the export volume, Zimbabwe alone 63.4%. The volume of traded eggs is, however, very low. Zimbabwe may not be able to keep its leading position in future because of the political instability and the weak economic situation. Almost two thirds of the imported eggs went to Angola, Libya and Liberia. The future development of African egg trade will depend on several steering factors, among others, the control of Avian Influenza outbreaks and the future economic development. Political instability, lack of capital and a low educational level will on the other hand limit economic progress in many countries.
The ten leading African countries in egg exports and egg imports in 2006 (Source: FAO database).

* sum does not add because of rounding
Regional patterns of egg trade in Oceania
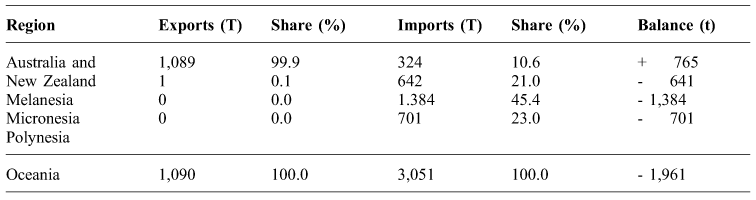
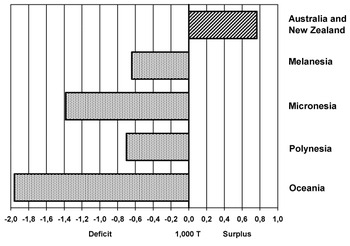
The peripheral location, long transportation distances and a low domestic population explain the fact that Oceania was playing only a minor role in egg exports and imports in 2006. Table 24 shows that besides Australia and New Zealand no other country was of any importance in egg exports. All other regions showed egg deficits (Figure 8).
Egg exports from and egg imports into Oceana in 2006 (Source: FAO database).
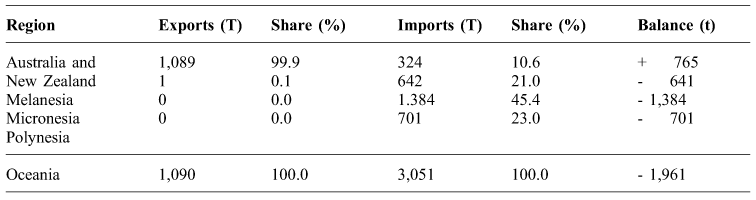
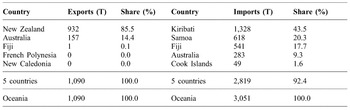
From the data in Table 25 one can see that New Zealand exported 932 t of eggs in 2006, followed by Australia. Kiribati was the leading egg importing country, followed by Samoa and Fiji. It cannot be expected that the present regional pattern will change considerably during the next years. The small domestic markets and long transportation distances to the egg deficit regions in Asia will limit further investments in egg production.
Trade balance for shell eggs in the sub-regions of Oceania in 2006 (Source: own calculations).

The five leading countries in Oceania in egg exports and egg imports in 2006 (Source: FAO database).

The main results of the fourth step of the analysis can be summarised as follows:
• In 2006, European countries dominated global egg exports and egg imports. The Netherlands and Spain were the leading exporting countries, Germany and the Netherlands the leading importing countries.
• Asia ranked second in egg trade. China and Malaysia contributed over 50% to the export volume, Hong Kong and Singapore shared half of the imports.
• A third cluster of egg trade has developed in North America. In 2006, the USA were the leading egg exporting country, Canada and Mexico had to import eggs. It is obvious that the formation of NAFTA has played an important role in these trade relations.
• In South America, Brazil shows the highest egg surplus. Most of the exports go to other countries in Latin America.
• Africa has the highest egg deficit of all continents; nevertheless, trade volumes are low compared to Europe and Asia.
Perspectives
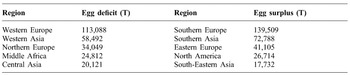
In a final step, the leading egg surplus and egg deficit regions for 2006 will be compared. Table 26 shows that Western Europe was the region with the highest egg deficit. Over 113,000 t had to be imported by countries in this region. It was the most attractive market for shell eggs, with Germany in a leading position. Over 25% of all shell eggs that were traded worldwide were imported by this country. The second major market for shell eggs was Western Asia. Here, the United Arab Emirates, Iraq, Kuwait and Oman were the main egg importing countries. Other important egg deficit regions were Northern Europe, in particular the United Kingdom, Middle Africa with Angola as the leading importer, and Central Asia with Tajikistan and Kazakhstan.
The highest egg surplus showed Southern Europe with 139,509 t. Here, Spain was the leading egg exporting country. Southern Asia ranked second with India and Iran as major exporters. Another egg surplus region was Eastern Europe with Poland and Belarus as leading egg exporting countries. In North America, the USA had the highest surplus, in South-East Asia Malaysia and Thailand.
The five leading regions in egg surplus and egg deficit in 2006 (Source: Own calculations).

It can be expected that the recent spatial pattern of egg trade will not change very much in the near future. Egg trade will be dominated by European countries, most of the trade will, however, be intra-EU trade. The banning of cages in the EU could even make higher imports from adjacent non-EU countries necessary. A second cluster of egg trade will be located in Asia with Southern and South-Eastern Asia as surplus and Western as well as Central Asia as deficit regions. The third cluster will be the NAFTA member countries with the USA as exporting and Canada and Mexico as importing countries. It is still difficult to give a perspective for the future role of Brazil. At the present time this country seems to concentrate on meat production and meat exports.