



1. Introduction
Submerged jets (i.e. liquid-in-liquid or gas-in-gas jets) are widely used in technological processes. The stability of jets and the transition to turbulence play an important role in many applications. It is believed that submerged laminar jets are unstable in practice because of their low critical Reynolds number, which does not exceed 40. In fact, such jets have a relatively small region (of the order of 1–2 orifice diameters in length) in which they retain a laminar structure. For this reason, it is extremely difficult to experimentally study the mechanisms of perturbation growth in the laminar region using conventional jets. The understanding of such mechanisms would definitely shed light on the roots of the laminar–turbulent transition and provide well-grounded control strategies for the transition.
Recently, the situation has changed, as the set-up described by Zayko et al. (Reference Zayko, Teplovodskii, Chicherina, Vedeneev and Reshmin2018) creates submerged air jets with an essentially longer laminar region,  $5D$ and more in length, where
 $D$ is the orifice diameter. Using this facility, the analysis of small sinusoidal perturbations was performed, and the experimentally measured wavelengths of growing perturbations, the amplification curves, and the radial distributions of perturbations agreed with the numerical values obtained using the modal stability theory (Gareev et al. Reference Gareev, Zayko, Chicherina, Trifonov, Reshmin and Vedeneev2022).
The goal of the present investigation was to study the non-modal development of disturbances in a submerged jet. It is well known that in addition to the modal linear growth mechanism in near-wall flows, there are two non-modal linear growth mechanisms (Farrell & Ioannou Reference Farrell and Ioannou1993): the Orr mechanism and the ‘lift-up’ mechanism. While the first is a purely two-dimensional process and leads to a relatively weak growth, the second, ‘lift-up’, gives a much stronger growth of three-dimensional disturbances and is responsible for the bypass transition in near-wall flows. The following review outlines the current state of this field.
1.1. Theoretical studies of non-modal growth
The first theoretical papers on non-modal growth and the ‘lift-up’ mechanism were published about 40 years ago (Ellingsen & Palm Reference Ellingsen and Palm1975; Landahl Reference Landahl1980). Non-modal growth for viscous laminar flows was studied in the context of the non-Hermitianity of the operators of linearized equations (the Orr–Sommerfeld and Squire equations in the case of a plane-parallel base flow) by Butler & Farrell (Reference Butler and Farrell1992). Optimal temporal perturbations (i.e. the perturbations that grow most rapidly for a given wavenumber) of Poiseuille flows in pipes were studied by Schmid & Henningson (Reference Schmid and Henningson1994). They showed that perturbations, which are independent of the axial coordinate, achieve the greatest non-modal growth. They also demonstrated that the maximum perturbation energy in this case is proportional to the square of the Reynolds number:  $G_{max} \sim Re^2$. A study of the development of spatial optimal perturbations (i.e. perturbations that are most amplified at a given distance for a given frequency) for a pipe flow was performed by Reshotko & Tumin (Reference Reshotko and Tumin2001). In order to regularize the problem, they considered only downstream-travelling perturbations. The results indicated that the largest non-modal growth in a round pipe occurs for stationary perturbations.
The development of non-modal perturbations in boundary layers and their comparison with experiment were theoretically studied by Andersson, Berggren & Henningson (Reference Andersson, Berggren and Henningson1999) using linearized boundary layer equations. They proposed an empirical relationship that relates the level of turbulence of the external flow and the transitional Reynolds number. It is known that in the case of an increased level of turbulence of the external flow, the  $e^N$ method based on the modal theory cannot be used. Andersson et al. (Reference Andersson, Berggren and Henningson1999) proceeded from the assumptions that the perturbation energy grows at an optimal rate, the initial perturbation amplitude is proportional to the turbulence level of the external flow and the transition occurs when a certain perturbation energy level is reached. Using these assumptions, they obtained a model with one parameter, which, based on experimental data, was assumed to be constant. The model obtained by the authors predicts the ‘bypass’ transition with good accuracy for external flow turbulence levels of 1 %–5 %. Tumin & Reshotko (Reference Tumin and Reshotko2001) made a similar analysis, but using the full Navier–Stokes equations in the plane-parallel approximation. The stability of the boundary layer to non-modal perturbations in the limit of large Reynolds numbers was studied by Luchini (Reference Luchini2000); he noted, as did Andersson et al. (Reference Andersson, Berggren and Henningson1999), that in the case of large Reynolds numbers, the maximum energy gain is proportional to the square of the displacement-thickness Reynolds number. These studies led to the conclusion that in the boundary layer, the optimal perturbations in the initial station
 $x_{in}$ are longitudinal vortices, which develop towards the final station
 $x_{out}$ into streamwise streaks, or streaky structures, i.e. defects in the longitudinal speed.
There are many fewer works devoted to non-modal growth in jets and other unbounded flows. Apparently, Boronin, Healey & Sazhin (Reference Boronin, Healey and Sazhin2013) were the first to conduct non-modal spatial analysis of round jets. Although the main goal of their paper was to study two-phase (liquid-in-air) jets, they also presented results on the non-modal spatial growth for two submerged jets for different perturbation frequencies, and the non-modal growth turned out to increase as the frequency decreased.
Jiménez-González, Brancher & Martínez-Bazán (Reference Jiménez-González, Brancher and Martínez-Bazán2015) and Jiménez-González & Brancher (Reference Jiménez-González and Brancher2017) investigated the non-modal temporal stability of round jets. Jiménez-González et al. (Reference Jiménez-González, Brancher and Martínez-Bazán2015) described the dependence of optimal axisymmetric and helical (with azimuthal wavenumber  $n=1$) perturbations on the axial wavenumber. They showed that as the axial wavenumber decreases, non-modal growth increases. The principal features of axisymmetric and helical perturbations resemble Orr and lift-up growth mechanisms of plane-parallel shear flows. In subsequent work, Jiménez-González & Brancher (Reference Jiménez-González and Brancher2017) considered a wider range of azimuthal wavenumbers and temporal diffusion of the base flow. The analysis of
 $n=1$ perturbations within the steady base flow assumption was shown to be unreliable, because the base flow will change at the expected optimal time. However, for
 $n\ge 2$, the optimal times are much smaller, and the results of such an analysis are acceptable.
Recently, the combination of modal and non-modal instabilities was studied by Wang et al. (Reference Wang, Lesshafft, Cavalieri and Jordan2021). Specifically, they analysed the stability of a round jet perturbed by a finite-amplitude optimal perturbation. They showed that the increase of the optimal perturbation amplitude decreases the growth rate of Kelvin–Helmholtz instability. This effect is in agreement with preceding study by Marant & Cossu (Reference Marant and Cossu2018), who analysed the stability of an initially two-dimensional mixing layer perturbed by finite-amplitude optimal perturbations.
A somewhat opposite problem formulation was analysed by Nastro, Fontane & Joly (Reference Nastro, Fontane and Joly2020), who examined optimal perturbations of nonlinearly temporarily evolving Kelvin–Helmholtz instability over a jet flow. They determined that, depending on the velocity profile and azimuthal wavenumber, either an increase or decrease in the optimal energy gain is possible compared with the unperturbed jet flow.
1.2. Experimental studies of non-modal growth
Streaky structures were initially experimentally discovered and studied in near-wall laminar boundary layers, where they are associated with the bypass mechanism of transition to turbulence (Morkovin Reference Morkovin1984). In the case of a low intensity of external flow turbulence, Tollmien–Schlichting waves are generated in the laminar boundary layers (Schlichting Reference Schlichting1979), whose linear development passes into a nonlinear stage, and then leads to the appearance of turbulence. At a higher intensity of external turbulence, longitudinal elongated vortex structures appear in the boundary layer. These are commonly called ‘streaky structures’. Apparently, their existence was first noted by Klebanoff (Kendall Reference Kendall1985). He found that in a laminar boundary layer with a level of free-stream turbulence  ${{>}0.3\%}$, there was a low-frequency perturbation, whose amplitude was an order of magnitude greater than the amplitude of the Tollmien–Schlichting waves. The spatial correlation of the perturbation showed that its transversal size was comparable to the boundary layer thickness. The first detailed experimental studies of streaky structures were performed by Kosorygin et al. (Reference Kosorygin, Polyakov, Suprun and Epic1984) and Kendall (Reference Kendall1985). In these works, it was confirmed that the spatial structures in the transverse direction have a size of the order of that of the boundary layer. Kendall (Reference Kendall1985) noted that the longitudinal velocity fluctuation grows as the root of the longitudinal coordinate, and when the laminar–turbulent transition is completed, it can reach 10 %. This result was also obtained by Westin et al. (Reference Westin, Boiko, Klingmann, Kozlov and Alfredsson2001), in whose study the level of external turbulence varied from 1 % to 6 %.
Matsubara & Alfredsson (Reference Matsubara and Alfredsson2001) used smoke imaging and hot-wire anemometry measurements to study the streaky structures in the laminar boundary layer. Using correlation analysis, they showed that in the presence of streaky structures in the boundary layer, regions with increased and decreased longitudinal velocity are observed. These regions’ characteristic transverse size is proportional to the displacement thickness  $\delta ^*$. The pattern of the spatial two-dimensional spectrum measured for the longitudinal
 $\alpha$ and transverse
 $\beta$ wavenumbers changes slightly downstream and corresponds to the numerical results of Schmid & Henningson (Reference Schmid and Henningson2001): the maximum of the relative growth of the perturbation energy found in the calculation is reached at
 $\alpha =0, \beta \approx 0.65$, while experiments by Matsubara & Alfredsson (Reference Matsubara and Alfredsson2001) yield
 $\alpha =0, \beta \approx 0.35\unicode{x2013}0.8$.
Fransson, Matsubara & Alfredsson (Reference Fransson, Matsubara and Alfredsson2005) experimentally confirmed the dependence of the perturbation energy  $u^2/U_\infty ^2 \sim Tu^2 Re_x$ (initially proposed by Andersson et al. (Reference Andersson, Berggren and Henningson1999)) on the level of the free-stream turbulence
 $Tu$ and the Reynolds number
 $Re_x = U_\infty x/\nu$. Thus, the amplitude of the velocity disturbances is proportional to the level of natural turbulence and, in accordance with the theory of optimal disturbances, the perturbation energy depends quadratically (as
 $Re_x \sim Re_{\delta ^*}^2$) on the displacement-thickness Reynolds number.
Another approach to the study of streaky structures in laminar boundary layers is associated with the formation of vortex structures by introducing localized controlled perturbations. This was first done by Kozlov's group, and the results of many years of research are reflected in the book by Boiko et al. (Reference Boiko, Grek, Dovgal and Kozlov2002). It was shown that secondary instabilities can arise in streaky and similar vortex structures, which lead to the appearance of turbulent spots and finally to the transition to turbulence. The influence of longitudinal vortex structures of different natures (vortices behind roughness, Görtler vortices, etc.) on the laminar–turbulent transition was considered by Kozlov et al. (Reference Kozlov, Grek, Lofdahl, Chernorai and Litvinenko2002). Grek, Katasonov & Kozlov (Reference Grek, Katasonov and Kozlov2008) showed experimentally that streaky structures can also exist in the boundary layer on a wing.
Although both modal and non-modal perturbations grow independently in a linear regime, their interaction at the nonlinear stage can be surprisingly stabilizing. In particular, Shahinfar, Sattarzadeh & Fransson (Reference Shahinfar, Sattarzadeh and Fransson2014) demonstrated through experiments that streaks generated in a laminar boundary layer by miniature vortex generators can attenuate two-dimensional Tollmien–Schlichting and three-dimensional oblique waves and completely prevent laminar–turbulent transition.
There is a limited amount of experimental evidence confirming the appearance of streaky structures in submerged jet flows. Liepmann & Gharib (Reference Liepmann and Gharib1992) demonstrated that in a round jet subject to primary Kelvin–Helmholtz instability, longitudinal vortex structures were formed in the narrowing regions. Although the authors suggested that the formation of these structures was the result of a secondary instability of the flow, Nastro et al. (Reference Nastro, Fontane and Joly2020) theoretically showed that these structures probably occurred due to the non-modal growth of disturbances initiated by the natural turbulence of the jet. Kozlov et al. (Reference Kozlov, Grek, Lofdahl, Chernorai and Litvinenko2002) studied the turbulization of a round jet, where the formation of longitudinal vortex structures was detected by a flow visualization. It was shown that stationary structures of a similar nature can be created by placing sandpaper in the nozzle. The authors made an assumption that the interaction of Kelvin–Helmholtz vortices and longitudinal vortex structures would lead to a new type of transition in a round jet, in which the vortex rings are distorted by longitudinal stationary perturbations, leading to the creation of new vortices, whose secondary destruction yields jet turbulence. However, so far this mechanism has not been confirmed by measurements.
1.3. The goal of this work
As can be seen from the literature review, despite the theoretical predictions of non-modal growth in submerged jets, so far there have not been any experiments in which this mechanism has been definitely identified. The role of non-modal growth in the transition to turbulence in jets is also still unclear. The purpose of this work is to eliminate these gaps with the help of the long laminar jet created by the set-up previously used by Zayko et al. (Reference Zayko, Teplovodskii, Chicherina, Vedeneev and Reshmin2018) and Gareev et al. (Reference Gareev, Zayko, Chicherina, Trifonov, Reshmin and Vedeneev2022).
In § 2, the experimental set-up and the profile of the considered laminar jet are briefly described. In § 3, a theoretical analysis of the non-modal spatial instability is conducted. Section 4 discusses the scheme of the experiments and the measurement system. Section 5 describes the results of the experiments. Section 6 discusses the correspondence between the experimental data and the theory and § 7 summarizes the results of this work.
2. The laminar jet
In this study, we consider a laminar jet flow, which is formed by a device that consists of three parts (figure 1). The first part is a perforated plate that smooths out the stream incoming from the air pipeline (the diameter of the inlet cross-section of the device is 0.04 m). The second part is a bushing with two metal grids, which reduces the level of turbulence down to 0.1 %. The third part is a diffuser, which expands the flow to a diameter  $D=0.12$ m. It has two thin metal grids at the outlet to prevent flow separation. The set-up is described in detail by Zayko et al. (Reference Zayko, Teplovodskii, Chicherina, Vedeneev and Reshmin2018).
Jet-forming device: perforated plate (1), bushing with two different types of grids (2), diffuser with grid package at the orifice (3).

There is an optimal range of Reynolds numbers for the considered flow, in which the length of the laminar region is maximal ( ${\ge}5D$) so that it is possible to track the evolution of introduced perturbations at long distances from the orifice. In this study, one regime from this range is selected, in which the air flow has velocity at the jet axis
 $U_{c}=1.5$ m s
 $^{-1}$ and average velocity
 $U_{avg}=0.66$ m s
 $^{-1}$, which corresponds to the Reynolds number based on the average velocity and diameter
 $Re_D=5400$, and to the Reynolds number based on the maximum velocity and jet radius
 $Re=6122$. The experimental velocity profile at the orifice is approximated by a cubic spline for theoretical study (figure 2). The downstream evolution of the unperturbed jet profile is weak (Gareev et al. Reference Gareev, Zayko, Chicherina, Trifonov, Reshmin and Vedeneev2022) and is not taken into account in the theoretical analysis.
The jet velocity profile. The crosses show the experimental values obtained by the hot-wire anemometer. The solid line shows the profile used in theoretical analysis. The yellow rectangle indicates the deflector at the radial position  $2r/D=0.5$ in the flow.

3. Theoretical analysis of spatial non-modal instability
3.1. Method of optimal disturbances calculation
The idea of spatial optimal perturbations is to find such a perturbation that will lead to the greatest increase in the kinetic energy of a perturbation for a given axial coordinate  $z$ and frequency. The study of the optimal perturbations begins with the search for eigenmodes of the jet velocity profile. The velocity components and pressure, with small perturbations, are substituted into the dimensionless equations of motion of a viscous, incompressible fluid:
 \begin{equation} \left.\begin{array}{c@{}} \boldsymbol{u}_t+(\boldsymbol{u}\boldsymbol{\cdot} \boldsymbol{\nabla})\boldsymbol{u}=-\boldsymbol{\nabla} p+\dfrac{1}{Re} \nabla^2\boldsymbol{u},\\ \boldsymbol{\nabla} \boldsymbol{\cdot} \boldsymbol{u} = 0, \end{array} \right\} \end{equation}
where  $\boldsymbol {u}$ is the fluid velocity vector,
 $p$ is the pressure and
 $Re$ is the Reynolds number based on the maximum jet speed and the orifice radius. The subscript
 $t$ denotes the derivative with respect to the time
 $t$. After linearization with respect to perturbations,
 $\boldsymbol {u}=\boldsymbol {U}+\boldsymbol {u'}, p=P+p', \| \boldsymbol {u'} \|/\| \boldsymbol {U} \| \ll 1$, we get
 \begin{equation} \left.\begin{array}{c@{}} \boldsymbol{u'}_t+(\boldsymbol{U}\boldsymbol{\cdot} \boldsymbol{\nabla})\boldsymbol{u'}+(\boldsymbol{u'}\boldsymbol{\cdot} \boldsymbol{\nabla})\boldsymbol{U}=-\boldsymbol{\nabla} p'+\dfrac{1}{Re} \nabla^2\boldsymbol{u'},\\ \boldsymbol{\nabla} \boldsymbol{\cdot} \boldsymbol{u'} = 0, \end{array} \right\} \end{equation}
where  $\boldsymbol {u'}$ is the fluid velocity perturbation,
 $p'$ is the pressure perturbation and
 $\boldsymbol {U} = U(r)\boldsymbol {e}_z$ is the base flow velocity field.
Following Khorrami, Malik & Ash (Reference Khorrami, Malik and Ash1989), perturbations are considered in the form of the eigenmodes in cylindrical coordinates  $(r,\theta, z)$:
 \begin{equation} \left.\begin{array}{c@{}} \boldsymbol{u'}=\begin{bmatrix} u \\ v \\ w \end{bmatrix} (r, \theta, z, t) = {\rm e}^{{\rm i} (\alpha z + n \theta - \omega t)} \begin{bmatrix} iF \\ G \\ H \end{bmatrix} (r), \\ p'=p (r, \theta, z, t) = \, {\rm e}^{{\rm i} (\alpha z + n \theta - \omega t)} P (r), \end{array} \right\} \end{equation}
where  $\alpha$ is the axial wavenumber,
 $n$ is the azimuthal wavenumber and
 $\omega$ is the frequency.
Given a real frequency  $\omega$ and an integer azimuthal wavenumber
 $n$, the eigenvalue problem with respect to the axial wavenumber
 $\alpha$ is solved using the Chebyshev spectral collocation method. First, we substitute (3.3) into (3.2) to obtain the ordinary differential eigenvalue problem:
 \begin{align} &\begin{pmatrix}
\dfrac{\partial}{\partial r} + \dfrac{1}{r} & \dfrac{n}{r}
& 0 & 0 & 0 & 0 & 0\\ \varDelta & -\dfrac{2n}{r^2} & 0 &
\mathrm{i}\,Re\dfrac{\partial}{\partial r} & 0 & 0
& 0\\ -\dfrac{2n}{r^2} & \varDelta & 0 &
-\dfrac{\mathrm{i}\,Re\,n}{r} & 0 & 0 & 0\\
-\mathrm{i}\,Re\dfrac{\mathrm{d} U}{\mathrm{d} r}
& 0 & \varDelta_z & 0 & 0 & 0 & 0 \\ 0 & 0 & 0 & 0 & 1 & 0
& 0 \\ 0 & 0 & 0 & 0 & 0 & 1 & 0\\ 0 & 0 & 0 & 0 & 0 & 0 &
1\\ \end{pmatrix} \begin{pmatrix} F \\ G \\ H \\ P \\
\alpha F \\ \alpha G \\ \alpha H \end{pmatrix} \nonumber\\
&\quad =\alpha \begin{pmatrix} 0 & 0 & -1 & 0 & 0 & 0 & 0\\
\mathrm{i}\,ReU & 0 & 0 & 0 & 1 & 0 & 0\\ 0 &
\mathrm{i}\,ReU & 0 & 0 & 0 & 1 & 0\\ 0 & 0 &
\mathrm{i}\,ReU & \mathrm{i}\,Re & 0 & 0
& 1\\ 1 & 0 & 0 & 0 & 0 & 0 & 0\\ 0 & 1 & 0 & 0 & 0 & 0 &
0\\ 0 & 0 & 1 & 0 & 0 & 0 & 0 \end{pmatrix} \begin{pmatrix}
F \\ G \\ H \\ P \\ \alpha F \\ \alpha G \\ \alpha H
\end{pmatrix},
\end{align}
where
 \begin{equation} \varDelta = \dfrac{\partial^2}{\partial r^2} + \dfrac{1}{r}\dfrac{\partial}{\partial r} + \mathrm{i}\,Re\omega - \dfrac{n^2 + 1}{r^2}, \quad \varDelta_z = \dfrac{\partial^2}{\partial r^2} + \dfrac{1}{r}\dfrac{\partial}{\partial r} + \mathrm{i}Re\omega - \dfrac{n^2}{r^2}. \end{equation}
In (3.4), we increased the number of independent variables by adding  $\alpha F, \alpha G, \alpha H$ in order to transform the system to a linear one in
 $\alpha$. The system (3.4) is supplied with the following boundary conditions. As
 $r\to +\infty$, we require the decay of perturbations:
 \begin{equation} F(+\infty) = G(+\infty) = H(+\infty) = P(+\infty) = \alpha F(+\infty) = \alpha G(+\infty) = \alpha H(+\infty) = 0. \end{equation}
At  $r=0$, we require
 \begin{align} \left.\begin{array}{l} \text{if}\quad n = 0: \quad \begin{cases} F(0) = G(0) = \alpha F(0) = \alpha G(0) = 0,\\ \dfrac{\partial H}{\partial r}(0) = \dfrac{\partial \alpha H}{\partial r}(0) = 0,\quad \dfrac{\partial P}{\partial r} = 0; \end{cases}\\ \text{if}\quad|n| = 1: \quad \begin{cases} H(0) = P(0) = \alpha H(0) = 0,\\ F(0) + G(0) = 0,\quad \alpha F(0) + \alpha G(0) = 0,\\ 2\dfrac{\partial F}{\partial r}(0) + \dfrac{\partial G}{\partial r}(0) = 0, \quad 2\dfrac{\partial \alpha F}{\partial r}(0) + \dfrac{\partial \alpha G}{\partial r}(0) = 0; \end{cases}\\ \text{if}\quad |n| \geq 2: \quad F(0) = G(0) = H(0) = P(0) = \alpha F(0) = \alpha G(0) = \alpha H(0) = 0. \end{array}\right\} \end{align}
Second, we discretize the differential eigenvalue problem using the Chebyshev collocation method. The infinite domain is reduced to  $0\le r \le R_{out}$, where
 $R_{out}$ is sufficiently large, and the boundary conditions (3.6) are set at
 $r=R_{out}$. After the Gauss–Lobatto grid is mapped upon the physical domain, we calculate the so-called Chebyshev differentiation matrix. For the computational domain
 $(-1, 1)$, the Chebyshev differentiation matrix of size
 $M$ has the following elements (Canuto et al. Reference Canuto, Hussaini, Quarteroni and Zang2007):
 \begin{equation} (D_M)_{j l}=
\begin{cases} \dfrac{\bar{c}_j}{\bar{c}_l} \dfrac{(-1)^{\,j+l}}{x_j-x_l}, & j \neq l, \\
-\dfrac{x_l}{2(1-x_l^2)}, & 1 \leq j=l \leq M-2, \\
\dfrac{2 (M - 1)^2+1}{6}, & j=l=0, \\ -\dfrac{2 (M -
1)^2+1}{6}, & j=l=M - 1 ,\end{cases}
\end{equation}
where  $x_j=\cos ({{\rm \pi} j}/({M - 1}))$ for
 $j = 0,\ldots, M - 1$ and
 $\bar {c}_j = 2$ for
 $j = 0, M - 1$ and
 $\bar {c}_j = 1$ otherwise. For an arbitrary interval, the Chebyshev differentiation matrix can be calculated using the chain rule and (3.8). After that, we replace
 $\partial /\partial r$ with it in (3.4). Finally, we apply the boundary conditions (3.6), (3.7) and obtain the algebraic eigenvalue problem. More details of the Chebyshev collocation technique are presented in Trefethen (Reference Trefethen2000) and Canuto et al. (Reference Canuto, Hussaini, Quarteroni and Zang2007). The choice of
 $R_{out}$ and the grid size was based on a spectrum convergence study for each
 $n$ and
 $\omega$.
Thus, a set of eigenvalues and corresponding eigenvectors  $\{\alpha _j, \boldsymbol {q}_j\}$ is found in the viscous linear formulation for the considered velocity profile. They include truly discrete eigenvalues, as well as a discretized continuous spectrum. An arbitrary perturbation can be represented as an expansion in eigenmodes:
 \begin{equation} \boldsymbol{q} (r, \theta, z, t) = \sum_{j = 1}^{N} \gamma_j \boldsymbol{q}_j (r) \,{\rm e}^{\mathrm{i} (\alpha_j z + n \theta - \omega t)}, \end{equation}
where  $\boldsymbol {q} = (u, v, w, p)$ is the state vector of the system,
 $\alpha _j$ and
 $\boldsymbol {q}_j=(iF,G,H,P)$ are the
 $j$th eigenvalue and the corresponding eigenvector, respectively, and
 $N$ is the number of eigenmodes used in the calculations.
Disturbances with  $\mathrm {Im}\, \alpha < 0$ are travelling upstream of the disturbance generator and are not included in this expansion, with the exception of discrete instability modes travelling downstream. There are zero, one or two instability modes for the considered velocity profile, depending on
 $\omega$ and
 $n$ (Gareev et al. Reference Gareev, Zayko, Chicherina, Trifonov, Reshmin and Vedeneev2022). To distinguish amplified downstream modes from decaying upstream modes (both have
 $\mathrm {Im}\, \alpha < 0$ for
 $\omega \in \mathbb {R}$), the following method was used. Due to the causality principle, as
 $\mathrm {Im}\, \omega \to +\infty$, all modes were unambiguously split into upstream (
 $\mathrm {Im}\,\alpha < 0$) and downstream (
 $\mathrm {Im}\,\alpha > 0$) travelling waves. For a fixed value of
 $\mathrm {Re}\, \omega$, we increased the value of
 $\mathrm {Im}\, \omega$ from zero to
 $\mathrm {Im}\, \omega >0$ and observed the motion of eigenvalues on the complex
 $\alpha$ plane, as shown in figure 3. While increasing
 $\mathrm {Im}\, \omega$, we selected eigenvalues
 $\alpha$ moving to the upper half-plane and consequently representing truly downstream-travelling waves. As intuitively expected, only instability modes associated with the inflection point of the velocity profile (Gareev et al. Reference Gareev, Zayko, Chicherina, Trifonov, Reshmin and Vedeneev2022), initially located at
 $\mathrm {Im}\,\alpha < 0$, moved to the upper half-plane and, hence, were included into the expansion (3.9). In calculations, we assume that the eigenmodes are sorted in ascending order of
 $\mathrm {Im}\,\alpha$ and choose the first
 $N$ modes for the expansion (3.9).
Loci of eigenvalues in the complex  $\alpha$ plane with increase of
 $\mathrm {Im}\, \omega$ for
 $\mathrm {Re}\, \omega = 0.01, n = 1$. Dashed arrows show the motion of downstream-travelling damped modes, and the continuous arrow represents the downstream-travelling amplified mode. Red curve separates downstream- and upstream-travelling modes.

As a functional norm for which the optimization problem is solved, we consider the kinetic energy of perturbation:
 \begin{equation} E(z)=\frac{1}{4{\rm \pi} T}\int_0^\infty \int_0^T \int_0^{2{\rm \pi}} ((\mathrm{Re}\,u)^2+(\mathrm{Re}\,v)^2 +(\mathrm{Re}\,w)^2) r\, {\rm d} \theta\, {\rm d} t\, {\rm d} r, \quad T = \frac{2{\rm \pi}}{\omega}. \end{equation}
For stationary perturbations, we analyse the limit of  $\omega \to 0$. To normalize initial kinetic energy of perturbations, we assume that
 $E(0)=1$.
After substituting (3.9) into (3.10), the kinetic energy of the perturbation (3.9) is expressed as a quadratic function of the expansion coefficients:
 \begin{equation} E(z; \boldsymbol \gamma) = \sum_{j, k = 1}^{N} \gamma_j^* E_{jk} \gamma_k = \boldsymbol{\gamma}^{{{\dagger}}} \boldsymbol{E}(z) \boldsymbol{\gamma}, \end{equation}
where  $*$ represents complex conjugation,
 ${\dagger}$ is the Hermitian conjugation operator,
 $\boldsymbol {\gamma }$ is the column vector of coefficients of the expansion (3.9) and the components of the matrix
 $\boldsymbol {E}(z)$ are as follows:
 \begin{equation} E_{i j}=\tfrac{1}{4} \exp((-\mathrm{i} \alpha_i^{*} + \mathrm{i} \alpha_j)z ) \int_{0}^{\infty}(F_{i}^{*} F_{j}+G_{i}^{*} G_{j}+H_{i}^{*} H_{j}) r \,\mathrm{d} r. \end{equation}
Thus, the problem of optimal perturbations is reduced to the problem of constrained optimization (Boronin et al. Reference Boronin, Healey and Sazhin2013):
 \begin{equation} \boldsymbol{\gamma}^{{{\dagger}}} \boldsymbol{E}(z) \boldsymbol{\gamma}\boldsymbol \to \max, \quad \text{subject to}\ \boldsymbol{\gamma}^{{{\dagger}}} \boldsymbol{E}(0) \boldsymbol{\gamma} = 1. \end{equation}
The problem (3.13), in its turn, is reduced to the generalized Hermitian eigenvalue problem
 \begin{equation} \boldsymbol{E}(z) \boldsymbol{\gamma} = \sigma \boldsymbol{E}(0)\boldsymbol{\gamma}, \end{equation}
with its largest eigenvalue  $\sigma _{max}$ being exactly the optimal energy value
 $E(z)$ for a given
 $z$. The value of
 $\sigma _{max}$ is found by the power iteration algorithm.
Summarizing, the algorithm for the calculation of the optimal perturbation for a given  $z$ is as follows. After the calculation of the eigenvalues
 $\alpha _j$ and corresponding eigenvectors, we select those corresponding to downstream-travelling modes. Next, we calculate the matrices
 $\boldsymbol {E}(z)$ and
 $\boldsymbol {E}(0)$ and find the largest eigenvalue of the problem (3.14), which is the optimal perturbation energy. The corresponding eigenvector
 $\boldsymbol {\gamma }$ is used to calculate the initial and final spatial distributions (3.9) of the optimal perturbation. For every
 $n$ and
 $\omega$, we performed the convergence study in the number of downstream-travelling eigenmodes
 $N$ used in the expansion (3.9). Here
 $N$ was changed from 200 to 1500 to check the convergence.
3.2. Calculation results
Boronin et al. (Reference Boronin, Healey and Sazhin2013) showed that for several types of jet velocity profiles, stationary perturbations (that is, perturbations with  $\omega \to 0$) demonstrate the largest non-modal growth. The same effect was obtained for the profile under consideration. Examples are shown in figures 4 and 5, where the ratio of the maximum relative kinetic energy
 $G$ of all perturbations,
 \begin{equation} G(z)=\max \frac{E(z)}{E(0)}, \end{equation}
to the energy of the fastest-growing eigenmode (denoted as  $E_m$ in figures 4 and 5) reaches its maximum as
 $\omega \to 0$. Therefore, in what follows, we restrict ourselves to the stationary optimal perturbations.
The ratio of the optimal perturbation energy to the energy of the fastest-growing eigenmode for various frequencies for  $n = 1$: (a)
 $z/D \le 5$; (b)
 $z/D \gg 1$.

The ratio of the optimal perturbation energy to the energy of the fastest-growing eigenmode for various frequencies for  $n = 5$: (a)
 $z/D \le 5$; (b)
 $z/D \gg 1.$

Note that in our study we consider steady perturbations, i.e.  $\omega \rightarrow 0$. It is known that for
 $\omega =0$, all eigenmodes of the linearized Navier–Stokes equations are either damped or neutral (it was also checked for our jet velocity profile). Consequently, the perturbation growth a priori cannot be generated by a single mode, and in this sense it is ‘non-modal’ by definition. Hence, the growth of a steady perturbation downstream can only be explained by a limited growth of a combination of damped modes. Such a combination can indeed grow due to non-self-adjointness of the linearized Navier–Stokes operator, and non-orthogonality of its eigenvectors (see Schmid & Henningson (Reference Schmid and Henningson2001) for details).
Figure 6 shows  $G(z)$ for various azimuthal wavenumbers. Each curve in figure 6 depicts the envelope of the family of curves for the relative kinetic energy of all possible stationary perturbations for a given
 $n$. It can be seen that, for small values of
 $z$, perturbations with different
 $n$ grow at similar rates, but as
 $z$ increases, smaller
 $n$ corresponds to larger perturbation growth. For classical velocity profiles, non-modal growth of axisymmetric perturbations,
 $n=0$, due to the Orr mechanism, is significantly weaker than for
 $n\not =0$, where the ‘lift-up’ mechanism is active (Jiménez-González et al. Reference Jiménez-González, Brancher and Martínez-Bazán2015). The same result is obtained for our velocity profile: for axisymmetric perturbations
 $n = 0$, the optimal energy gain
 $G$ is less than
 $81$ for all
 $z$.
Energy growth of stationary optimal perturbations for various azimuthal numbers  $n$: (a)
 $z/D \le 5$; (b)
 $z/D \gg 1.$

Since the unperturbed profile is axisymmetric, for each  $n \neq 0$ there is a helical solution twisted counterclockwise, and a similar solution twisted in the opposite direction for
 $-n$. To get the optimal solution without twist, we average two helical perturbations:
 \begin{equation} \tilde{\boldsymbol{q}}^{n}(r, \theta, z) = \frac{\boldsymbol{q}^{n} (r, \theta, z) + \boldsymbol{q}^{-n} (r, \theta, z)}{2}, \end{equation}
where  $\boldsymbol {q}^{n}$ is the optimal perturbation for a given
 $n$ and
 $\omega \to 0$. Three optimal perturbations, two with twist in opposite directions and one without twist, have the same optimal energy gains
 $G(z)$.
Visualizations of the untwisted optimal perturbations for  $z$, where
 $G(z)$ reaches its maximum, are shown in figure 7, where the axial velocity perturbation is shown in colour, the streamlines are drawn for transverse velocities and the white circle is the unperturbed jet boundary.
Distribution of the axial component of the optimal perturbation velocity and streamlines in the jet cross-section for (a)  $n=1$, (b)
 $n=2$, (c)
 $n=3$ and (d)
 $n=5$. The coordinate
 $z$ corresponds to the cross-section, in which the global energy maximum is reached:
 $z/D=1015$ for
 $n = 1, z/D=81$ for
 $n = 2, z/D=35$ for
 $n = 3$ and
 $z/D=12$ for
 $n = 5$.

As can be seen, the cases  $n = 1$ and
 $n > 1$ differ in their spatial structure. In the case of
 $n = 1$, the optimal perturbation takes the form of a displacement mode whose effect is to shift the jet. This is called the ‘shift-up’ effect by Jiménez-González et al. (Reference Jiménez-González, Brancher and Martínez-Bazán2015). Due to the transfer of faster zone from the jet core to the shear layer, this shift leads to an increase and decrease in the axial velocity in two opposite shear regions. In the case of
 $n > 1$, the optimal perturbation consists of several vortex structures (the number of which is
 $2n$) that form ‘petals’ of jet acceleration and deceleration due to the replacement of fast zones by slow ones and vice versa. This structure resembles the ‘lift-up’ effect in the boundary layer.
An example of axial and transverse perturbation velocities for  $n = 2$, which are optimal in some section, is shown in figure 8 as a function of the axial coordinate
 $z/D$ at
 $2r/D = 0.75$ (qualitatively similar distributions are observed in other points for all
 $n>0$). It can be seen that the axial velocity perturbation increases almost linearly up to
 $z/D \approx 4$ and just slightly deviates from the linear trend for
 $z/D>4$, while the two other velocity components almost do not change. These properties, the linear growth of the axial velocity perturbations with the preservation of longitudinal vortices, are characteristic of the non-modal ‘lift-up’ mechanism of the perturbation growth. As the axial velocity initially evolves almost linearly, and it is the dominant component of the kinetic energy of optimal perturbations,
 $E(z)$ grows almost quadratically with the increase of
 $z$.
Root mean square of the velocity component fluctuations of the optimal perturbation as  $\omega \to 0$ for
 $n = 2$ at
 $2r/D = 0.75$.

Like the jet flows considered by Boronin et al. (Reference Boronin, Healey and Sazhin2013) and Jiménez-González & Brancher (Reference Jiménez-González and Brancher2017), the optimal perturbations for the considered profile have a complex three-dimensional structure and, accordingly, are difficult to implement in experiments. Nevertheless, in this experimental work, by using special deflectors, we create perturbations that are qualitatively close to the theoretical optimal ones.
4. Experimental set-up and measurement system
4.1. Creation of disturbances
As described above, stationary perturbations have larger non-modal growth than non-stationary ones. That is why disturbances were introduced into the jet using motionless thin wave-like structures, which we call deflectors (figure 9).
Three-dimensional model (left) and printed deflector (right) with azimuthal wavenumbers  $n = 3$ (a) and
 $n = 5$ (b), with parameters
 $\varepsilon = 0.1, d_0 = 60$ mm.

The upper edge of the deflectors was a circle of radius  $r_0=d_0/2$ (
 ${=}30$ mm in most of the experiments), and the lower edge is a perturbed circle with a given azimuthal wavenumber
 $n$ and radius
 $r=r_0(1 + \varepsilon \sin (n\theta ))$, where
 $\varepsilon$ defined the dimensionless amplitude of deviation from the circle and
 $\theta$ was a polar angle. The height of the deflector between the upper and lower edges is
 $h=10$ mm while the wall thickness was 0.6 mm. A smooth transition was made between the edges (points of the upper and lower edges with the same azimuthal coordinate
 $\theta$ were connected by straight-line segments). The models were designed in a computer-aided design program and then three-dimensionally printed from polylactic acid plastic.
A special holder was designed for the deflector installation inside the jet. This holder was attached to the diffuser like a crimp ring and allowed us to vary the distance between the orifice of the diffuser and the plane where the deflector was located, as well as the rotation angle of the deflector around the jet axis. The lower edge of the deflectors lay on strained fishing lines of 0.05 mm in diameter. The deflectors were installed inside the jet coaxially, with the inlet edge at a distance of  $z=20$ mm, i.e. at
 $z/D=1/6$ (hereinafter,
 $z$ denotes the distance from the diffuser orifice), and the undisturbed inlet circle edge upwards. A photograph of the holder with the deflector installed is shown in figure 10.
Picture of the deflector holder.

4.2. Flow visualization method
Flow visualization (figure 11) was performed using the laser sheet method. Fine glycerol particles (of diameter 1–3  $\mathrm {\mu }$m) were introduced to the pipeline before the jet-forming device. A continuous green laser with a wavelength of 532 nm, equipped with a cylindrical lens to create a plane, illuminated the cross or longitudinal sections of the jet. Due to eventual settling of glycerol particles on the bushing with grids (of a cell size of 30–50
 $\mathrm {\mu }$m), the bushing was regularly washed with water to maintain the characteristics of the jet. The video camera was located outside the flow and was mounted on a vertical traverse system together with the laser. Accordingly, it moved synchronously with the illuminated cross-section of the jet to ensure the same frame scale for each shooting distance. All frames of the cross-section at distances
 $z/D = 0.5\unicode{x2013} 3.5$ were obtained at an angle to the jet axis, so that a linear transformation of the frame plane was subsequently performed to eliminate its distortion.
Flow visualization scheme in longitudinal (a) and transverse (b) planes. Diffuser (1), glycerin aerosol generator (2), laser sheet (3), laser (4), video camera (5), holder with deflector (6).

4.3. Hot-wire anemometer measurements
Measurement of the instantaneous and averaged flow velocity was conducted using a hot-wire anemometer (DISA CTA BRIDGE 56C17). The hot-wire anemometer probe with 5  $\mathrm {\mu }$m tungsten wire was located at the end of the L-shaped holder (figure 12), whose movement in the transverse and axial directions of the jet flow was controlled from a PC. The signal was digitized by an analogue-to-digital converter at a frequency of 7500 Hz, which provided a fairly wide spectrum of velocity disturbances and negligible random measurement errors. A systematic absolute error of velocity measurements due to the calibration procedure was nearly 0.015 m s
 $^{-1}$, which corresponded to
 ${\sim }1\,\%$ relative error with respect to the maximum velocity of the base flow. Another source of errors was the five-second averaging time period, which was sufficient to show a trend in the evolution of disturbance, but could possibly have been sensitive to large-scale air motion in the test room.
Scheme for measuring the flow velocity with a hot-wire anemometer.

4.4. Particle image velocimetry measurements
The flow seeding method for particle image velocimetry (PIV) measurements was the same as for the flow visualization. The flow was illuminated with a Beamtech Vlite-Hi-100 high-frequency pulsed Nd:YAG laser mounted on a traverse system. A rod with an Allied Vision Bonito CL-400B high-speed PIV camera was also attached to the traverse system. When the cross-section was measured, the camera was placed directly into the jet at a distance of 720 mm ( ${\rm \Delta} z/D=6$) below the measured cross-section (figure 13). The camera installation scheme for measuring the longitudinal section is similar to that used for visualization (figure 11a). As the flow velocity in the regime under study did not exceed 1.5 m s
 $^{-1}$, and the delay between two flashes of the pulsed laser did not exceed 750
 $\mathrm {\mu }$s, it was possible to detect the motion of particles in the transverse plane of the laser sheet (thickness not less than
 $0.001$ m). This design allowed shooting at distances
 $z/D=1\unicode{x2013} 2$. Shooting double frames was performed mainly at a frequency of 20 Hz.
Scheme of PIV experiments (cross-section of the jet). Diffuser (1), glycerine aerosol generator (2), laser sheet (3), high-frequency pulsed laser (4), high-speed camera (5), holder with deflector (6), traverse system (7).

Photo processing was performed using ActualFlow software and consisted of applying an iterative cross-correlation algorithm to find velocities in the  $64\times 64$ pixel areas with 50 % overlap and subsequent filtering of the vectors by the signal-to-noise ratio, as well as by the magnitude of the components of the instantaneous velocity vectors. We did not seed the air surrounding the jet. Because of this, in the right-hand part of the velocity field patterns outside the jet, we could detect a parasitic high-velocity flow region remaining after filtration, which was explained by the camera noise (see figure 14a).
Velocity fields of the undisturbed flow obtained using PIV: (a) flow in the cross-section of the jet; (b) flow in a longitudinal section.

The average velocity field was found by averaging 3000 instantaneous velocity fields, so the random error was negligible. The systematic error came from the error of the cross-correlation algorithm, which could be estimated as  ${\sim }1\,\%$. An example of the obtained transverse velocity modulus field in a jet is given for an undisturbed flow in figure 14(a) and for the axial velocity field in figure 14(b).
Each experiment consisted of putting a deflector into the flow and measuring the average axial velocity in the central plane of the jet, or the average transverse velocity at distances from the forming device orifice  $z/D = 1, 1.25, 1.5, 1.75, 2$. These fields can be used to estimate the evolution of the flow disturbance downstream. In what follows, for brevity, flow patterns for
 $z/D = 1, 1.5, 2$ are given.
5. Experimental results
5.1. Visualization of the cross-section of the jet
To study the development of perturbations introduced by deflectors with  $\varepsilon = 0.1$, experiments were conducted with the visualization of the cross-sections of the jet by a laser sheet.
Disturbances introduced by deflectors with initial diameter  $d_0=60$ mm (
 $d_0=D/2$) developed faster and turbulized the flow earlier upstream compared with disturbances introduced by deflectors with
 $d_0=30, 90, 120$ mm. This can possibly be explained by a rather large unperturbed velocity at
 $r=30$ mm (
 $2r/D= 1/2$) and its large gradient (figure 2). Deflector configurations with larger or smaller
 $d_0$ introduce disturbances either where the velocity gradients are smaller or where the flow velocity is significantly less than the velocity at the jet centre.
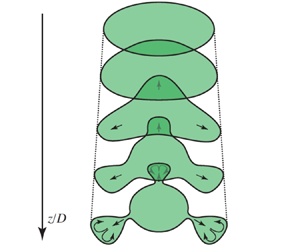
Disturbances caused by deflectors at small distances almost do not deform the cross-section, but the cross-section changes with the development of the stationary disturbance downstream, acquiring the shape of the outlet edge of the deflectors (figure 15). ‘Petals’ increase, stretch in the radial direction from the jet axis and form a ‘neck’ – a narrow region of the jet section connecting the petal with the jet core. Shortly after the formation of necks, a rapid growth of unsteady fluctuations and transition to turbulence at distances  $z/D$
 ${\sim }3$ are observed. A qualitative scheme for the development of such perturbations is shown in figure 15.
Three-dimensional models of deflectors with azimuthal numbers  $n=3, 4, 5$ (a) and the evolution of stationary perturbations introduced by them as cross-section photographs (b) and the qualitative scheme (c).

Petal lengths versus the distance  $z$ were obtained from the cross-section pictures of the jet for deflectors with
 $n=3$, 4, 5, and the resulting plots are shown in figure 16. Since one photograph of the instantaneous jet cross-section is analysed for each streamwise position, we estimate the uncertainty of this method (due to random fluctuations of the jet and air motion in the test room) as
 $<5$ %, which is acceptable to characterize the evolution of the perturbed jet. The lengthening of the petals occurs linearly; therefore, the radial velocity perturbation is approximately constant, which is consistent with the theoretical calculations of stationary optimal perturbations of the jet (§ 3.2).
(a) Measurement of the petal length in the jet cross-section perturbed by deflector with  $n=5, \varepsilon =0.1$ at
 $z=1.5D$. (b) The petal length as a function of
 $z/D$. Perturbations with
 $n=3$ (grey squares),
 $n=4$ (green circles),
 $n=5$ (black diamonds).

5.2. Development of the axial velocity component
To make sure that the development of perturbations introduced by the deflectors qualitatively corresponds to the development of optimal perturbations, we considered the change in the axial flow velocity downstream. A series of experiments was performed to determine the average velocity with a hot-wire probe outside the flow core with deflectors for  $n=3$, 4, 5 and
 $\varepsilon =0.05$ (figure 17) and
 $\varepsilon =0.1$ (figure 18). Points with constant radial and azimuthal coordinates were selected outside of the deflector wake.
Normalized axial velocity perturbation versus the distance  $z$ downstream. Perturbations are introduced by a deflector with
 $\varepsilon =0.05$. Measurements in petals at
 $2r/D=0.8$ (a) and troughs at
 $2r/D=0.55$ (b). Perturbations with
 $n=3$ (grey squares),
 $n=4$ (green circles),
 $n=5$ (black diamonds).

Normalized axial velocity perturbation versus the distance  $z$ downstream. Perturbations are introduced by a deflector with
 $\varepsilon =0.1$. Measurements in petals at
 $2r/D=0.8$ (a) and troughs at
 $2r/D=0.55$ (b). Perturbations with
 $n=3$ (grey squares),
 $n=4$ (green circles),
 $n=5$ (black diamonds).

In figures 17 and 18, the relative amplitudes of stationary disturbances versus  $z/D$ are given at the points corresponding to petals of the jet section (left-hand panels) and corresponding to ‘troughs’ (right-hand panels). It is seen that in regions of contraction and expansion of the cross-section, the axial velocity evolves algebraically and close-to-linearly with streamwise distance. The significant deviation from the linear growth appears only for deflectors with
 $\varepsilon =0.1$ in petals of the jet at
 $z/D > 2.0$. The velocity, reaching its peak at
 $z/D \approx 2.0$, decreases, which is explained by the growth of nonlinear effects that arise when a sufficiently large perturbation amplitude is reached; namely, by the formation of necks. Close-to-linear growth of the axial velocity is in accordance with the development of theoretical optimal perturbations (§ 3.2).
5.3. Particle image velocimetry experiments
This section presents the results of PIV measurements in the transverse and longitudinal cut planes of the jet. Below, we show averaged perturbation fields, i.e. the disturbed flow minus the base flow. The streamlines of the transverse disturbance velocity are superimposed on the colour fields of the transverse disturbance velocity or vorticity magnitude. Flow patterns in transverse sections demonstrate the qualitative nature of the disturbance, and are given in dimensional quantities: m s $^{-1}$ and s
 $^{-1}$ for velocity and vorticity, respectively.
5.3.1. Flow in the transverse jet plane at  $n=1\ldots 5$

Case of  $\boldsymbol {n=1}.$ Figure 19 shows flow patterns with plotted streamlines for perturbation with
 $n=1$, taken at
 $z/D = 1$. Figure 19(a,b) shows the transverse velocity (colour denotes the velocity modulus) and figure 19(c,d) the values of the longitudinal vorticity component
 $\omega _z$. The thicker parts of the streamlines correspond to a larger modulus of transverse velocity. The large grey dashed ring has a diameter of 120 mm and corresponds to the boundary of the undisturbed jet and the small white curve corresponds to the location of the deflector outlet with real magnitude of
 $\varepsilon$. Figure 19(a,c) corresponds to a smaller flow disturbance caused by a deflector with
 $\varepsilon =0.05$ and figure 19(b,d) corresponds to the case
 $\varepsilon =0.1$. These deflectors shift the flow apart from the jet axis (for
 $n=1$, the deflector inlet as a dash-dotted circle is shown too), but the appearance of several regions with high vorticity should also be noted. At
 $\varepsilon = 0.05$, two symmetrically located and clearly distinguishable regions with opposite vorticities are observed; at
 $\varepsilon = 0.1$, the number of vorticity zones increases, they become larger and the maximum values of vorticity increase.
Transverse velocity (a,b) and vorticity (c,d) with plotted streamlines for perturbation with  $n=1, z/D=1$ and
 $\varepsilon =0.05$ (a,c) or
 $0.1$ (b,d). The grey dashed circle is the unperturbed jet boundary, orange dash-dotted circle is the deflector inlet, white solid circle is its outlet.

Case of  $\boldsymbol {n=2}.$ The outlet cross-section for the deflector with
 $n=2$ is characterized by two minima and two maxima, which are also reflected in the disturbance patterns (figure 20). In the directions of the maximum radii of the deflector, there is a flow from the axis to the periphery. For the radius minima, the opposite flow towards the axis is seen. Vortices are observed between these regions, which can be easily detected by the vorticity maxima in figure 20(c,d). For
 $\varepsilon =0.1$, the distribution of the modulus of velocity and vorticity is more complicated than for
 $\varepsilon =0.05$, which is probably explained by the appearance of nonlinear effects in the flow. That is, between the main zones of vorticity, additional vortex pairs arise in the directions of both deflector ‘maximum’ and ‘minimum’. As
 $\varepsilon$ increases from 0.05 to 0.1, the perturbation shrinks in the ‘minima’ direction, where the air flows towards the axis, and expands in the direction of the ‘maxima’, where the fluid is ejected to the periphery.
Transverse velocity (a,b) and vorticity (c,d) with plotted streamlines for perturbation with  $n=2, z/D=1$ and
 $\varepsilon =0.05$ (a,c) or
 $0.1$ (b,d). The legend is the same as in figure 19. White solid curve is a perturbed circle (deflector outlet).

Case of  $\boldsymbol {n=3}.$ For
 $n=3$, the flow pattern (figure 21) is essentially similar to the previous cases: each of the three perturbation petals produces two surrounding vortices, which capture fluid in the region of the small axial velocity located on the periphery, and transfer it towards the jet axis. They also transfer fluid from the region of high axial velocity near the axis to the periphery. Passing from
 $\varepsilon =0.05$ to
 $\varepsilon =0.1$, the maximum velocity and vorticity moduli increase, the flow in the petals becomes more complicated and significantly inhomogeneous and additional vorticity zones appear.
Transverse velocity (a,b) and vorticity (c,d) with plotted streamlines for perturbation with  $n=3, z/D=1$ and
 $\varepsilon =0.05$ (a,c) or
 $0.1$ (b,d). The legend is the same as in figure 19.

Case of  $\boldsymbol {n \ge 4}.$ Further increasing of
 $n$ gives the same flow patterns (figures 22 and 23 show an example of
 $n=5$). There is a general tendency to change the angle of inclination of the elongated vortex regions with an increase of
 $\varepsilon$: the vortex zones become more intensive and more aligned to the radial direction. For
 $\varepsilon =0.1$, the internal vortices observed for
 $n \le 3$ disappear, and only one pair of counter-rotating vortices is noticeable in each petal.
Perturbation evolution downstream for  $n=5, \varepsilon =0.05$. The transverse velocity modulus (a–c) and vorticity (d–f) for (a,d)
 $z/D=1$; (b,e)
 $z/D=1.5$; (c,f)
 $z/D=2$.

Perturbation evolution downstream for  $n=5, \varepsilon =0.1$. The transverse velocity modulus (a–c) and vorticity (d–f) for (a,d)
 $z/D=1$; (b,e)
 $z/D=1.5$; (c,f)
 $z/D=2$.

5.3.2. The disturbance evolution
Let us trace the change in the downstream flow pattern using  $n=5$ as an example (in other cases, the pattern evolution is qualitatively similar). Figure 22 shows the perturbation patterns for
 $z/D = 1, 1.5, 2$ and
 $\varepsilon =0.05$. The perturbation undergoes a certain deformation, but the flow structure does not change. The zones of increased velocity gradually shift radially outward, i.e. to the zone of lower velocities of the base flow. The vortices separating the petals gradually weaken, and the modulus of maximum vorticity decreases. Similar observations can be made for
 $\varepsilon =0.1$ (figure 23), where these features are more clearly visible due to the greater intensity of flow disturbance. For
 $\varepsilon =0.05$, the shape of the petals changes mainly due to their expansion in the radial direction, while in the azimuthal direction they narrow slightly. At
 $\varepsilon =0.1$, the petals are more reminiscent of plumes, and the eddies enclosing them also generate a noticeable azimuthal velocity in this region, leading to a petal expansion with increasing
 $z$.
5.3.3. Measurements in the longitudinal plane
The measurements described in the previous section show how the transverse velocity and vorticity evolve, but do not provide information about the axial component of the disturbance. To obtain the corresponding velocity fields, a series of experiments was performed, in which the laser sheet passed through the jet axis and the camera obtained flow patterns in the meridional plane.
Due to their symmetries, deflectors give a different number of characteristic planes in which measurements should be made to study the flow patterns. For odd  $n=1, 3, 5,\ldots,$ when a plane passes through an antinode, there will also be an antinode of the opposite kind (maximum–minimum and vice versa), and it is enough to make one measurement in order to investigate the development of a petal of the disturbance. For even
 $n=2, 4,\ldots$, there are planes of symmetry passing through antinodes of the same type (maximum–maximum, minimum–minimum), so that in this case, measurements in two planes are made.
Below, as an example, longitudinal perturbation patterns with  $n=2$ and 3 for
 $\varepsilon =0.1$ are given. For convenience, the axis perpendicular to the
 $z$ axis in the cut plane is denoted by
 $x$.
Figure 24 shows two perturbation velocity fields obtained in the maximum–maximum (figure 24a) and minimum–minimum (figure 24b) planes for  $n=2$. The arrows show the perturbation velocity vectors, and the colour fill corresponds to its axial component
 $u_z$ normalized by the maximum value of the base flow axial velocity
 $U_c$. In figure 24(a), the jet expands, and the axial component of the velocity increases downstream. A small reverse perturbation velocity arises in the flow core. In the minimum–minimum plane (figure 24b), the flow pattern is different: the perturbed flow is displaced towards the jet axis and slows down, so that the perturbation has a velocity direction opposite to the base flow.
Perturbation for  $n=2, \varepsilon =0.1$ in the longitudinal plane maximum–maximum (a) and minimum–minimum (b). The fill shows the
 $u_z$ component related to the maximum base flow velocity
 $U_c$. In the zone with
 $x/D > 0.6$ and
 $z/D < 1.33$, spurious vectors have been masked.

For  $n=3$ (figure 25), the disturbed flow deviates to the left relative to the axis of the undisturbed flow. Hence, the region of the disturbance with the positive axial velocity originated at the left-hand side of the jet flow (below the deflector's maximum) and the one with negative velocity at the right-hand side (below the deflector's minimum). There is a small zone near the jet axis in which the perturbation is almost absent compared with its peripheral values. As
 $z$ increases, the moduli of the perturbation velocity increase, and the radial extent of the perturbation axial velocity is increasing.
Perturbation for  $n=3, \varepsilon =0.1$ in the longitudinal plane. In the zone with
 $x / D > 0.5 \text{ and } z/D<1.7$, spurious vectors have been masked.

Let us consider how the kinetic energy changes downstream in the measurement plane for various deflectors. We introduce the normalized kinetic energy
 \begin{equation} K(z) = \frac{1}{L U_c^2}\int_{L} (u_z^2(x, z) + u_x^2(x, z))\, {{\rm d} x}, \end{equation}
where  $L$ is the horizontal length of the frame (note that due to the symmetry of three-dimensional velocity fields with respect to these planes, the circumferential velocity component
 $u_\theta$ is negligibly small). Based on the measurements made for
 $n=1,2,3,5$ (figure 26), we can conclude that
 $K(z)$ in these symmetry planes increases quadratically, which corresponds to the theory (§ 3.2).
Change of  $\sqrt {K(z)/K(D)}$ for different deflectors. For
 $n=2$, ‘max’ and ‘min’ correspond to measurements in the maximum–maximum and minimum–minimum planes.

Let us analyse the evolution of individual components of the perturbation using the  $n=3$ deflector as an example. Figure 27(a) shows the transverse velocity component
 $u_x / U_c$ versus
 $z/D$ at points ‘under’ the deflector (
 $x / D= \pm 0.25$). A curve corresponding to the minima in each cross-section is also shown, i.e.
 \begin{equation} u^-_x (z)=\min_{x} u_x(x,z). \end{equation}
As the entire jet in this plane is displaced in one direction,  $u_x(x,z) \leq 0$, therefore the maximum transverse velocity
 $u^+_x(z) = 0$ is reached outside the jet and is not shown in this figure. Figure 27(b) shows the axial component
 $u_z (x,z)$, at the same points
 $x / D = \pm 0.25$, as well as the maximum and minimum of
 $u_z$ in each cross-section:
 \begin{equation} u^+_z (z)=\max_{x} u_z(x,z), \quad u^-_z (z)=\min_{x} u_z(x,z). \end{equation}
For a more convenient presentation in figure 27(b), the absolute values of negative functions are given.
Downstream evolution of the normalized transverse  $u_x/U_c$ (a) and axial
 $u_z/U_c$ (b) disturbance components for
 $n=3, \varepsilon =0.1$. The dashed line denotes negative values with the sign reversed for convenience of presenting the data.

The transverse component  $u_x$ varies slightly over the considered zone of space. One can note a linear growth of
 $u_z$ at
 $x / D = \pm 0.25$ and of maximum and minimum values of
 $u_z$; the linear growth was also observed at almost every point
 $x=\mathrm {const.}$ Note that as there is a non-zero transverse velocity component, the coordinate of the maximum amplitude of the perturbation is changing downstream. Therefore, when the perturbation amplitude is measured at a fixed
 $x$, the rate of perturbation growth will be underestimated compared with the true value (see
 $u_z$ and
 $| u_z^{\pm }|$ in figure 27b for comparison).
6. Comparison of experiment with theory
As was shown above, the evolution of introduced perturbation matches qualitative features of theoretical optimal perturbations quite well. Namely, the following characteristic features of the ‘lift-up’ growth mechanism have been confirmed. First, the transverse velocity remains approximately constant downstream. Second, the axial velocity increases downstream approximately linearly. Finally, the transverse motion has a ‘roller-like’ movement, transferring the outer layers of the fluid inward and the inner layers outward. For example, figure 28 shows the transverse motion comparison of theoretical optimal perturbation (corresponding to figure 7c) and observation (figure 21a). It is seen that the vortical structures are qualitatively similar: six vortices that transfer fast layers outside and slow layers inside the jet. This motion causes a local increase in the axial velocity perturbation, which is an analogue of the streaky structure in near-wall flows.
Comparison of the cross-sectional flow fields of theoretically optimal perturbation (a) and of the experiment at  $\varepsilon =0.05$ (b). Colour fill corresponds to transverse velocities of the disturbance for
 $n=3$, normalized by its maximum value.

When it comes to quantitative comparison of the perturbation growth rate, there are two difficulties with non-modal perturbations as compared with eigenmodes.
(i) First, it is quite hard, if not impossible, to generate experimentally a perturbation that is close to theoretically optimal, because the optimal perturbation, in general, has a complex three-dimensional initial velocity field. That is why in this study we did not aim to generate the truly optimal perturbations, but aimed to produce perturbations that were expected to have a similar non-modal growth mechanism: rolls evolving into streaks. Hence, growth rates of generated perturbations can be essentially lower than those of theoretically optimal ones, so that we can, at best, compare an order of the growth rate.
(ii) Another difficulty is associated with the definition of the ‘growth rate’ in the non-modal case. In the case of an exponentially developing eigenmode,
$v'(z)=A e^{\delta z}$, anemometer measurements of $v'_{exp}(z)$ along a single line immediately yield the growth rate $\delta$ as a slope of the curve $\ln v'_{exp}(z)$ in its linear part. In the case of algebraic (linear) growth, we have
(6.1)At first glance, it is natural to consider the linear coefficient
\begin{align} v'(z)/v'(z_0) &=1+
\varkappa(z-z_0) \Leftrightarrow v'(z)=v'(z_0)+
v'(z_0)\varkappa(z-z_0)\notag\\ &=v'(z_0)+ k(z-z_0).
\end{align}$\varkappa =k/v'(z_0)=({\rm \Delta} v'/{\rm \Delta} z)/v'(z_0)$ as the characteristic of the linear growth. However, such a definition is not invariant with respect to the choice of the initial cross-section $z_0$. Indeed, as $k$ is unchanged downstream for a particular perturbation, whereas the velocity $v'(z)$ grows, taking points from $z_1>z_0$ and $v'(z_1)>v'(z_0)$ as initial values yields a decrease of the experimentally determined $\varkappa$ for the same perturbation. The coefficient $k$ is also inappropriate as a growth measure, since it is not invariant with respect to amplitude of the initial value $v'(z_0)$.


The resolution of the second difficulty comes from the mechanism of non-modal growth. Namely, cross-sectional roller-like motion (rolls) stays almost unchanged downstream, whereas the axial velocity grows approximately linearly. Clearly, taking cross-sections located more downstream as initial conditions will increase the initial energy  $E_0$ and, hence, will decrease the linear growth rate of
 $\sqrt{E(z)/E_0}$. Consequently, the ‘best’ growth will be attained if the initial cross-section is chosen such that the axial velocity is close to zero, and the transverse velocity components (rolls) are dominating in the initial velocity field.
This consideration yields two possible methods for extraction of the growth rate from our experimental measurements. Consider PIV measurements at the longitudinal plane shown in figures 24 and 25. As shown in figure 27(b), its axial velocity varies almost linearly. In the first method, we continue this plot upstream as a linear function and determine the position  $z_0$ at which the axial velocity is close to zero. This location
 $z_0$ is considered as initial, where the perturbation is the ‘closest’ to the optimal, because its initial energy mostly consists of the transverse motion (note that
 $z_0$ can lie upstream of the deflector, i.e. it is a fictional initial position). The fictional initial energy of the perturbation is calculated as
 \begin{equation} K_x(z)=\frac{1}{L U_c^2}\int_L u_x^2(x,z)\,{{\rm d} x}. \end{equation}
It is supposed that  $K_x(z)$ does not depend on
 $z$ for a pure ‘lift-up’ mechanism, and the integration line can be chosen at any location
 $z$. Also, we suppose that in the point
 $z=z_0$, the kinetic energy of rolls makes the most contribution to the perturbation kinetic energy, i.e. we assume that extrapolation of linear function
 $\sqrt {K(z)}$ to the point
 $z=z_0$ should yield
 $K(z_0) \approx K_x (z)$. After that, the experimental dimensionless growth coefficient
 $\varkappa$ is found from the linear relation
 \begin{equation} \sqrt{\frac{K(z)}{K_x}}=1+ \varkappa \frac{z-z_0}{D}. \end{equation}
In further calculations, we used  $K_x = K_x(D)$ and
 $z=z_1=2D$. The experimentally obtained value
 $\varkappa$ is then compared with the theoretical linear growth coefficient of
 $\sqrt {E(z)/E(0)}$ for the optimal perturbation.
This method is theoretically correct for the growth coefficient extraction for a truly optimal perturbation. For our perturbation and for our apparatus, there is an uncertainty in determination of  $z_0$. Namely, considering
 $n=3$ as an example,
 $z_0$ found from
 $u_z^-(z)$ and
 $u_z^+(z)$ plots of figure 27 are
 $z_0^-/D\approx -1.04$ and
 $z_0^+/D\approx 0.13$, respectively. Although these values are different,
 $z_1-z_0$ have the same order, which is sufficient for the extraction of the order of the growth coefficient from (6.3). The estimations of
 $\varkappa$ from the method are shown in figure 29: filled squares correspond to the case when
 $u^-_z$ was used to obtain
 $z_0$, and empty squares relate to determination of
 $z_0$ as zero of
 $u^+_z$.
Growth coefficient  $\varkappa$ found by two different methods. In the first method (1, 2), the minimum and maximum of
 $u_z$ were used, respectively, to estimate
 $z_0$ (see (6.3)). Points (3, 4) relate to the second method for
 $F_{min}(z)$ and
 $F_{max}(z)$, in which the minimum and maximum of
 $K_x$ were used from (6.4a,b), respectively. Cases with different
 $\varepsilon$ are combined and not distinguished.

The second method is based on direct assumption of the distribution (6.3). Minimum ( $K_{x,min}$) and maximum (
 $K_{x,max}$) values of
 $K_x(z)$ from the range
 $1 \le z/D\le 2$ can be taken as
 $K_x$ to show a possible scatter in determination of
 $\varkappa$. Then,
 $\varkappa$ and
 $z_0$ can be found from the least-squares method for linear interpolation of the functions
 \begin{equation} F_{min}(z) = \sqrt{\frac{K(z)}{K_{x,min}}}-1, \quad F_{max}(z)=\sqrt{\frac{K(z)}{K_{x,max}}}-1. \end{equation}
The experiments show that functions (6.4a,b) are quite linear, and corresponding estimations of  $\varkappa$ are shown in figure 29. Due to
 $K_{x,min} \le K_{x,max}$, the magnitudes of
 $\varkappa$ found from
 $F_{min}$ are larger than those found from
 $F_{max}$. All obtained
 $\varkappa$ lie in the range
 $\varkappa \sim 1$–
 $5$, while theoretical calculations of optimal perturbations (figure 6) give
 $\varkappa \sim 30$, which is one order of magnitude larger than that obtained in the experiments. This difference, however, is not surprising due to remark (i): our perturbations are not optimal (only partially reproducing their structure), but still grow according to the same growth mechanism.
Among other available theoretical data, let us note the similarity of the nonlinear evolution of our perturbations to the theoretical study of Wang et al. (Reference Wang, Lesshafft, Cavalieri and Jordan2021). Namely, their figures 2(a–d), demonstrating the nonlinear evolution of optimally perturbed jet, is similar to our observations shown in figure 15: there are clearly distinguishable necks occurring during the evolution of petals. We then may suppose that this kind of nonlinear evolution of perturbation growing in accordance with a ‘lift-up’ mechanism has a general nature and it is not specific for our jet.
7. Conclusions
We experimentally studied the development of disturbances in a submerged jet with a long laminar region by exciting roller-like cross-sectional stationary motion, which was qualitatively similar to optimal perturbations of the flow profile. Visualization of the transverse section of the jet at distances  $z/D=0.5$–
 $3.5$ downstream was performed, the axial component of the velocity downstream was measured with a hot-wire anemometer and a series of PIV measurements of the transverse (
 $z/D=1$–
 $2$) and longitudinal structures of the flow was conducted.
For the first time, we experimentally identified a non-modal mechanism of the disturbances growth in a jet flow, which is an analogue of the ‘lift-up’ mechanism in near-wall flows. The following characteristic features of the lift-up growth mechanism have been confirmed:
(i) the transverse velocity remains approximately constant downstream;
(ii) the axial velocity increases downstream approximately linearly;
(iii) the transverse motion has the form of a ‘roller-like’ movement, transferring the outer layers of the fluid inward and the inner layers outward. This motion causes a local increase in the axial velocity perturbation, which is an analogue of the streaky structure in near-wall flows.
The development of the jet is traced up to the transition to turbulence, which is preceded by the separation of the petals from the jet core and the formation of necks between the core and petals. Shortly after the neck formation, we observed the rapid growth of unsteadiness that finally destroyed the laminar flow.
Thus, the avoidance of the modal growth of Kelvin–Helmholtz waves (due to small incoming turbulence intensity) and the excitation of the non-modal ‘lift-up’ growth mechanism, demonstrated in this work, lead to a different scenario of transition to turbulence, not previously observed in jet flows. Further research into this transition scenario, including transition caused by a combination of modal and non-modal mechanisms of linear growth, can be used in various technical devices for intensifying mixing and heat transfer. It is also possible that careful combination of these two mechanisms will, on the contrary, delay transition in jets, as was demonstrated by Shahinfar et al. (Reference Shahinfar, Sattarzadeh and Fransson2014) in the boundary layer.
Funding
This work is supported by the Russian Science Foundation under grant 20-19-00404.
Declaration of interests
The authors report no conflict of interest.



