



1. Introduction to the model
1.1. Classic SIR model
The susceptible–infected–recovered (SIR) model, introduced in 1927 by Kermack and McKendrick [Reference Kermack and McKendrick14], is a simple system of ordinary differential equations (ODEs) representing the evolution of the spread of an infectious disease in a large population. It belongs to a broader class known as compartmental models in epidemiology. More specifically:
 \begin{equation} s' = - \beta s i, \qquad i' = \beta s i - \gamma i, \qquad r' = \gamma i,\end{equation}
where the prime denotes the derivative with respect to time
 $t\geq 0$
. Here,
 $s = s_t$
,
 $i = i_t$
, and
 $r = r_t$
denote the proportion of the population that is susceptible to the disease, infected, and recovered (or removed), respectively; thus,
 $s+i+r = 1$
. These labels are referred to as compartments.
The rationale behind (1) is as follows. Informally, the size of the population is assumed to be infinite. Encounters between pairs of individuals occur randomly among the population, and a susceptible individual can acquire the disease only when interacting with an infectious individual. The incidence rate, i.e. the global rate at which infections occur, is thus proportional to s, i, and a parameter
 $\beta$
, corresponding to the average number of contacts per person per unit time, multiplied by the probability of disease transmission. Once infected, an individual can then spread the disease to other susceptibles via the same mechanism. After some time, the individual recovers and gains permanent immunity, so can no longer infect others. The global rate of recovery is thus proportional to i and a parameter
 $\gamma$
, where
 $1/\gamma$
is the mean duration of the infectious period.
Remark 1. In the literature, the total number of individuals is typically finite and denoted by N, and (continuous versions of) the actual number of individuals in each compartment is used instead of their proportions, that is,
 $S = Ns$
,
 $I = Ni$
, and
 $R = Nr$
. However, in the present article, the case
 $N<\infty$
will refer to a Markov process representing the random evolution of the number of individuals of each type in the finite population, whose mean-field limit as
 $N\to\infty$
yields (1). Thus, we will reserve the use of N and the capital letters S, I, and R for that setting.
In recent decades, the model (1) and its variants have been used extensively to predict the evolution of disease spread; see, for instance, [Reference Andersson and Britton3, Reference Brauer, Castillo-Chavez and Feng6, Reference Capasso and Serio9, Reference Hethcote12, Reference Liu, Hethcote and Levin18]. In particular, during the COVID-19 pandemic, the SIR model was used as a mathematical tool to study the effect of non-pharmaceutical interventions (NPIs). These are actions taken by authorities and individuals, apart from medical measures such as getting vaccinated and taking medicine, which aim to help slow the spread of the disease; see [Reference Perra20] for an extensive biomedical review. Examples of NPIs include wearing face masks, frequent hand washing, social distancing, bans on social gatherings, lockdowns, border closures, etc. Mathematically, the effects of social distancing and other NPIs are typically modelled by modifying the term
 $\beta i$
in (1), known as the force of infection, either by making
 $\beta$
depend on time or some additional variable (e.g. space), or by considering a non-linear dependence on i. The effects of some NPIs, such as mass testing and contact tracing, are better modelled by shortening the average effective infectious period
 $1/\gamma$
. See, for instance, [Reference Cabrera, Córdova-Lepe, Gutiérrez-Jara and Vogt-Geisse8, Reference Cotta, Naveira-Cotta and Magal10, Reference Kolokolnikov and Iron15, Reference Wangping22].
1.2. SIR model with social gatherings
In the existing literature of compartmental models, the effects of restrictions on social gatherings are typically considered as being part of the joint effect of all the NPIs that aim at decreasing the number of contacts between individuals (social distancing, lockdowns, etc.), or even as part of all the NPIs as a whole; see, for instance, [Reference Cabrera, Córdova-Lepe, Gutiérrez-Jara and Vogt-Geisse8, Reference Cotta, Naveira-Cotta and Magal10, Reference Kain, Childs, Becker and Mordecai13, Reference Kolokolnikov and Iron15]. One exception is [Reference Althouse1], where the authors consider a mathematical model in which the population is split into a fixed number of large gatherings. However, to the best of our knowledge, almost all the available compartmental models still assume, implicitly or explicitly, that the underlying infection mechanism consists of encounters between pairs of individuals, as in the original work of Kermack and McKendrick. Motivated by this, our main goal in this article is to introduce an extension of the classic SIR model (1) that accounts for the way social gatherings take place in the population and to study their effects on the spread of the disease. More importantly, and this is the main contribution of the present work, we provide an explicit probabilistic interpretation for the microscopic (i.e. person-to-person) mechanism of infection in terms of individuals attending these social gatherings.
Remark 2. It is important to note that a very similar model was proposed and studied in the recently published article [Reference Ball and Neal5], written independently and almost simultaneously. Indeed, the first preprint of the present article appeared on arXiv in March 2022, whereas the only available version of [Reference Ball and Neal5] seems to be the published one, which was submitted in May 2022.
We now describe our model. As mentioned earlier, one of the underlying assumptions behind (1) is that encounters always take place between two individuals. In our extended setting, encounters, which we call gatherings, can have any number of individuals. Specifically, in the simplest case where the size of the gatherings is some fixed number
 $\theta \in \{0,1,2,\ldots\}$
, our model is given by the following system of ODEs:
 \begin{equation} s' = - \mu \theta s (1 - (1-p i)^{\theta-1}), \qquad i' = \mu \theta s (1 - (1-p i)^{\theta-1}) - \gamma i, \qquad r' = \gamma i.\end{equation}
Here,
 $\mu>0$
is the rate at which gatherings occur, and
 $p\in[0,1]$
is the probability of transmission of the disease. Note that when
 $\theta = 2$
, we recover the usual SIR model (1) with
 $\beta = 2\mu p$
. The qualitative behaviour of (2) is similar to (1): initially, there is a possible increase in the proportion of infected individuals, then it reaches a maximum, and then it decays to 0; see Lemma 1. This can be seen in Figure 1, where we display the numerical solution of (2) for some values of the parameters.
Evolution of the proportion of infected individuals i, obtained by solving numerically the SIR model with gatherings given by (2), for three different values of
 $\theta$
. Parameters:
 $\mu = 0.5$
,
 $p=0.2$
,
 $\gamma=0.1$
,
 $i_0 = 0.01$
.

The rationale behind the proposed model is the following:
-
• An infected individual recovers at rate
 $\gamma$
, as before.
-
• Gatherings occur at rate
$\mu$
per individual, and are treated as being instantaneous.-
– When a gathering takes place, randomly sample
$\theta$
individuals from the infinite population. That is: independently, perform
$\theta$
times the experiment of sampling from the set
$\{\text{susceptible}, \text{infected}, \text{recovered}\}$
with respective probabilities s, i, and r. -
– Each susceptible in the gathering will attempt to acquire the disease as many times as there are infectious individuals in the room, each time with probability p, independent of everything else. All those susceptibles that acquired the disease at least once, instantaneously and simultaneously become infected.
-



The system in (2) can be obtained from this description; see Section 1.4 for a more detailed but still informal derivation. A completely rigorous justification is provided in Section 5.
1.3. Random size of gatherings
More generally, we can consider the case where the number of individuals attending each gathering is random. That is, the sizes of these instantaneous gatherings can be taken as independent copies of some random variable
 $\Theta$
on
 $\{0,1,2,\ldots\}$
with known distribution. Consequently, the incidence rate
 $\mu \theta s (1 - (1-p i)^{\theta-1} )$
in (2) (with
 $\Theta$
in place of
 $\theta$
) is to be replaced by its expected value. Specifically, the system of ODEs is
 \begin{equation} s' = - \mu s B(i), \qquad i' = \mu s B(i) - \gamma i, \qquad r' = \gamma i,\end{equation}
together with some initial condition
 $(s_0,i_0,r_0) \in [0,1]^3$
such that
 $s_0 + i_0 + r_0 = 1$
, where the function
 $B\colon[0,1] \to \mathbb{R}_+$
is defined as
 \begin{equation} B(i) = \mathbb{E}[\Theta (1 - (1-p i)^{\Theta-1})].\end{equation}
In Section 3 we study the main analytical properties of the system of ODEs in (3): well-posedness is provided in Lemma 1, and in Lemma 2 we show that the disease spreads more slowly, and less in total, than in the classic SIR model (1), provided that the basic reproduction number (recalled in Section 2.2) is the same.
Remark 3. Our proposed mechanism of infection, social gatherings, can be used to obtain variants of other compartmental models, such as susceptible–infected–recovered–susceptible (SIRS), susceptible–infected–recovered–vaccinated (SIRV), susceptible–exposed–infected–recovered (SEIR), maternally derived passive immunity–susceptible–infected–recovered (MSEIR), include birth and death, etc.; see [Reference Hethcote12] for a review. To do so, we simply replace
 $\beta s i$
(or the corresponding term representing the incidence rate) by
 $\mu s B(i)$
, where
 $B(\cdot)$
is given by (4). For example, for the SEIR model, the corresponding extension with gatherings is
 \[ s' = - \mu s B(i), \qquad e' = \mu s B(i) - \varepsilon e , \qquad i' = \varepsilon e - \gamma i, \qquad r' = \gamma i, \]
where
 $e = e_t$
is the proportion of the population that has been exposed to the disease but has not become infectious yet, and the parameter
 $\varepsilon>0$
is the rate at which individuals change from exposed to infected. In the present article we study only the extension to the classic system (1), because it is archetypal and arguably the most well-known model in this setting. Most of our developments can be easily adapted to other variants.
1.4. Model derivation
We now proceed to deduce (2) and (3). The population size is assumed to be infinite, which means that the developments of this section are still informal. We work with a fixed non-random size of gatherings
 $\theta \in \{0,1,2,\ldots\}$
; the general case (3) follows just by taking expectations with respect to the randomness of
 $\Theta$
.
Call U the number of new infections in a gathering with
 $\theta$
individuals chosen randomly among the infinite population, where the proportions of susceptible, infected, and recovered individuals are s, i, and r, respectively. Since the average rate at which individuals change from susceptible to infected corresponds to
 $\mu \mathbb{E}[U]$
, to justify (2) we need to show that
 $\mathbb{E}[U] = \theta s ( 1 - (1-ip)^{\theta-1})$
.
Let
 $\tilde{S}$
,
 $\tilde{I}$
, and
 $\tilde{R}$
be the numbers of susceptible, infected, and recovered individuals, respectively, obtained after sampling
 $\theta$
individuals at random from the infinite population. Clearly,
 $(\tilde{S},\tilde{I},\tilde{R})$
has a multinomial distribution with probabilities (s,i,r). Recall that each of the
 $\tilde{S}$
susceptibles will attempt to acquire the disease
 $\tilde{I}$
times, each time with probability p. Thus, given the value of
 $\tilde{I}$
, the probability that a given susceptible in the room acquires the disease is
 $1-q^{\tilde{I}}$
, where
 $q=1-p$
. Therefore,
 \begin{equation} \mathbb{E}[U \mid \tilde{S},\tilde{I}] = \mathbb{E}\Bigg[\sum_{k=1}^{\tilde{S}}\textbf{1}\{\text{susceptible} \, \textit{k} \, \text {got infected}\} \mid \tilde{S},\tilde{I} \Bigg] = \sum_{k=1}^{\tilde{S}} (1-q^{\tilde{I}}) = \tilde{S} - \tilde{S}q^{\tilde{I}}. \end{equation}
It is clear that
 $\tilde{S} \sim \text{binomial}(\theta,s)$
and
 $\tilde{I} \sim \text{binomial}(\theta,i)$
. Moreover, given the value of
 $\tilde{I}$
, we have
 $\tilde{S} \sim \text{binomial}(\theta - \tilde{I}, {s}/({s+r}))$
, which implies
 $\mathbb{E}[\tilde{S} \mid \tilde{I}] = ({s}/({s+r}))(\theta-\tilde{I})$
. Consequently, using (6), we have
 \begin{equation*} \mathbb{E}\big[\mathbb{E}\big[\tilde{S}q^{\tilde{I}} \mid \tilde{I} \big]\big] = \frac{s}{s+r}\mathbb{E}\big[q^{\tilde{I}} (\theta - \tilde{I})\big] = \frac{s}{s+r}\big(\theta(1-i p)^\theta - \theta q i (1-ip)^{\theta-1}\big) = \theta s (1-ip)^{\theta-1}.\end{equation*}
Taking expectations in (5), we thus obtain the desired expression:
 \[ \mathbb{E}[U] = \theta s - \theta s (1-ip)^{\theta-1} = \theta s(1 - (1-ip)^{\theta-1}).\]
Remark 4. In contrast, when the total population size is
 $N<\infty$
, the
 $\theta$
individuals sampled (without replacement) from the finite population follow a multivariate hypergeometric distribution. When studying the mean-field limit (explained in Section 2.3), one of the key points is a careful analysis on the convergence of this distribution, as
 $N\to\infty$
, to the multinomial (sampling with replacement). This is performed in Step 4 of the proof of Theorem 2.
2. Discussion of the model
2.1. Particular cases
Randomizing the sizes of the gatherings gives the model more flexibility. For instance, if authorities restrict social gatherings to have a maximum size K, then we can work with some
 $\Theta$
whose distribution is supported on
 $\{0,1,\ldots,K\}$
(e.g. discrete uniform). Moreover, if the distribution of
 $\Theta$
is such that the function
 $[0,1] \ni \xi \mapsto \mathbb{E}[\xi^\Theta]$
has an explicit expression, then so does
 $\mathbb{E}[\Theta \xi^{\Theta-1}] = ({{\textrm{d}}}/{{\textrm{d}}\xi}) \mathbb{E}[\xi^\Theta]$
; thus, the function B(i) given by (4) will have a closed form, leading to an explicit system of ODEs. This includes some frequently used distributions, such as the discrete uniform, geometric, negative binomial, etc. We highlight the following particular cases.
Example 1. When
 $\Theta \sim \text{binomial}(K,\alpha)$
, it is easy to check that, for all
 $\xi \in [0,1]$
,
 \begin{equation} \mathbb{E}[\xi^\Theta] = (1 - \alpha (1-\xi))^K, \qquad \mathbb{E}[\Theta \xi^{\Theta-1}] = K \alpha(1 - \alpha (1-\xi))^{K-1}, \end{equation}
which gives
 $B(i) = K \alpha (1 - (1- \alpha p i)^{K-1} )$
. The system of ODEs is (notice that when
 $\alpha = 1$
, we recover (2)):
 \begin{equation} s' = - \mu K \alpha s(1 - (1- \alpha p i)^{K-1}), \qquad i' = \mu K \alpha s(1 - (1- \alpha p i)^{K-1}) - \gamma i, \qquad r' = \gamma i. \end{equation}
Example 2. When
 $\Theta \sim \text{Poisson}(\lambda)$
, it is straightforward to check that
 $\mathbb{E}[\Theta\xi^{\Theta-1}] = \lambda{\textrm{e}}^{-\lambda (1-\xi)}$
for all
 $\xi \in [0,1]$
, which then gives
 $B(i) = \lambda (1 - {\textrm{e}}^{-\lambda p i})$
. The system of ODEs is
 \begin{equation} s' = - \mu \lambda s (1 - {\textrm{e}}^{-\lambda p i} ), \qquad i' = \mu \lambda s (1 - {\textrm{e}}^{-\lambda p i}) - \gamma i, \qquad r' = \gamma i. \end{equation}
Notice that an expression similar to
 $\mu \lambda s (1 - {\textrm{e}}^{-\lambda p i} )$
also appears in the model presented in [Reference Kolokolnikov and Iron15], although the underlying infection mechanism considered there is spatial in nature, and the formula with the exponential is obtained only after an approximation. The present article provides a different microscopic interpretation, by means of gatherings whose size follows a Poisson distribution, which justifies the use of a model like (8).
Example 3. Consider the case where
 $\Theta$
has a logarithmic distribution with parameter
 $\alpha \in (0,1)$
, denoted
 $\Theta \sim \log(\alpha)$
, that is,
 \[ \mathbb{P}(\Theta = k) = \frac{-1}{\log(1-\alpha)} \frac{\alpha^k}{k} \quad \text{for all } k = 1,2,\ldots \]
It is easy to check that
 $$\mathbb{E}[\Theta \xi^{\Theta-1}] = \frac{-1}{\log(1-\alpha)} \frac{\alpha}{1-\alpha \xi}$$
for all
 $\xi \in [0,1]$
, which, after a straightforward computation, gives
 \[ B(i) = \frac{a i}{1 + b i} \quad \text{for } a = \frac{-\alpha^2 p}{(1-\alpha)^2 \log(1-\alpha)} \text{ and } b = \frac{\alpha p}{1-\alpha}. \]
The system of ODEs reads:
 \begin{equation} s' = - \frac{\mu a s i}{1+bi}, \qquad i' = \frac{\mu a s i}{1+bi} - \gamma i, \qquad r' = \gamma i. \end{equation}
This model, with an incidence rate of the form
 ${\mu a s i}/({1+bi})$
for some constants a,b, was studied in [Reference Capasso and Serio9] as the main example. One of its features is that it can be solved explicitly in the s–i plane:
 \[ i(s) = \begin{cases} -\dfrac{1}{b} + C s^\rho + \dfrac{s}{\rho - 1},\quad & \rho \neq 1, \\ -\dfrac{1}{b} + Cs - s \log s, & \rho = 1, \end{cases} \]
where
 $\rho = {\gamma b}/{\mu a}$
and C is a constant depending on the initial condition
 $(s_0, i_0)$
; see [Reference Capasso and Serio9, Section 6] for more details. Again, the present article provides a probabilistic justification for the use of a model like (9) by means of gatherings whose size follows a logarithmic distribution.
2.2. Reproduction number
The basic reproduction number
 $\mathcal{R}_0$
is a crucial quantity in many epidemiological models. It is defined as the average number of new infections produced by an infected individual in a large population where almost everyone is susceptible to the disease. Its importance comes from the fact that the initial behaviour of the system (i.e. the initial increase or decline of the small infected population) depends on whether the basic reproduction number exceeds the threshold value of 1. In other words, a major epidemic outbreak is possible if and only if
 $\mathcal{R}_0>1$
.
Mathematically,
 $\mathcal{R}_0$
is the overall rate of new infections divided by the overall rate of recoveries when
 $i \approx 0$
and
 $r = 0$
(then
 $s=1-i$
). For (1), this gives
 $\mathcal{R}_0 = \beta/\gamma$
. For our extended model (3), we thus have
 \[ \mathcal{R}_0 = \lim_{i\to 0} \frac{\mu (1-i) B(i)}{\gamma i} = \frac{\mu B'(0)}{\gamma}.\]
From (4), we see that
 $B'(i) = p \mathbb{E}[\Theta (\Theta-1) (1-pi)^{\Theta-2}]$
, and then
 $\mathcal{R}_0 = ({\mu p}/{\gamma}) \mathbb{E}[\Theta(\Theta-1)]$
.
For instance:
-
• when
$\Theta \equiv \theta$
(model (2)), we have
$\mathcal{R}_0 = \mu p \theta(\theta-1) / \gamma$
; -
• if
$\Theta \sim \text{binomial}(K,\alpha)$
(model (7)), then
$\mathcal{R}_0 = \mu p \alpha^2 K(K-1) / \gamma$
; -
• if
$\Theta \sim \text{Poisson}(\lambda)$
(model (8)), then
$\mathcal{R}_0 = \mu p \lambda^2 / \gamma$
; and -
• if
$\Theta \sim \log(\alpha)$
(model (9)), then
$$ \mathcal{R}_0 = -\frac{\mu p \alpha^2}{\gamma (1-\alpha)^2 \log(1-\alpha)} = -\frac{\mu p\log(1-\alpha) \mathbb{E}[\Theta]^2}{\gamma}. $$






Notice that in these examples (and possibly many others)
 $\mathcal{R}_0$
grows quadratically with the average size of the gatherings. This fact may provide a new insight on the way that NPIs such as social distancing and lockdowns affect the spread of the disease. For instance, it may be a tool to determine how restriction policies on social gatherings should be defined; or it may be helpful to better understand why infection rates can rise significantly after lockdowns are lifted [Reference Bruckhaus7].
2.3. Finite-population stochastic dynamics and mean-field limit
The informal description of the classic SIR model (1) by means of interactions between pairs of individuals in an infinite population given in Section 1.1 can be made precise. To do so, we consider
 $N<\infty$
individuals subjected to these random encounters, giving rise to a jump Markov process on
 $\{0,\ldots,N\}^3$
corresponding to the evolution of the disease in the finite population. Compared to the completely deterministic system of ODEs, this stochastic process provides a more realistic representation of the complex random interactions that take place in a real-life epidemic. Nevertheless, despite the intrinsic randomness of this process, it can be shown that the proportions of susceptible, infected, and recovered individuals converge to the solution of (1) in the limit as
 $N\to\infty$
. This is a kind of law of large numbers, known as the mean-field limit of the finite population dynamics. This type of result is essential, because it gives a full mathematical validation for the model. It was first proven in [Reference Kurtz16], see also [Reference Ethier and Kurtz11, Chapter 11, Theorem 2.1] and [Reference Andersson and Britton3, Theorem 5.2]; for a more recent and elementary proof, see [Reference Armbruster and Beck4].
More generally, we can also study the finite-population case for our proposed model (3). Let us thus consider the jump Markov process
 $X_t^N = (S_t^N, I_t^N, R_t^N)$
on
 $\{0,\ldots,N\}^3$
corresponding to the evolution of the numbers of susceptible, infected, and recovered individuals in the N-population, whose evolution consists of random social gatherings and recoveries, as described heuristically in Section 1.2 for the case of an infinite population and
 $\Theta$
constant. Specifically, when
 $X_t^N$
is at state (S,I,R), its dynamics are as follows:
-
• At rate
$\gamma I$
, a recovery takes place: jump from (S,I,R) to
$(S,I-1,R+1)$
. -
• At rate
$\mu N$
, an instantaneous gathering takes place:-
– Sample the size of the gathering
$\Theta$
; if
$\Theta>N$
, nothing happens. -
– Sample
$\Theta$
individuals at random, without replacement, from the finite population; call
$\tilde{S}^N$
,
$\tilde{I}^N$
, and
$\tilde{R}^N$
the numbers of selected suceptibles, infected, and recovered (thus,
$\tilde{S}^N + \tilde{I}^N + \tilde{R}^N = \Theta$
). -
– Each of the
$\tilde{S}^N$
selected susceptibles will attempt to acquire the disease
$\tilde{I}^N$
times, each time with probability p, independent of everything else. That is, if
$J_k \in \{0, 1\}$
denotes the random variable that is equal to 1 when selected susceptible
$k \in \{1,\ldots,\tilde{S}^N\}$
got infected, and 0 otherwise, then it is clear that
$1-J_k \sim \text{Bernoulli}((1-p)^{\tilde{I}^N})$
. -
– Jump from (S,I,R) to
$(S-J,I+J,R)$
, where
$J = \sum_{k=1}^{\tilde{S}^N} J_k$
is the number of new infections.
-




The process starts at
 $t=0$
from some given random vector
 $X_0^N = (S_0^N, I_0^N, R_0^N)$
satisfying
 $S_0^N + I_0^N + R_0^N = N$
. This description unambiguously specifies the evolution of the process, which clearly satisfies
 $S_t^N + I_t^N + R_t^N = N$
for all
 $t\geq 0$
; see also Section 4 for an explicit stochastic equation in terms of Poisson random processes. In Section 5 we study the mean-field limit of
 $X_t^N$
, i.e. we show that the proportions
 $S_t^N/N$
,
 $I_t^N/N$
, and
 $R_t^N/N$
converge, as
 $N\to\infty$
, to the solution
 $(s_t,r_t,i_t)$
of (3), just as in the classic setting (1). This provides a completely rigorous mathematical justification for our model.
2.4. Relation to previous work
The present article extends the classic SIR model (1) [Reference Kermack and McKendrick14] by introducing a non-linear dependence of the force of infection on i. This is not new; for instance, in [Reference Liu, Hethcote and Levin18, Reference Liu, Levin and Iwasa19] the authors consider incidence rates of the kind
 $s^a i^b / (1+ci^{b-1})$
for some constants
 $a,b,c>0$
, and study the dynamical behaviour of the associated system of ODEs. Similarly, in [Reference Capasso and Serio9] the authors replace the term
 $\beta i$
in (1) by a general non-linear function satisfying some properties. One of the motivations of the authors was to capture the phenomenon of saturation (see also [Reference Kolokolnikov and Iron15]): as the number of infected individuals increases, the force of infection slows down, no longer increasing linearly. Since this is certainly the case for (3) (unless
 $\Theta \in \{0,1,2\}$
almost surely (a.s.), see Proposition 1), the present paper can be seen as introducing a broad class of such non-linear functions
 $\mu B(i)$
by means of (4). Moreover, our model provides an intuitive explanation for the saturation phenomenon: social gatherings induce some redundancy in the infection mechanism. In other words, when the population has a significant number of infected individuals, some of their infectious power is lost because many gatherings will have few susceptibles available.
As mentioned in Section 2.1, specific choices for the distribution of
 $\Theta$
yield formulas for the incidence rate, already studied in the literature, of the form
 $s(1 - {\textrm{e}}^{-a i})$
[Reference Kolokolnikov and Iron15] and
 ${a s i}/({1+bi})$
[Reference Capasso and Serio9]. This shows that our proposed model is flexible and mathematically relevant, and at the same time it provides a probabilistic foundation for the use of those specific incidence rates.
Regarding the mean-field limit, it has been established for a model on
 $\mathbb{R}^d$
that is much more general than (1); see, for instance, [Reference Andersson and Britton3, Reference Ethier and Kurtz11, Reference Kurtz16]. In Section 4 we also state and prove a mean-field result in a similar general setting, suitable for our purposes; see Theorem 1. However, we remark that in the context of those references, the finite-population dynamics depend only on the proportions of each compartment, whereas in our proposed model (3) we need to know the actual number of individuals in each compartment in order to sample the attendants of the gatherings. Consequently, the setting that we consider in Section 4 is slightly more general; specifically, the jump-rate functions will be allowed to depend on N. In Section 5 we apply this to prove Theorem 2, which establishes the mean-field limit for (3).
Remark 5. In [Reference Ball and Neal5], a proof for a mean-field result similar to our Theorem 2 is given. Moreover, the authors also prove a central limit theorem for the temporal evolution and for the final size of a major outbreak, alongside other related results.
3. Main properties
In this section we study the analytical behaviour of our proposed model (3). The following proposition summarizes the main properties of the function B(i) that we will use throughout this article. The proof is straightforward, so we omit it. To avoid trivial situations, in all that follows we will assume that
 $\Theta$
, the random variable on
 $\{0,1,2,\ldots\}$
giving the size of the gatherings, satisfies
 $\mathbb{P}(\Theta \geq 2) >0$
and
 $\mathbb{E}[\Theta^2] < \infty$
.
Proposition 1.
Fix
 $p\in(0,1]$
; then, the function
 $B\colon [0,1] \to \mathbb{R}_+$
given by (4) satisfies the following properties:
-
(i)
$B(0) = 0$
and
$B'(0) = p \mathbb{E}[\Theta(\Theta-1)] > 0$
. -
(ii) B is strictly increasing.
-
(iii) B is Lipschitz continuous and concave. Moreover,
$B(i) = B'(0)i$
if and only if
$\Theta \in \{0,1,2\}$
a.s.; otherwise B is strictly concave.


We now state the main properties of the solution of the system (3). Notice that, thanks to the previous proposition, our setting is very similar to the one in [Reference Capasso and Serio9]. Thus, the proof of the next lemma is a straightforward adaptation of the arguments in [Reference Capasso and Serio9, Section 4], so we omit it here.
Lemma 1.
There exists a unique continuously differentiable solution
 $(s_t,i_t,r_t)_{t\geq 0}$
to (3). Moreover, it satisfies the following properties:
-
(i)
$(s_t, i_t, r_t) \in [0,\infty)^3$
for all
$t\geq 0$
. If
$s_0>0$
,
$i_0>0$
, then
$(s_t, i_t, r_t) \in (0,\infty)^3$
for all
$t > 0$
. -
(ii)
$s_t + i_t + r_t = 1$
for all
$t\geq 0$
. -
(iii)
$s_t$
is decreasing and
$r_t$
is increasing. Moreover, if
$s_0 \leq \gamma i_0 / (\mu B(i_0))$
, then
$i_t$
is decreasing; otherwise,
$i_t$
first increases up to a maximum value, and then decreases.
-
(iv) There exists
$s_\infty \in [0,1]$
such that
$\lim_{t\to\infty} (s_t,i_t,r_t) = (s_\infty,0,1-s_\infty)$
. If
$s_0 \in (0,1)$
, then
$s_\infty \in (0,1)$
as well.


The next lemma tells us that the proportion of susceptibles in our proposed model (3) is always bounded below by the corresponding proportion for the classic SIR model (1), provided that
 $\beta = \mu B'(0)$
and that both have the same initial conditions. In other words, assuming the same basic reproduction number, the disease spreads more slowly in our setting, and a higher proportion of the population never gets infected, i.e. the value of
 $s_\infty$
is higher. In Figure 2 we illustrate this fact numerically. This was already hinted in [Reference Capasso and Serio9]; for the convenience of the reader, we provide a precise statement and proof here.
Evolution of the proportion of susceptible individuals s, obtained by solving numerically the model (3) with
 $\mu = 0.02$
,
 $\gamma = 0.04$
,
 $p=1$
, and
 $i_0 = 0.01$
, for three different values of
 $\mathcal{R}_0$
and three choices of the function B(i). In each plot, the parameters c,
 $\theta$
, and
 $\lambda$
were chosen such that
 $\mathcal{R}_0 = {\mu B'(0)}/{\gamma}$
is the same for the three functions B(i); that is, they satisfy
 $c = \theta(\theta-1) = \lambda^2$
. Note that for the classic SIR model (1), i.e.
 $B(i) = ci$
, the s curve remains below the other two.

Lemma 2.
Let
 $\beta = \mu B'(0)$
. Denote by
 $(s_t,i_t,r_t)$
and
 $(\hat{s}_t,\hat{\imath}_t,\hat{r}_t)$
the solutions to (3) and (1) respectively, with the same initial conditions
 $(s_0,i_0,r_0)$
,
 $s_0,i_0>0$
. Write
 $i = i(s)$
and
 $\hat{\imath} = \hat{\imath}(s)$
for the proportions of infected individuals in terms of the variable
 $s \in (0,s_0]$
of the proportion of susceptibles. Then
 $i(s) \leq \hat{\imath}(s)$
for all
 $s\in(0,s_0]$
, and
 $s_t \geq \hat{s}_t$
for all
 $t\geq 0$
.
Proof. By Lemma 1, we have
 $s_t,i_t,r_t>0$
for all
 $t>0$
. We assume that B is strictly concave; if not, then Proposition 1(iii) gives
 $B(i) = B'(0) i$
, which implies that
 $i(s) \equiv \hat{\imath}(s)$
and
 $s_t \equiv \hat{s}_t$
. From (3) and (1), we obtain
 \[ \frac{{\textrm{d}} i}{{\textrm{d}} s} = -1 + \frac{\gamma i}{\mu s B(i)} \qquad \text{and} \qquad \frac{{\textrm{d}}\hat{\imath}}{{\textrm{d}} s} = -1 + \frac{\gamma}{\mu s B'(0)}. \]
Consequently, for
 $u = u(s) = i(s) - \hat{\imath}(s)$
, since
 $B(i) < B'(0)i$
for
 $i>0$
we have
 \[ \frac{{\textrm{d}} u}{{\textrm{d}} s} = \frac{\gamma}{\mu s} \bigg(\frac{i}{B(i)} - \frac{1}{B'(0)}\bigg) > 0. \]
Since
 $u(s_0) = 0$
, this gives
 $u(s) < 0$
, that is,
 $i(s) < \hat{\imath}(s)$
for all
 $s \in (0,s_0)$
.
Now, let’s go back to time variables. We argue by contradiction: assume that there exists
 $\bar{t}$
such that
 $s_{\bar{t}} < \hat{s}_{\bar{t}}$
. Let
 $t_* \in [0, \bar{t})$
be the last time that
 $s_t$
and
 $\hat{s}_t$
were equal. We thus have
 \[ s^{\prime}_{t_*} = - \mu s_{t_*} B(i_{t_*}) > - \mu \hat{s}_{t_*} B'(0) i_{t_*} > - \mu \hat{s}_{t_*} B'(0) \hat{\imath}_{t_*} = \hat{s}^{\prime}_{t_*}, \]
which contradicts the definition of
 $t_*$
. Thus, we must have
 $s_t \geq \hat{s}_t$
for all
 $t \geq 0$
.
4. Mean-field limit for a general model
Our goal now is to study the mean-field limit of the jump Markov process corresponding to the evolution of the disease in a finite population of size N for our SIR model with gatherings (3), as described in Section 2.3. To that end, in this section we first prove the desired convergence in a much more general setting; then, in Section 5 we apply this result to (3). We follow and generalize slightly the developments of [Reference Andersson and Britton3, Chapter 5]; see also [Reference Ethier and Kurtz11, Chapter 11].
Let us describe the general model. Fix the total number of individuals
 $N \in \mathbb{N}$
. Let
 $(X_t^N)_{t\geq 0}$
be the jump Markov process on
 $\{0,\ldots,N\}^d$
, starting from some given random initial condition
 $X_0^N \in \{0,\ldots,N\}^d$
, such that, for all states
 $x \in \{0,\ldots,N\}^d$
and jump amplitudes
 $\ell \in \mathbb{Z}^d$
,
 \begin{equation} \text{a jump from} \, \textit{x} \, \text{to $x+\ell$ occurs at rate $N \lambda_\ell^N(x)$.}\end{equation}
Here,
 $\lambda_\ell^N \colon \{0,\ldots,N\}^d \to \mathbb{R}_+$
is a rate function such that
 $\lambda_\ell^N(x) = 0$
whenever
 $x+\ell \notin \{0,\ldots,N\}^d$
; this ensures that the process remains in
 $\{1,\ldots,N\}^d$
.
Example 4. For our SIR model with gatherings we have
 $d=3$
, and the rate functions
 $\lambda_\ell^N(\cdot)$
can be non-zero only for two types of jump amplitudes
 $\ell \in \mathbb{Z}^3$
:
 \begin{align*} \ell_0 & :\!= (0,-1,1) & \text{(recovery)}, \\ \ell_k &:\!= (\!-k,k,0), \quad k=1,\ldots,N & \text{(infection of} \, \textit{k} \, \text{susceptibles)}. \end{align*}
Specifically, for any
 $(S,I,R) \in \{0,\ldots,N\}^3$
with
 $S+I+R = N$
,
 \begin{equation*} \lambda_{\ell_0}^N(S,I,R) = \gamma \frac{I}{N}, \qquad \lambda_{\ell_k}^N(S,I,R) = \mu \mathbb{P}[U^N = k], \end{equation*}
where
 $U^N \in \{0,\ldots,S\}$
is the random variable of the number of newly infected individuals in a gathering of size
 $\Theta$
sampled randomly without replacement from the finite population (S,I,R). Notice that whereas we can write
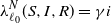 $\lambda_{\ell_0}^N(S,I,R) = \gamma i$
(dependence only on
 $i=I/N$
), the functions
 $\lambda_{\ell_k}^N(S,I,R)$
for
 $k=1,\ldots,N$
do depend on N through the distribution of
 $U^N$
. This shows why the general model that we just introduced allows the rate functions to depend on N.
It is convenient to write the process
 $X_t^N$
explicitly. To that end, consider a collection
 $(\mathcal{P}_\ell(t))_{\ell \in \mathbb{Z}^d}$
of independent Poisson processes on
 $\mathbb{R}$
with intensity 1. It is straightforward to see that the stochastic equation
 \begin{equation} X_t^N = X_0^N + \sum_{\ell \in \mathbb{Z}^d}\ell\mathcal{P}_\ell\bigg(N\int_0^t\lambda_\ell^N(X_s^N)\,{\textrm{d}} s \bigg)\end{equation}
indeed defines a process with jump intensities given by (10).
In Theorem 1 we present a convergence result for the process
 $Z_t^N = ({1}/{N}) X_t^N$
, which is a more general version of [Reference Andersson and Britton3, Theorem 5.2]. In that reference, the proof was based on the following well-known fact: for a Poisson process
 $\mathcal{P}(t)$
on
 $\mathbb{R}$
with intensity
 $\lambda$
, for all
 $T\geq 0$
,
 \begin{equation} \lim_{N\to\infty} \sup_{t \leq T} \bigg|\frac{1}{N}\mathcal{P}(Nt) - \lambda t\bigg| = 0\quad \text{a.s.}\end{equation}
In the present paper, because our setting is more general (in particular, the jump rate functions
 $\lambda_\ell^N(x)$
are not required to be identically 0 for all but finitely many
 $\ell$
s, uniformly on N), we will need the following stronger version. The proof is somewhat technical, so it may be skipped at first reading. In what follows,
 $|\cdot|$
denotes the 1-norm on
 $\mathbb{R}^d$
.
Lemma 3.
Consider a collection of non-negative numbers
 $(\bar{\lambda}_\ell)_{\ell \in \mathbb{Z}^d}$
such that
 $\sum_{\ell} |\ell| \bar{\lambda}_\ell < \infty$
, and define the process
 $\mathcal{Q}(t) = \sum_{\ell \in \mathbb{Z}^d} \ell \mathcal{P}_\ell( \bar{\lambda}_\ell t)$
on
 $\mathbb{Z}^d$
. Then
 $\mathcal{Q}$
is well defined. Moreover, for
 $\bar{\lambda} = \sum_{\ell} \ell \bar{\lambda}_\ell \in \mathbb{R}^d$
, it satisfies, for all
 $T\geq 0$
,
 \[ \lim_{N\to\infty} \sup_{t \leq T} \bigg|\frac{1}{N}\mathcal{Q}(Nt) - t\bar{\lambda}\bigg| = 0 \quad \text{a.s.} \]
Proof. For simplicity we work with
 $d=1$
; the general case is obtained by arguing component-wise.
Note that
 $\big|\mathbb{E}[\mathcal{Q}(t)]\big| \leq \sum_\ell |\ell| \bar{\lambda}_\ell t < \infty$
, and thus
 $\mathcal{Q}$
is well defined. To prove the desired convergence, the main idea of the argument, which can be found in [Reference Ethier and Kurtz11, Chapter 11, Theorem 2.1], is that
 \begin{align*} \lim_{N\to\infty} \sup_{t \leq T} \bigg|\frac{1}{N}\mathcal{Q}(Nt) - t \bar{\lambda}\bigg| & \leq \lim_{N\to\infty} \sum_{\ell \in \mathbb{Z}} |\ell| \sup_{t \leq T} \bigg|\frac{1}{N} \mathcal{P}_\ell(\bar{\lambda}_\ell N t) - \bar{\lambda}_\ell t\bigg| \\ & = \sum_{\ell \in \mathbb{Z}} |\ell| \lim_{N\to\infty} \sup_{t \leq T} \bigg| \frac{1}{N} \mathcal{P}_\ell(\bar{\lambda}_\ell N t) - \bar{\lambda}_\ell t \bigg|, \end{align*}
which equals 0 thanks to (12). However, it is not obvious that we can exchange the limit and the summation; we spend the rest of the proof justifying this step. We will use the following ‘converse’ of the dominated convergence theorem, which can be found in [Reference Rennie21].
Proposition 2.
Let
 $f_N, f$
be integrable functions on a
 $\sigma$
-finite measure space
 $(E,\nu)$
such that
 $\lim_N f_N = f$
 $\nu$
-a.s., and
 $\lim_N \int f_N g \,{\textrm{d}}\nu = \int f g \,{\textrm{d}}\nu$
for all g bounded and measurable. Then, any subsequence of
 $(f_N)_{N\in\mathbb{N}}$
has a sub-subsequence which is dominated by an integrable function.
Now, let
 $h_N(\ell)=|\ell|\sup_{t \leq T}|({1}/{N})\mathcal{P}_\ell(\bar{\lambda}_\ell Nt)-\bar{\lambda}_\ell t|$
. We want to show that
 $\lim_N \sum_\ell h_N(\ell) = 0$
. We argue by contradiction: assume that, modulo subsequence, we have
 $\lim_N \sum_\ell h_N(\ell) = a > 0$
. Note that
 \begin{equation} h_N(\ell) \leq |\ell|\frac{1}{N}\mathcal{P}_\ell(\bar{\lambda}_\ell NT) + |\ell|\bar{\lambda}_\ell T =\!:\,\, f_N(\ell). \end{equation}
We apply Proposition 2 in the measure space
 $E=\mathbb{Z}$
with
 $\nu$
being the counting measure. Fix
 $g \colon \mathbb{Z} \to \mathbb{R}$
bounded. Then
 \begin{equation*} \int f_N g\,{\textrm{d}}\nu = \sum_{\ell\in\mathbb{Z}}|\ell|\frac{1}{N}\mathcal{P}_\ell(\bar{\lambda}_\ell NT)g(\ell) + T\sum_{\ell\in\mathbb{Z}}|\ell|\bar{\lambda}_\ell g(\ell) = \frac{1}{N}\sum_{k=1}^N Y_k + T\sum_{\ell\in\mathbb{Z}}|\ell|\bar{\lambda}_\ell g(\ell), \end{equation*}
where
 $Y_k :\!= \sum_{\ell \in \mathbb{Z}}|\ell|g(\ell)\{\mathcal{P}_\ell(k\bar{\lambda}_\ell T) - \mathcal{P}_\ell((k-1)\bar{\lambda}_\ell T)\}$
. Since the
 $\mathcal{P}_\ell$
have independent increments, we see that
 $(Y_k)_{k\in \mathbb{N}}$
are independent and identically distributed, with
 $\mathbb{E}[Y_k] = T \sum_\ell |\ell| \bar{\lambda}_\ell g(\ell) < \infty$
. Thus, by the strong law of large numbers, we deduce that
 $({1}/{N}) \sum_{k=1}^N Y_k$
converges to
 $T \sum_\ell |\ell| \bar{\lambda}_\ell g(\ell)$
,
 $\mathbb{P}$
-a.s. Consequently,
 $\lim_N \int f_N g \,{\textrm{d}}\nu = \int f g \,{\textrm{d}}\nu$
for the
 $\nu$
-integrable function
 $f(\ell) :\!= 2T |\ell| \bar{\lambda}_\ell$
. Similarly, for all
 $\ell$
,
 $\lim_N f_N(\ell) = f(\ell)$
,
 $\mathbb{P}$
-a.s.
We can thus apply Proposition 2 and deduce that, modulo subsequence,
 $f_N$
is dominated by some
 $\nu$
-integrable function. By (13), this implies that
 $h_N$
is also dominated. The dominated convergence theorem now gives
 $0<a=\sum_{\ell\in\mathbb{Z}}\lim_{N\to\infty}h_N(\ell)=0$
, thanks to (12). This is a contradiction, which concludes the proof.
In order to state and prove our general result, rather than dealing directly with
 $\lambda_\ell^N(x)$
, which gives the rate for each jump amplitude
 $\ell \in \mathbb{Z}^d$
, it is convenient to study the expected jump rate amplitudes, so we define the function
 \begin{equation} F^N(z) = \sum_{\ell \in \mathbb{Z}^d} \ell \lambda_\ell^N(Nz) \quad \text{for all } z \in \bigg\{0,\frac{1}{N},\ldots,1\bigg\}^d.\end{equation}
That is, when the process is at state Nz, the vector
 $F^N(z)$
corresponds to the expected jump rate amplitudes. We will require that
 $F^N$
converges in some sense to a function
 $F \colon [0,1]^d \to \mathbb{R}^d$
as
 $N\to\infty$
. We will quantify this using the uniform norm,
 \begin{equation} \Vert F^N - F \Vert_\infty :\!= \sup_{z \in \{0,{1}/{N},\ldots,1 \}^d} |F^N(z) - F(z)|.\end{equation}
Moreover, given some
 $z_0 \in [0,1]^d$
, we will typically denote by
 $(z_t)_{t\geq 0}$
the solution to the differential equation in integral form
 \begin{equation} z_t = z_0 + \int_0^t F(z_s) \,{\textrm{d}} s \quad \text{for all } t\geq 0.\end{equation}
Theorem 1. Let
 $(X_t)_{t\geq 0}$
be the jump Markov process on
 $\{0,\ldots,N\}^d$
given by the rule in (10), and write
 $Z_t^N = ({1}/{N})X_t^N$
. Assume that there exist a collection of non-negative numbers
 $(\bar{\lambda}_\ell)_{\ell \in \mathbb{Z}^d}$
and a function
 $F\colon [0,1]^d \to \mathbb{R}^d$
such that:
-
(i)
$\lambda_\ell^N(x) \leq \bar{\lambda}_\ell$
for all
$N\in \mathbb{N}$
and
$x \in \{0,\ldots,N\}^d$
, and
$\sum_\ell |\ell| \bar{\lambda}_\ell < \infty$
; -
(ii) F is Lispchitz, and
$\lim_N \Vert F^N - F \Vert_\infty =0 $
.



Assume also that
 $\lim_N Z_0^N = z_0$
a.s. for some
 $z_0 \in [0,1]^d$
, and let
 $(z_t)_{t\geq 0}$
be the solution to (16) associated with F. Then, for all
 $T\geq 0$
,
 $\lim_{N\to\infty} \sup_{t \leq T} |Z_t^N - z_t| = 0$
a.s.
Proof. The proof is an extension of [Reference Andersson and Britton3, Theorem 5.2]. Let
 $\hat{\mathcal{P}}_\ell(t) = \mathcal{P}_\ell(t) -t$
. From (11), dividing by N gives
 \[ Z_t^N = Z_0^N + \frac{1}{N}\sum_{\ell\in\mathbb{Z}^d}\ell\hat{\mathcal{P}}_\ell \bigg(N\int_0^t\lambda_\ell^N(NZ_s^N)\,{\textrm{d}} s\bigg) + \int_0^t F^N(Z_s^N) \,{\textrm{d}} s. \]
From (16), for all
 $t\leq T$
,
 \begin{align*} |Z_t^N - z_t| & \leq |Z_0^N - z_0| + \sup_{s\leq t}\bigg|\frac{1}{N}\sum_{\ell\in\mathbb{Z}^d}\ell\hat{\mathcal{P}}_\ell \bigg(N\int_0^s\lambda_\ell^N(NZ_u^N)\,{\textrm{d}} u\bigg)\bigg| + \int_0^t |F^N(Z_s^N) - F(z_s)| \,{\textrm{d}} s \\ & \leq |Z_0^N - z_0| + \sup_{s\leq t}\bigg|\frac{1}{N}\sum_{\ell\in\mathbb{Z}^d}\ell\hat{\mathcal{P}}_\ell(N\bar{\lambda}_\ell s)\bigg| + t \Vert F^N - F \Vert_\infty + L \int_0^t |Z_s^N - z_s| \,{\textrm{d}} s, \end{align*}
where in the second term we used that
 $\lambda_\ell^N(\cdot) \leq \bar{\lambda}_\ell$
, and in the third term we added and subtracted
 $F(Z_s^N)$
and used that F is L-Lipschitz. Using Grönwall’s lemma, we thus obtain
 \[ |Z_t^N - z_t| \leq \bigg(|Z_0^N - z_0| + \sup_{s\leq t}\bigg|\frac{1}{N} \sum_{\ell\in\mathbb{Z}^d}\ell\hat{\mathcal{P}}_\ell(N\bar{\lambda}_\ell s)\bigg| + t \Vert F^N - F \Vert_\infty \bigg) {\textrm{e}}^{L t}. \]
Thus,
 $\sup_{t\leq T} |Z_t^N - z_t|$
is bounded by the right-hand side with t replaced by T. The first and third terms converge to 0 as
 $N\to\infty$
by assumption; the second term also converges to 0 thanks to Lemma 3. The result follows taking limits.
5. Mean-field limit for the SIR model with gatherings
Finally, we use Theorem 1 to state and prove the following result, which establishes the mean-field limit of the finite-population Markov process associated with our proposed model (3).
Theorem 2.
Let
 $X_t^N$
be the Markov process on
 $\{0,\ldots,N\}^3$
described in Section 2.3 and Example 1. Write
 $Z_t^N = ({1}/{N}) X_t^N$
, and let
 $z_t = (s_t,i_t,r_t)$
be the solution to (3). Assume that
 $\lim_N Z_0^N = z_0$
. Then, for all
 $T\geq 0$
,
 $\lim_{N\to \infty} \sup_{t\leq T} |Z_t^N - z_t| = 0$
a.s.
Proof. Let us fix some notation. Denote by
 $W^N = (\tilde{S}^N, \tilde{I}^N, \tilde{R}^N)$
(respectively,
 $W = (\tilde{S}, \tilde{I}, \tilde{R})$
) the number of selected susceptible, infected, and recovered individuals in a gathering, drawn at random, without replacement, from a finite population with sizes
 $(S,I,R) \in \{0,\ldots,N\}^3$
,
 $S+I+R=N$
(respectively, an infinite population with proportions
 $(s,i,r) = ({S}/{N}, {I}/{N}, {R}/{N})$
). Given the value of
 $\Theta$
, it is clear that
 $W^N$
has a multivariate hypergeometric distribution, whereas W is multinomial. Also,
 $U^N$
(respectively, U) denotes the number of new infections in the gathering in the finite case (respectively, infinite).
We will apply Theorem 1, for which we need to check that conditions (i) and (ii) are satisfied. We adopt the general notation of Section 4. We split the proof into five steps.
Step 1. We first check condition (i) of Theorem 1. With the notation of Example 4, we only need to find uniform (in N) bounds for the rate functions
 $\lambda_{\ell_0}^N$
and
 $\lambda_{\ell_k}^N$
,
 $k=1,\ldots,N$
. For the former we have
 $\lambda_{\ell_0}^N(S,I,R) = \gamma{I}/{N} \leq \gamma =\!:\, \bar{\lambda}_{\ell_0}$
, whereas for
 $k=1,\ldots,N$
,
 \begin{equation*} \lambda_{\ell_k}^N(S,I,R) = \mu \mathbb{P}[U^N = k] = \mu \sum_{\theta = k}^N \mathbb{P}[U^N = k \mid \Theta = \theta] \mathbb{P}[\Theta = \theta] \leq \mu \mathbb{P}[\Theta \geq k]\, =\!:\, \bar{\lambda}_{\ell_k}. \end{equation*}
Consequently,
 \begin{equation*} \sum_{\ell \in \mathbb{Z}^d} |\ell| \bar{\lambda}_\ell^N = |\ell_0| \gamma + \mu \sum_{k=1}^\infty |\ell_k| \mathbb{P}[\Theta \geq k] \leq 2 \gamma + 2 \mu \sum_{k=1}^\infty k \mathbb{P}[\Theta \geq k] = 2 \gamma + 2 \mu \mathbb{E}\bigg[\frac{\Theta(\Theta+1)}{2}\bigg], \end{equation*}
which is finite thanks to the assumption
 $\mathbb{E}[\Theta^2] < \infty$
. Thus, condition (i) is satisfied.
Step 2. We now aim to check condition (ii) of Theorem 1. From Example 4 and the definition of
 $F^N$
in (14) we see that
 $F^N(s,i,r) = (-\mu \mathbb{E}[U^N], \mu \mathbb{E}[U^N] - \gamma i, \gamma i)$
, and the natural candidate for the limiting function F is
 \begin{equation*} F(s,i,r) = (-\mu \mathbb{E}[U], \mu \mathbb{E}[U] - \gamma i, \gamma i) = (-\mu s B(i), \mu s B(i) - \gamma i, \gamma i), \end{equation*}
where the last equality was verified in Section 1.4. Therefore, (16) in the present setting is just (3) written in integral form. As in (5), we have
 \begin{equation*} \mathbb{E}[U^N] = \mathbb{E}[\tilde{S}^N] - \mathbb{E}[\tilde{S}^N q^{\tilde{I}^N}], \qquad \mathbb{E}[U] = \mathbb{E}[\tilde{S}] - \mathbb{E}[\tilde{S} q^{\tilde{I}}], \end{equation*}
where
 $q=1-p$
. Thus,
 \begin{equation} |F^N(s,i,r) - F(s,i,r)| \leq 2\mu |\mathbb{E}[\tilde{S}^N] - \mathbb{E}[\tilde{S}]| + 2\mu \big|\mathbb{E}\big[\tilde{S}^N q^{\tilde{I}^N}\big] - \mathbb{E}\big[\tilde{S} q^{\tilde{I}}\big]\big|. \end{equation}
Consequently, to check condition 2, it suffices to show that those two terms converge to 0 as
 $N\to\infty$
uniformly on (s,i,r).
Step 3. We start with the first term of (17). Clearly, given
 $\Theta = \theta \leq N$
, we have
 $\tilde{S}^N \sim \text{hypergeom}(N,S,\theta)$
, and so
 \[ \mathbb{E}[\tilde{S}^N] = \sum_{\theta=1}^N\mathbb{E}[\tilde{S}^N\mid\Theta=\theta]\mathbb{P}[\Theta=\theta] = \sum_{\theta=1}^N \frac{S \theta}{N} \mathbb{P}[\Theta=\theta] = s \mathbb{E}[\Theta \textbf{1}\{\Theta \leq N\}], \]
and since
 $\mathbb{E}[\tilde{S}] = s \mathbb{E}[\Theta]$
, we obtain
 \begin{equation} |\mathbb{E}[\tilde{S}^N] - \mathbb{E}[\tilde{S}]| \leq \mathbb{E}[\Theta \textbf{1}\{\Theta > N\}]. \end{equation}
Step 4. We now study the second term in (17); this is the key part of the proof. Write
 $\nu^N = \mathcal{L}(W^N)$
,
 $\nu = \mathcal{L}(W)$
. Since the function
 $\phi(x,y,z) = x q^y$
is bounded, we have
 \begin{equation} \big|\mathbb{E}\big[\tilde{S}^N q^{\tilde{I}^N}\big] - \mathbb{E}\big[\tilde{S} q^{\tilde{I}}\big]\big| \leq \Vert \phi \Vert_{\infty} \Vert \nu^N - \nu \Vert_{\operatorname{TV}}, \end{equation}
where
 $\Vert \cdot \Vert_{\operatorname{TV}}$
denotes the total variation norm, defined as
 $\Vert \nu^N - \nu \Vert_{\operatorname{TV}} = 2 \inf \mathbb{P}[W^N \neq W]$
, where the infimum is taken over all couplings, that is, over all possible ways of defining
 $W^N$
and W on a common probability space, with
 $W^N \sim \nu^N$
and
 $W \sim \nu$
. We now define one particular coupling: sample
 $\Theta$
as usual, and then draw
 $\Theta$
elements from the set
 $\{1,\ldots,N\}$
with replacement; now, define
 $W = (\tilde{S}, \tilde{I}, \tilde{R})$
as
 \begin{align*} \tilde{S} & = \text{number of elements in $\{1,\ldots,S\}$}, \\ \tilde{I} & = \text{number of elements in $\{S+1,\ldots,S+I\}$}, \\ \tilde{R} & = \text{number of elements in $\{S+I+1,\ldots,N\}$}, \\ W^N & = \begin{cases} W & \text{if $\Theta\leq N$ and there were no repeated elements}, \\ \hat{W}^N & \text{if $\Theta\leq N$ and some element was repeated}, \\ (0,0,0) & \text{if $\Theta>N$}, \end{cases} \end{align*}
where
 $\hat{W}^N$
is some independent realization of
 $\nu^N$
. It is clear that
 $W^N \sim \nu^N$
and
 $W \sim \nu$
. Moreover,
 \begin{align*} \mathbb{P}[W^N = W] & = \sum_{\theta=1}^N \mathbb{P}[W^N = W \mid \Theta = \theta] \mathbb{P}[\Theta=\theta] \\ & \geq \sum_{\theta=1}^N\mathbb{P}[\text{no repeated elements}\mid\Theta=\theta]\mathbb{P}[\Theta=\theta] \\ & = \sum_{\theta=1}^N \frac{N}{N} \frac{N-1}{N} \cdots \frac{N-\theta+1}{N} \mathbb{P}[\Theta=\theta] \\ & = \mathbb{E}\bigg[\frac{N}{N} \frac{N-1}{N} \cdots \frac{N-\Theta+1}{N} \bigg], \end{align*}
thus
 \begin{equation} \frac{1}{2} \Vert \nu^N - \nu \Vert_{\operatorname{TV}} \leq 1 - \mathbb{P}[W^N = W] \leq 1 - \mathbb{E}\bigg[\frac{N}{N} \frac{N-1}{N} \cdots \frac{N-\Theta+1}{N} \bigg]. \end{equation}
Step 5. Finally, from (17)–(20), we obtain
 \begin{equation*} |F^N(s,i,r) - F(s,i,r)| \leq 2\mu \mathbb{E}[\Theta \textbf{1}\{\Theta > N\}] + 4\mu\Vert\phi\Vert_\infty \bigg\{1 - \mathbb{E}\bigg[\frac{N}{N}\frac{N-1}{N}\cdots\frac{N-\Theta+1}{N}\bigg]\bigg\}. \end{equation*}
Both terms go to 0 as
 $N\to\infty$
, the first one by monotone convergence and the second one by dominated convergence. Noting that this does not depend on (s,i,r), taking the supremum over
 $(s,i,r) \in \{0,{1}/{N},\ldots,1\}^3$
shows that
 $\lim_N \Vert F^N - F \Vert_\infty = 0$
(the norm
 $\Vert \cdot \Vert_\infty$
was defined in (15)). Thus, condition (ii) of Theorem 1 is checked and the proof is complete.
6. Conclusion and perspectives
We have introduced the non-linear system of ODEs (3), which is a novel extension to Kermack and McKendrick’s classic SIR model in epidemiology [Reference Kermack and McKendrick14]. The main novelty is that, rather than encounters between pairs of individuals, in this proposed model the infection mechanism consists of instantaneous social gatherings having a random number of attendants, where potentially many susceptible individuals can simultaneously acquire the disease from one or more infected individuals.
Some particular instances of this model yield equations already considered in the related literature. The basic reproduction number is shown to have an explicit expression, and in many examples it grows quadratically with the average size of the gatherings. This may provide a new insight on the way that some non-pharmaceutical interventions affect the spread of a disease. The qualitative behaviour of our system of ODEs is similar to the classic SIR model, although in our case the disease spreads more slowly and less in total, assuming the same reproduction number. Finally, a rigorous justification of the model is provided, by proving that the system (3) is the mean-field limit of the corresponding Markov process representing the evolution of a finite population subjected to random social gatherings and recoveries. The proofs involve slight extensions of well-established techniques from the theory of ODEs and jump Markov processes.
As mentioned in Remark 3, it is straightforward to obtain variants with social gatherings as the driving infection mechanism for other compartmental models, such as SIRS, SIRV, SEIR, models with birth and death, etc. To do so, simply use B(i), given by (4), as the force of infection. Other distributions for the duration of the infectious period, such as the Erlang distribution, can be easily included by subdividing the infectious compartment into sub-stages. A mean-field limit result analogous to Theorem 2 is expected to hold in all these cases, with a proof in the same vein as the one presented here. Also, for some of those variants (e.g. SEIR), it should be relatively straightforward to prove a comparison result similar to Lemma 2. An interesting question is whether such a comparison still holds for variants where individuals can become susceptible again after being infected (e.g. SIRS). Another possible extension, which is less straightforward, would be to include age structure in the population (e.g. infants, adults, and elderly). The corresponding model will have to consider, for each age group, a value for the probability of infection, and an additional parameter for the propensity to participate in social gatherings.
Many articles use a compartmental model together with empirical data in order to estimate the actual effect of social distancing, gathering restrictions, and other NPIs that reduce the number of contacts; see, for instance, [Reference Althouse1, Reference Cotta, Naveira-Cotta and Magal10, Reference Wangping22]. Nevertheless, it would be interesting to perform a similar study using our model (or some variant) to investigate if and how the departure from the underlying assumption of pairwise transmission provides better results.
Strong empirical evidence indicates that, for some diseases, a significant number of infections take place at relatively few but very large gatherings, such as weddings, sporting events, concerts, etc. These are known as superspreading events, and they can have a major impact on the epidemic outbreak (see, for instance, [Reference Lee17, Reference Althouse2] for COVID-19). In [Reference Kain, Childs, Becker and Mordecai13] the authors use a discrete-time stochastic compartmental model with randomized individual transmission rates, which models superspreading as short windows in time when an individual is highly infectious. On the other hand, our proposed framework provides a straightforward and explicit way of modelling superspreading events: simply consider a heavy-tailed distribution for
 $\Theta$
, the random variable of the size of the gatherings. More specifically, we can assume that
 $\mathbb{E}[\Theta^2] = \infty$
but still
 $\mathbb{E}[\Theta] < \infty$
, so that the function B(i) given by (4) is well defined; this will generate some very large gatherings which can potentially produce many new infections. Most of our analysis does not directly apply to this scenario, because we required
 $\mathbb{E}[\Theta^2] < \infty$
throughout this article. In particular, note that the basic reproduction number, given by
 $\mathcal{R}_0 = ({\mu p}/{\gamma}) \mathbb{E}[\Theta(\Theta-1)]$
, becomes infinite. The behaviour and properties of the proposed system of ODEs in (3) under this assumption, and the validity of its mean-field limit, are a challenging and interesting possible line of research.
Acknowledgement
The author thanks two anonymous referees who provided insightful comments and suggestions for improving the presentation of this article.
Funding information
This work was supported by Iniciación Fondecyt Grant 11181082.
Competing interests
There were no competing interests to declare which arose during the preparation or publication process of this article.



