1. Introduction
South Korea is experiencing its lowest-low fertility. This nation's total fertility rate, which has been at the very bottom among the developed countries in the last decade, was estimated to be at a record-breaking level (0.98) in 2018. Scholars have speculated that this drop in the fertility rate is partly attributable to the increase in women's economic power because of its substitution effect on childbirth [Kim Choe and Retherford (Reference Kim Choe and Retherford2009), Lee (Reference Lee2009), Ma (Reference Ma2013)]. According to Becker (Reference Becker and Becker1960) and Becker and Lewis (Reference Becker and Lewis1973), higher wages result in the income effect because children are a normal good, whereas the substitution effect is caused by the opportunity cost of aborting economic activities, namely, an increase in the relative price of children. However, measuring the net effect after the two effects is offset by each other is in the area of empirical analysis.
This study asks whether the higher income of a South Korean married womanFootnote 1 is negative or positive for childbirth because of its substitution effect or the greater income effect, respectively. The relation between women's economic power and childbirth is greatly affected by work–family compatibility. In societies with a well-established work–family balance system, such as Northern Europe and France, when women give birth, income and job security are guaranteed, leading to a small substitution effect and positive correlation of women's income and childbirth. In contrast, in societies with relatively traditional gender roles such as Southern Europe and Germany, in which market labor is difficult to reconcile with household labor, women's income and childbirth are likely to be negatively correlated [Köppen (Reference Köppen2006), Andersson et al. (Reference Andersson, Kreyenfeld and Mika2009)]. However, a growing body of literature has investigated the change in fertility resulting from major welfare reforms in conservative societies such as Germany and Austria [Lalaive and Zweinmuller (Reference Lalaive and Zweinmuller2009), Cygan-Rehm (Reference Cygan-Rehm2016), Olivetti and Petrongolo (Reference Olivetti and Petrongolo2017), Raute (Reference Raute2019)].
In South Korea, traditional gender role perception is stronger compared to that in Western society; however, South Korea has been strengthening its work–family balance policy since birth rates decreased sharply in the 2000s. Notably, in 2006, the government developed its first Basic Plan for Low Fertility and Aged Society (BPLA), further continued to implement policies to promote fertility. For example, paid maternity leave, childcare subsidy, and flexible work time have been quickly expanded particularly in the public sector and large businesses since the mid–2000s [Lee (Reference Lee2009), Frejka et al. (Reference Frejka, Jones and Sardon2010)]. Such policies not only reduce the lifetime income loss resulting from childbearing, but also facilitate women's return to the labor market after childbirth. These changes hamper the basic premise of the logic that the substitution effect of females' earnings overwhelms its income effect. Therefore, the relationship between income and childbirth of South Korean women may have changed in recent times.
This study estimates the effect of a woman's income level on the risk of her first and secondFootnote 2 childbirths by a Cox proportional hazards model. The data used are from the Korean Labor and Income Panel Study (1999–2016), and the subject of analysis is married women aged 20–45 years.
Results demonstrate that among working women, the higher their income, the greater the hazard of childbirth. Notably, women in the fourth income quartile have a substantially higher childbirth hazard than those of the reference group (the first income quartile). In addition, the positive impact of women's income on childbirth is significant only for the period after but not before 2006. Additional regressions using hourly wage, controlling for husband's income, and dividing the sample into multiple age groups show very consistent results. However, after we include the dummy variable for the availability of maternity leave, the coefficient of income becomes much smaller, with its standard error enlarged, whereas the explanatory power of the availability of leave is considerably high. Hence, the higher birth hazard among top income quartile women is largely attributed to their better accessibility to maternity protection benefits. In fact, even after the implementation of BPLA, the availability of maternity protection schemes is deemed to increase in women's earnings, contrary to the policy's original purpose. Although the government's efforts to promote maternity have been successful to a certain extent, the benefits of the policy remain limited mostly to high-income women. Therefore, heterogeneous policy effects among income classes in reality probably have strengthened the positive correlation between women's income and childbirth.
The remainder of the paper is structured as follows. Section 2 investigates the theoretical discussion and the literature on the relation between women's income and childbirth, and section 3 describes the data and models. Section 4 presents the result of the empirical analysis, and section 5 provides the conclusion.
2. Conceptual framework and preceding research studies
2.1 Relationship between women's income and childbirth
The hypothesis that emphasizes the substitution effect of female income on fertility presumes that the burden of childrearing is mostly allocated to women.Footnote 3 Earlier, Willis (Reference Willis1973), proposing a static economic theory of lifetime marital fertility, further reports that a wife's education is negatively related to the number of children. Butz and Ward (Reference Butz and Ward1979) claim that the mother's time is raw material for childcare services; thus, an increase in female wages hinders childbirth. Similarly, Heckman and Walker (Reference Heckman and Walker1990) suggest that a higher income for a woman delays the timing of childbirth, whereas a higher income for a man speeds up childbirth. Recently, Santarelli (Reference Santarelli2011) examines data from Italy, which, similar to South Korea, is a very low fertility country, and further finds that the employment of women greatly reduces the possibility of childbirth.
However, traditional premise is somewhat different from the recent situation. Although childbirth is biologically exclusive to women, male participation in postnatal care is expanding in the most developed countries. More importantly, there have been many developments in institutional devices that help women reconcile their work and family, such as maternity leave, childcare subsidy, and flexible work time, which may have greatly reduced the substitution effect from economic losses before and after childbirth. Under these circumstances, in the 2000s, an argument was proposed that the impact of women's income on childbirth is not negative. Andersson (Reference Andersson2000) demonstrates that fertility is pro-cyclical in Sweden. Similarly, Sobotka et al. (Reference Sobotka, Skirbekk and Philipov2011) assert that the reason for fertility being pro-cyclical is that women perceive childbearing to be a risky strategy during recession. Kornstad and Rønsen (Reference Kornstad and Rønsen2018) suggest that the possibility of childbirth decreases with income at first; however, if income exceeds a certain level, the possibility of childbirth increases in Norway (U-shaped relationship).
Notably, many studies argue that the effect of female income on childbirth depends on social systems because they determine the size of opportunity cost of childbearing. Baizan (Reference Baizan2004) argues that the employment of women in Italy, Spain, and Britain is negative for childbirth, but it is independent of fertility in Denmark. Subsequently, Andersson et al. (Reference Andersson, Kreyenfeld and Mika2009) report that in Denmark, which has a welfare state system, earning a sufficient income has become a necessary condition for women's childbearing, but in Germany, where the role of a female homemaker is emphasized, women's income and childbirth have a negative relationship. Köppen (Reference Köppen2006) investigates Germany and France that have markedly different work–family balance policies. In Germany, the positive effect of a wife's educational level on childbirth is greatly weakened when controlling her husband's educational level. In France, by contrast, women have less difficulty performing both work and childcare simultaneously compared to German women, which led to the greater income effect of education on childbirth.
In a similar context, a growing body of quasi-experimental literature has investigated the change in fertility resulting from major welfare reforms. Some of them focus on the heterogeneous effects of policy change on childbirth. For instance, in 1990, Austria increased the duration of the maternity leave from 1 year to 2 years. However, the positive effect of the reform was stronger for low-wage women than it was for high-wage women as flat rate cash transfer implies a higher earnings replacement ratio the for the lower-income group [Lalaive and Zweinmuller (Reference Lalaive and Zweinmuller2009)]. On the contrary, Germany introduced a new paid maternity leave such that its benefits continuously increase in earnings in 2007. As the reform leads to greater benefits to higher-income women, the reform's positive effect on fertility is driven by women at the upper end of the earnings distribution [Raute (Reference Raute2019)]. According to Cygan-Rehm (Reference Cygan-Rehm2016), the lowest-income mothers experience a loss in the total benefits because of a shorter entitlement period. Consequently, the new system of Germany initially leads to a postponement of childbirths, with the negative effect further persisting, particularly for the lowest income women. However, a cross-country analysis performed by Olivetti and Petrongolo (Reference Olivetti and Petrongolo2017) on 30 OECD countries reports that the effect of parental leave on fertility is quantitatively negligible.
In terms of studies conducted on South Korea, Kim Choe and Retherford (Reference Kim Choe and Retherford2009) suggest that the rapidly rising levels of women's education contributed to decline in fertility. Ma (Reference Ma2013) proposes that women's withdrawal from the labor market is a sign of family expansion. However, the study also finds that there exists the possibility of a positive relationship between earnings and fertility because the fertility rate of private sector employees appears to be sensitive to business cycles. In a later paper, Ma (Reference Ma2016) illustrates that the effects of women's educational attainment on fertility lessened when the husband's educational attainment was considered. This finding is in line with Köppen's analysis (2006) on Germany, where the husband's economic power plays an essential role in family expansion. Notably, there are multiple studies that investigate the implications of high education cost on the relationship between income and childbirth. According to Anderson and Kohler (Reference Anderson and Kohler2013), child education is extremely expensive in South Korea, such that the average couple cannot afford to raise more than one or two children. The trend of high parental investment in childhood education at present is assumed to exemplify the notion of quality over quantity. Additionally, Kim et al. (Reference Kim, Tertilt and Yum2019) propose status externalities as a new reason for South Korea's low fertility. Because parents care about the education of children relative to other parents' children, they tend to over-invest in education (quality) and under-invest in fertility (quantity). These studies may support the positive correlation of (family) income and childbirth but do not relate mothers' income with their childbearing under the government's policy change toward a more family-friendly society.
2.2 South Korea's first Basic Plan for Low Fertility and Aged Society
South Korea's work–family balance system began to strengthen in earnest in the mid-2000s. In particular, when the birth rate reached a record low in 2006, the government promulgated the first Basic Plan for Low Fertility and Aged Society (BPLA) and continued to implement policies to promote fertility [Frejka et al. (Reference Frejka, Jones and Sardon2010)]. The plan expanded subsidies for the costs of childrearing and education, day care for children, and after-school programs. Taxes and health insurance costs were lowered for families with young children. Additionally, maternity leaveFootnote 4 and childcare leaveFootnote 5 were significantly expanded. Childcare leave that had been previously applied only to parents of children under the age of 1 year was extended to those with children up to 3 years of age. Leave benefits were also substantially increased. Because those devices facilitate a stay in or return to the labor market before and after childbirth, the better the policy is applied the less lifetime income loss results from childbearing.
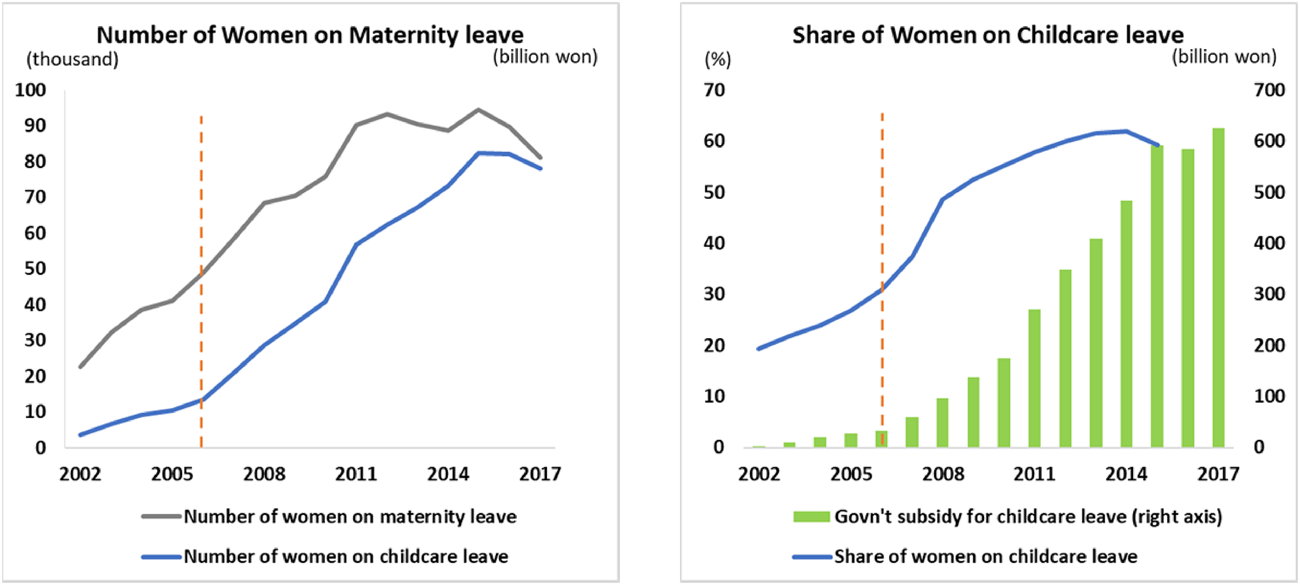
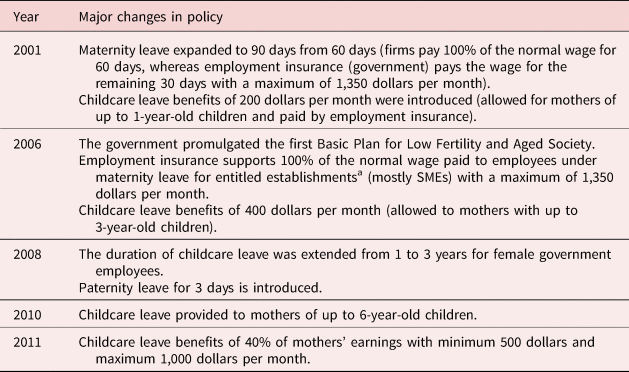
If the work–family balance system is successful in mitigating the substitution effect of women's income, then the relationship between women's economic power and childbirth would be likely to change [Feyrer et al. (Reference Feyrer, Sacerdote and Stern2008)]. Lee (Reference Lee2009) notes that the number of childbirths increased 2 years after the government set up the first BPLA in 2006. However, he argues that to conclude that the fertility rate has reached its lowest point is premature. The BPLA made 2006 a turning point in the history of South Korea's maternity protection system although the change in system was not sudden but gradual as shown in Table 1 and Figure 1. Therefore, we assume that there has been a change in the relation of women's income and their childbearing since the year 2006.
Change in the number of women on maternity leave. Source: Ministry of Employment and Labor [Korea Employment Information Service (2017)].

Development of maternity and childcare leave in South Korea

a Entitled establishments are businesses with the number of employees under 500 (manufacturing), 300 (i.e., construction, transportation, business services, and medical services), 200 (i.e., retail and wholesale, accommodation, food services, finance, and arts and sports), or 100 (other sectors). For convenience, the exchange rate between the Korean won and US dollar is set to 1,000 won = 1 dollar.
Notably, the different benefit structures of maternity protection system may lead to the policy exerting a heterogeneous impact on fertility according to women's income. For instance, maternity leave is expected to have a greater impact on high-income women than low-income women because the benefit covers the entire salary. By contrast, childcare leave with a fixed amount of benefit (before 2011) can exert a greater impact on low-income women than high-income women if both are eligible. However, childcare leave is not available for most low-income women in South Korea as presented in section 4.1. Thus, the overall impact of the policy change, which increased childcare leave benefit in 2006, would be greater for high-income women. Conversely, childcare benefit was changed from a fixed amount to a proportion of the mother's earnings in 2011. This reform would yield increased benefits for higher-income women, which is similar to Germany's introduction of a new maternity leave scheme in 2007.
3. Model and data
This section addresses the empirical model and data used to verify whether the relationship between women's income and childbirth has changed since the South Korean government established the BPLA, as explained in section 2. This study employs survival analyses based on the Cox proportional hazards model using data from the Korea Labor and Income Survey (1999–2016).
3.1 Survival analysis
In the basic form of the survival analysis model, the hazard is defined as the conditional probability that an event will occur soon after the event has not occurred. The probability that an event does not occur until a certain point in time is called survival function [S(t)], which is used to calculate the hazard function [h(t)] of the following formula:

This study uses the Cox proportional hazards model, a representative form of a semiparametric model, to analyze the hazard of childbirth. The underlying assumption of the model is as follows:

Here, h i(t) refers to the hazard of an event occurring for an individual i, and h 0(t) is a baseline hazard function that is a function of time t. S is the number of explanatory variables that affect the hazard. In this case, the individual i and the other person j have different values for the explanatory variables; furthermore, the difference can be represented as a ratio of the hazards of the two individuals:

In equation (3), h 0(t) disappears when calculating the hazard ratio; thus, estimation is possible for the influence of the explanatory variable on the hazard without any additional assumptions on the baseline hazard function. Assuming a single explanatory variable, we express individual i's likelihood as formula (4); thus, partial likelihood is measured by multiplying the likelihood value of each individual and appears as formula (5). Coefficient (β) can therefore be estimated using maximum likelihood estimation:

where δ i = 1 if event occured, δ i = 0 if censored.

where M ij = 1 if t j ≥ t i, M ij = 0 if t j < t i.
When the timing of childbirth is analyzed, it is necessary to set the starting point for women to be able to give birth [Newman and McCulloch (Reference Newman and McCulloch1984)]. Research on European or United States' cases have usually set the starting point at the age when a female can become pregnant (e.g., aged 15 years), rather than the time of marriage, because in the West, marriage and pregnancy are not necessarily related. In South Korea, however, where births outside of marriage account for only 1–2% of the total births, an appropriate starting point should be the time of marriage.Footnote 6
3.2 Data
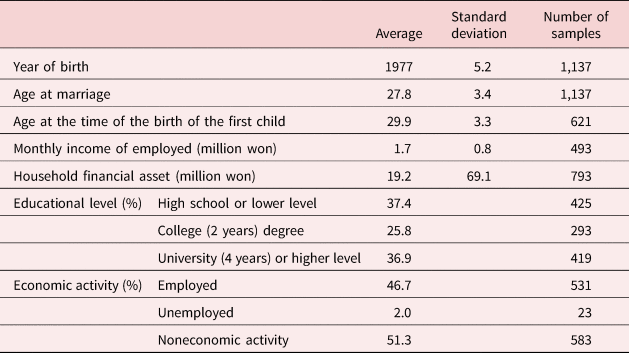
The data used to analyze the relationship between women's income and childbirth are from the KLIPS (Korea Labor and Income Panel Study) produced by the Korea Labor Institute in South Korea. A detailed database of employment and labor conditions and individual characteristics, such as the age, gender, residential area, income, and educational level, is available. In this study, data accumulated over several periods from marriage to childbirth are essential; thus, the KLIPS data are the most suitable. The samples are limited to married women aged 20 years or older and below 45 years. The Population Census conducted by the Korean Statistical Office in 2015 states that nearly 90% of South Korean women bear either one or two children. Therefore, the analysis is limited to the first and second childbirths. The basic statistics of the sample of 1,137 women to analyze their first childbirths are presented in Table 2.
Basic information of the sample of women

The average age at marriage in South Korea is much higher than that in other countries. This tendency is mainly a result of women's high levels of education, men's mandatory military services for 2 years, and increased competition for decent jobs suitable for young people. Statistics are based on the information in the year when women were surveyed for the first time, except for age at the time of the birth of the first child.
However, a caveat when using women's income as the explanatory variable is that many women are unemployed. We cannot measure the actual income of unemployed women. As a result, some studies have used predicted wages calculated by separately estimated wage equations mostly using age and education information. However, although age and education have a marked effect on income, many other critical determinants of income are missing. To clarify, in South Korea where nearly 80% of young women graduate from college or university, it is difficult to assert that all these women have the same economic power. Therefore, educational level is less helpful in predicting economic potential. Additionally, years of education are not informative in predicting one's income because it is rare to fail to graduate school in South Korea. Therefore, we use the actual income amount in the KLIPS when analyzing only employed women. However, when analyzing a more comprehensive sample including nonworking women, regression may result in bias if the income of unemployed women is set to zero or excluded. As a result, the study classifies women into six groups: noneconomic activity, unemployment,Footnote 7 and the first through fourth income quartiles,Footnote 8 and uses categorical dummies in the regression. We separate groups who are unintentionally unemployed and without economic activities because the backgrounds of both groups of women highly differ in terms of non-participation in the labor market. The term “unemployed” pertains to a person who fails to find a job despite the desire to work. By contrast, “non-economic activity” denotes a person who voluntarily does not work for lack of desire. Therefore, the study expects that the two groups will behave differently such that unemployed women are reluctant to give birth during the search for a job, whereas economically non-active women are not.
3.3 Kaplan–Meier failure function
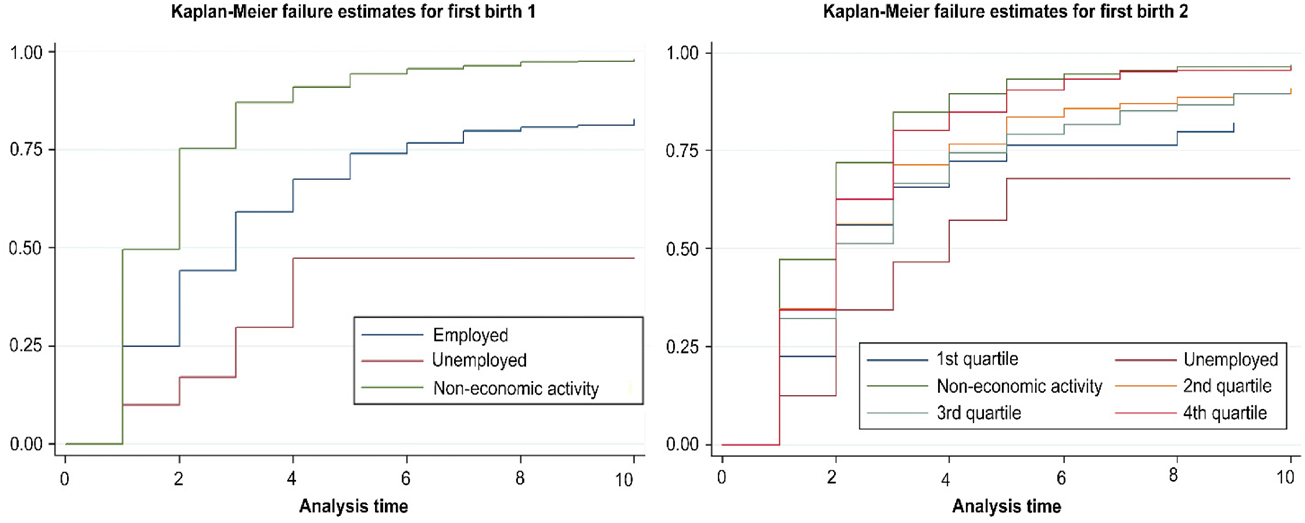
Prior to the regression analysis, we draw the hazard functions by women's employment status by using Kaplan–Meier's nonparametric estimation (Figure 2). According to the results, women's employment is better for childbirth than involuntary unemployment.Footnote 9 In the second panel of Figure 2, which divides income levels into quartiles, the lowest risk of giving birth is in the first income quartile, the risk increases in the third and second quartiles, and the highest probability of giving birth is in the highest (fourth) quartile. These findings contrast with the traditional hypothesis that employment or higher incomes have a negative impact on childbirth in South Korea.
Kaplan–Meier's nonparametric estimation.

4. Results
4.1 Woman's income and childbirth
4.1.1 A change in the relationship between women's income and childbirth
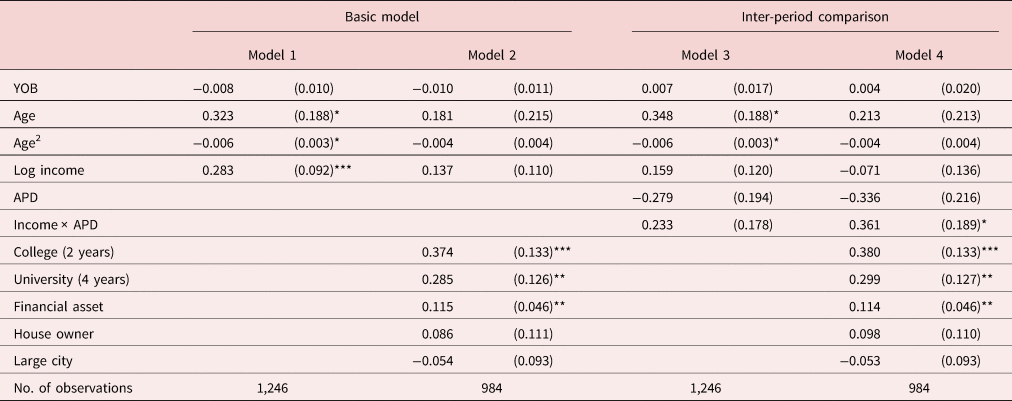
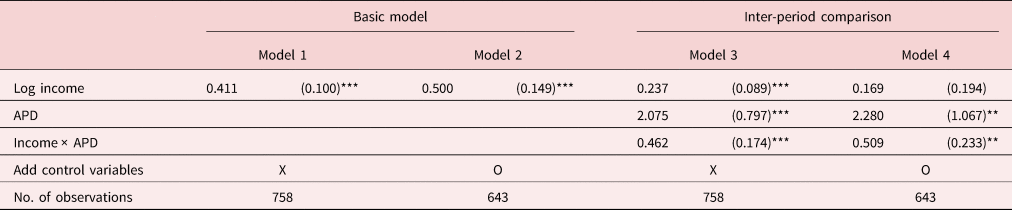
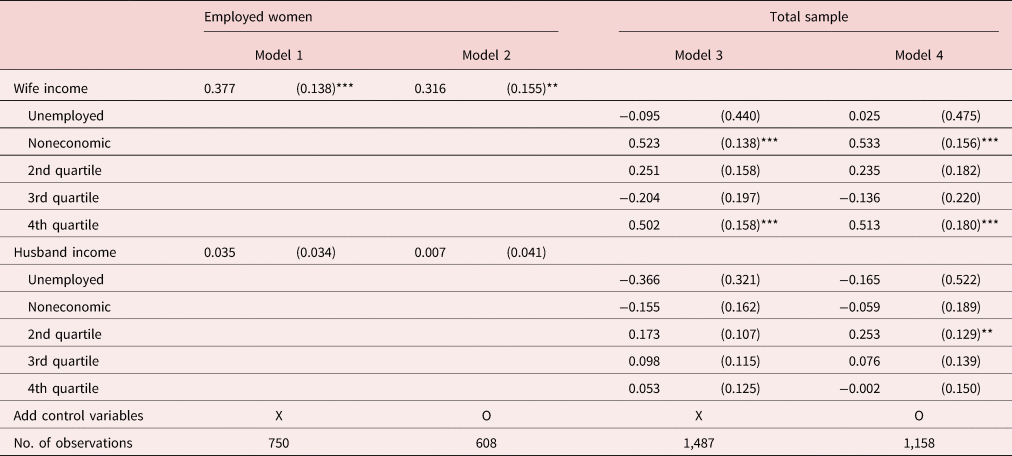
First, we use the log of their actual income amounts as an explanatory variable for the childbirth of employed women. The results demonstrate a positive coefficient for a woman's income, with its small standard error in model 1 of Table 3. In model 2, which includes educational level, financial assets, housing ownership, and a large city dummy, the coefficient estimate is reduced but remains positive. Next, to examine the recent changes in the relation between women's income and childbirth, which is the main concern of this research, we divide the entire sample period (1999–2016) into before the BPLA (1999–2006) and after the plan (2007–2016). In model 4, the coefficient for the interaction term of the APD (after the plan dummy) and woman's income is positive and statistically significant.Footnote 10 Therefore, for employed women, we propose that the income effect of an increase in female earning is greater than the substitution effect, particularly after the government has implemented its BPLA since 2007.Footnote 11
Income and childbirth (employed women, 1999–2016)

YOB stands for year of birth. Age is the age at marriage. APD stands for the after plan (BPLA) dummy that is set to 1 if the survey year is later than 2006. Income, educational level, financial asset, house owner, and large city are 1-year lagged variables.
Standard errors are enclosed in parentheses.
*p < 0.1, **p < 0.05, ***p < 0.01.
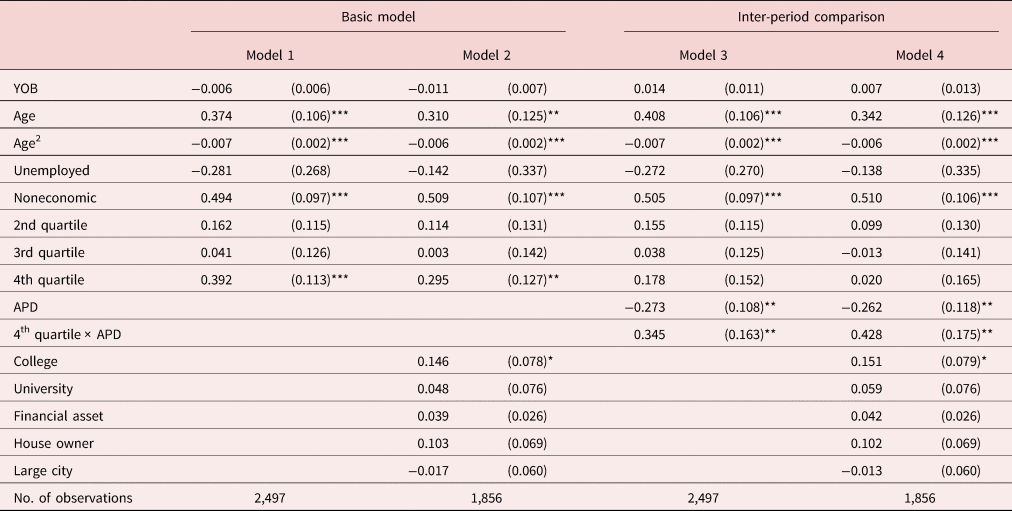
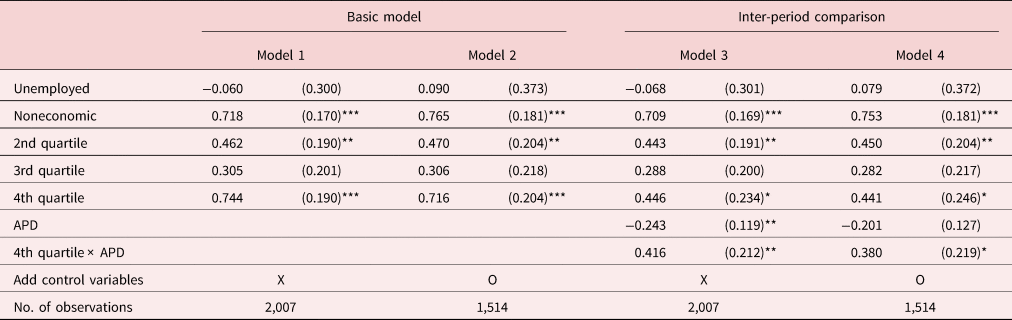
In addition, we estimate a model for the total sample, including nonworking women. Here, the income of wife is divided into quartiles, and we set the first income quartile as a reference group. Dummies for unemployment and noneconomic activity are also added. As a result (Table 4), voluntary noneconomic activity is a positive factor in bringing about childbirth, whereas involuntary unemployment delays childbearing. Among employed women, the hazard of childbirth is highest in the group of the fourth income quartile. The second and third quartiles have generally positive coefficients, but the coefficients are small and have no statistically meaningful difference from zero. Among all the categories, involuntary unemployment is the lowest childbirth hazard, followed by the first, third, and second quartiles. The fourth income quartile and voluntary noneconomic activity have the highest childbirth hazard. These results reveal that the positive relationship between income and childbirth for working women is largely attributed to the greater income effect (or maybe more precisely, the smaller substitution effect) for women of the highest income quartile. The inclusion of the interaction term of the APD and the fourth income quartile confirms that the income effect has been reinforced (or the substitution effect has been subdued) in the period after the BPLA.
Income and childbirth (total sample, 1999–2016)

YOB, year of birth; age, age at marriage; and APD, after plan (BPLA) dummy that is set to 1 if the survey year is later than 2006. Income, educational level, financial asset, house ownership, and large city are 1-year lagged variables.
Standard errors are enclosed in parentheses.
*p < 0.1, **p < 0.05, ***p < 0.01.
Regarding the other control variables, the coefficients of age at marriage and the age at marriage-squared term are estimated to be positive (+) and negative (−), respectively; thus, the first birth hazard and mother's age at marriage have a concave quadratic relationship. In other words, until the age reaches a certain point, the birth hazard increases but decreases afterward. College (2 years) graduation or university (4 years) graduation has a positive impact on childbirth hazard, compared with the reference group of high school graduation or lower level of education. Additionally, financial assets and owning a house are related positively to childbirth but with large standard errors. Living in a large city has a negative but non-significant coefficient.
Furthermore, a similar analysis was conducted on the birth of the second child.Footnote 12 The results are consistent as shown in the Appendix (Tables A-1 and A-2). It is notable that, in the second birth model, the positive coefficient for the fourth income quartile is even higher than that for noneconomic activities in the period after the BPLA.
4.1.2 Heterogeneous policy effects by income level
Previously, women's earnings and childbirth showed a significantly positive relationship, particularly after the BPLA was established. Here, we want to verify whether the positive correlation is related to heterogeneous policy effects by income level.
The substitution effect of women's high earnings on childbearing can be greatly reduced by a work–family balance policy. However, in South Korea, the availability of maternity protection schemes is deemed to increase with women's income level although the system is not originally designed to create inequality among income classes. Most high-salary jobs for women are provided by public or large companies, which are well equipped with the work–family balance system. By contrast, it seems that middle- and low-income women who work in small- and medium-sized enterprises (SMEs) cannot take full benefit from the system. For instance, the duration of childcare leave was extended from 1 to 3 years for government employees in 2008, whereas only a small portion (less than 10%) of the workers in the private sector have been granted childcare leave longer than a year. Furthermore, although large corporations and public institutions adhere to the law-enforced fully paid maternity leave and partially paid childcare leave system, SMEs often curb women's use of the leaves even illegally.Footnote 13 Many SME managers fail to recognize the maternity protection system intentionally or negligently. Thus, part-time workers and temporary workers are frequently ignorant of the system, and it is difficult for them to file a complaint to relevant authorities or a lawsuit against employers. Another possible factor is that the crackdown and punishment for the illegality is lenient for small businesses. Frequent non-compliances with the maternity protection schemes, particularly among SMEs, result in the stark gap between law and reality.
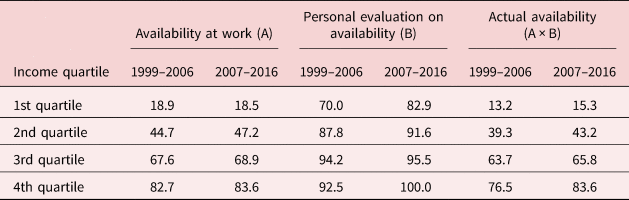
The sample data of this study (Table 5) demonstrate that the higher the income level the higher the availability of maternity leave. In the first income quartile, less than 20% of women are granted maternity leave at work, whereas in the fourth quartile, about 80% have access to the leave. Furthermore, this inequality has worsened for the period after the BPLA. The gap between the actual availabilities of maternity leave in the top and other quartiles has widened in the recent period.
Availability of maternity leave by income quartile (%)

Availability at work (A) is largely dependent on the actual compliance of employers with the law. Although the maternity leave scheme prescribed by law remains the same across company size, many SMEs are only partially compliant with the scheme. Personal evaluation on availability (B) is the share (%) of women who expected they could actually use the leave when pregnant among those whose leave is available at work, which reflects personal situations or implicit pressure from families and co-workers not to refrain from using the leave, particularly among SME workers.
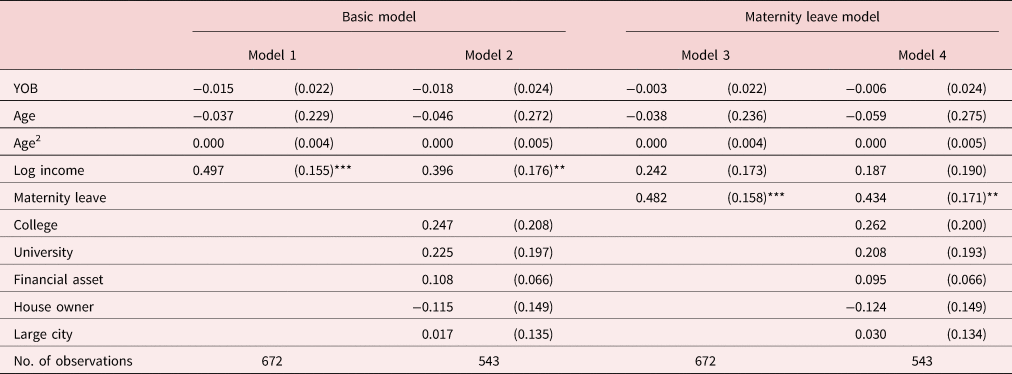
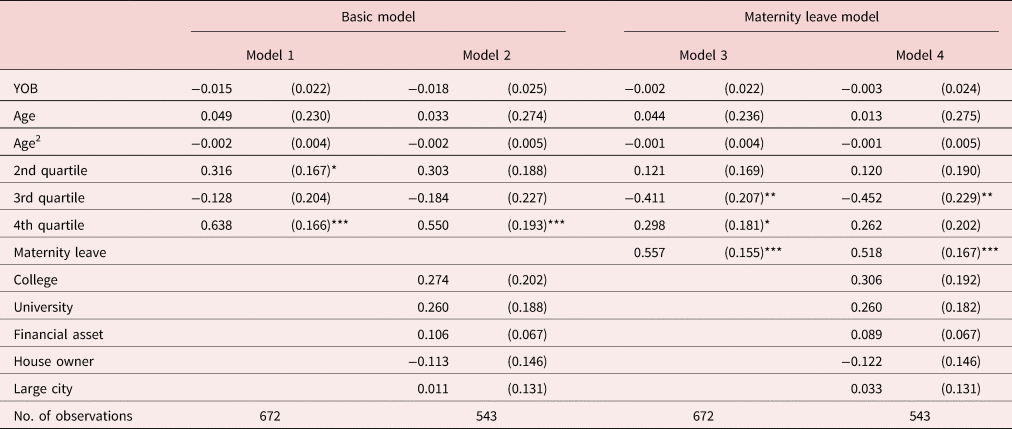
Accordingly, to verify whether the positive correlation between women's income and childbirth is attributable to the asymmetry in the work–family compatibility, we estimate a model that includes the dummy for maternity leave for the period after the BPLA (Table 6). The results reveal that after adding a maternity leave dummy, the coefficient of a woman's income decreases from 0.4–0.5 (models 1 and 2) to approximately 0.2 (models 3 and 4), and its statistical uncertainty substantially increases. Moreover, Table 7 shows that the coefficient of the fourth income quartile is around 0.3 after controlling for maternity leave (models 3 and 4), which is also much smaller than 0.6 of models 1 and 2. In contrast, the explanatory power of the work–family balance policy is considerably high. The coefficient for maternity leave is estimated to be significantly positive as presented in both Tables 6 and 7. These findings support the idea that the variance in actual policy implementation depending on income level strengthens the positive relationship between women's economic power and fertility. Analysis of the second childbirth leads to the similar results, as shown in the Appendix (Tables A-3 and A-4).
Maternity leave and childbirth (employed women, 2007–2016)

YOB, year of birth; age, age at marriage. Income, educational level, financial asset, house ownership, and large city are 1-year lagged variables.
Standard errors are enclosed in parentheses.
*p < 0.1, **p < 0.05, ***p < 0.01.
Maternity leave and childbirth (total sample, 2007–2016)

YOB, year of birth; age, age at marriage. Income, educational level, financial asset, house ownership, and large city are 1-year lagged variables.
Standard errors are enclosed in parentheses.
*p < 0.1, **p < 0.05, ***p < 0.01.
4.1.3 Non-linear relationship of women's income and childbirth
The availability of maternity leave monotonically increases by income quartile but is not exclusively available for women in the top quartile of income distribution (Table 5). Then, why is the policy effect (positive income effect) observed only in the top quartile of income? Despite the monotonic pattern in availability of the leave at work, the degree of overall work–family compatibility in real lives shows a non-linear relationship with employees' income. Table 8 illustrates the stark difference between the share of companies where childcare leave is officially usable and that of companies where the leave is actually granted to female employees. The proportions of companies where childcare leave is longer than 1 year and those where flexible work time is available are much higher in the largest company group than the others.
Work–family compatibility by company size (%)

Figures are the share of companies that answered “yes” to the statements.
Source: Work–Family Compatibility Survey 2017 (Department of Employment and Labor).
In addition, a prejudice that women with children do not work hard persists strongly in SMEs further hinders women to return to work once they take maternity or childcare leave. A survey presents that the shares of women who return to work after the leave in 2010 are 62%, 65%, and 82%, respectively, in the companies with less than 100 employees, those with more than 100 and less than 1,000, and those with more than 1,000, which is not a linear pattern [Korea Employment Information Service (2017)]. If women cannot return to work, their opportunity cost of childbearing does not effectively decrease even when maternity leave is available.
Next, high private education expenditures are a unique feature of South Korea that might be another force behind the positive correlation of income and fertility [Kim et al. (Reference Kim, Tertilt and Yum2019)]. The high cost of education has resulted in the notion that the average couple cannot afford to have children before they accumulate enough economic resources [Anderson and Kohler (Reference Anderson and Kohler2013)]. Therefore, only the women of top income quartile might be able to respond to the strengthened work–family balance policy.
Finally, it may be that only high-income women are able to outsource their household tasks, including childcare. Hazan and Zoabi (Reference Hazan and Zoabi2015) proposed the U-shaped relationship of fertility rate and women's education in the USA. They explained that highly educated women can substitute their time for market services to raise children, which further leads to high fertility.
4.2 Robustness checks on the change in impact of women's income on childbirth
4.2.1 Alternative income measure—hourly wage
In section 4.1, the monthly income of a woman is used as a measure of her opportunity cost of childbirth. However, as earned income is the product of working hours and hourly wage, it might not be clear as to whether the new pattern of women's income and fertility is driven by the positive correlation between wages and childbirth or that between working hours and childbirth. To address this issue, an alternative income measure, “hourly wage” is used in this section. Hourly wage is computed by dividing monthly income by four times the average weekly working hours. However, the sample size is reduced when compared with the monthly income model because there are missing values in working hours in the data.Footnote 14 Estimation of the hourly wage model yields consistent results. In both, the employed women sample (Table 9) and the total sample (Table 10), wage rate is significantly and positively related to childbirth hazards. Furthermore, the positive correlation is much more obvious in the period after 2006 than it is before.
Hourly wage and childbirth (employed women, 1999–2016)

APD stands for the after plan dummy that is set to 1 if the survey year is later than 2006. All models control for the year of birth, the age at marriage, and its squared value. In models 2 and 4, educational level, financial asset, house owner, and large city are added as additional control variables. The estimation results of the control variables are omitted.
Standard errors are enclosed in parentheses.
*p < 0.1, **p < 0.05, ***p < 0.01.
Hourly wage and childbirth (total sample, 1999–2016)

APD, after plan dummy that is set to 1 if the survey year is later than 2006. All models control for year of birth and age at marriage and its squared value. In models 2 and 4, educational level, financial asset, house ownership, and large city are added as additional control variables. The estimation results of the control variables are omitted.
Standard errors are enclosed in parentheses.
*p < 0.1, **p < 0.05, ***p < 0.01.
4.2.2 Age effect
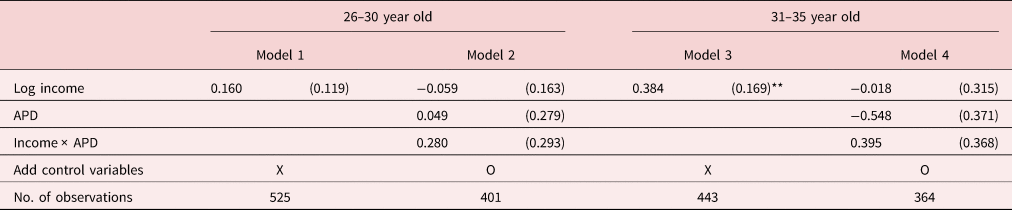
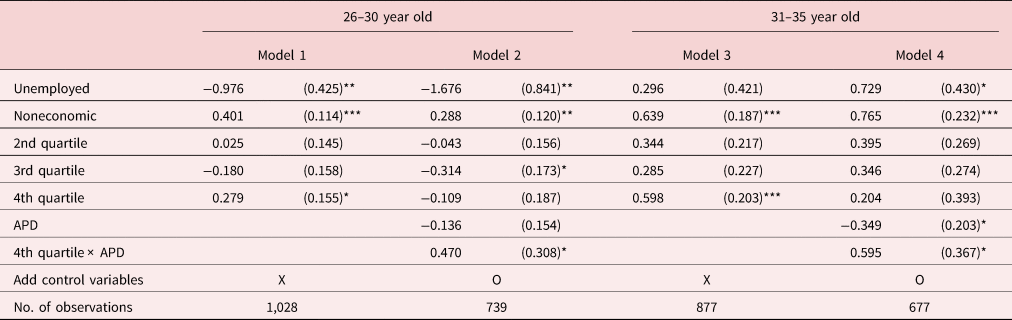
Here, we address the issue of age effect that might be another potential driver behind the positive correlation of income and childbirth. If aged women are more likely to earn higher income, further, they tend to get pregnant in a hurry before they lose physical fertility, the significant relationship between income and childbirth merely reflects the effect of age at marriage or the time squeeze effect [Kreyenfeld (Reference Kreyenfeld2002)]. However, in the sample of this study, the age differences among income quartiles are small as shown in Appendix Table A-5. Furthermore, the same model in section 4.1 is estimated by the age group. The variance of average age among income quartiles disappears when the age group is divided at 5-year intervals. Analyses on both the samples, of 26–30-year-olds and of 31–35-year-olds, result in very similar findings with previous results (Tables 11 and 12).
Income and childbirth (employed women, by age group, 1999–2016)

APD: after plan dummy that is set to 1 if the survey year is later than 2006. All models control for year of birth and age at marriage and its squared value. In models 2 and 4, educational level, financial asset, house ownership, and large city are added as additional control variables. The estimation results of the control variables are omitted.
Standard errors are enclosed in parentheses.
*p < 0.1, **p < 0.05, ***p < 0.01.
Income and childbirth (total sample, by age group, 1999–2016)

APD, after plan dummy that is set to 1 if the survey year is later than 2006. All models control for year of birth and age at marriage and its squared value. In models 2 and 4, educational level, financial asset, house ownership, and large city are added as additional control variables. The estimation results of the control variables are omitted.
Standard errors are enclosed in parentheses.
*p < 0.1, **p < 0.05, ***p < 0.01.
4.2.3 Partner effect
In this section, we investigate whether our finding is a result of the partner effect, which suggests that women with high income typically marry men with high economic power through hypergamy or positive assortative mating.Footnote 15 If the economic strength of the husband greatly affects his wife's childbearing, the positive correlation between the woman's income and childbirth could be attributable to the omitted characteristics of her partner [Kreyenfeld (Reference Kreyenfeld2002), Prskawetz and Zagaglia (Reference Prskawetz and Zagaglia2005)]. Therefore, we control a husband's income to verify whether the partner effect plays a critical role in the relation between female income and childbirth.
As shown in Table 13, the income level of a husband has a positive impact on his wife giving birth. However, the positive effect of a woman's high income on childbirth does not decline even when her husband's income is controlled for. In addition, the coefficients for a wife's income as well as the highest income quartile dummy remain statistically significant. According to these results, the positive correlation of a woman's income and her childbearing is not an illusion that results from the partner effect.
Partner effect model (including husband's income, 2007–2016)

All models control for year of birth and age at marriage and its squared value. In models 2 and 4, educational level, financial asset, house ownership, and large city are added as additional control variables. The estimation results of the control variables are omitted.
Standard errors are enclosed in parentheses.
*p < 0.1, **p < 0.05, ***p < 0.01.
5. Conclusion
The traditional hypothesis in South Korea has been that women's income relates negatively to childbirth because of its large substitution effect on fertility. However, the validity of this claim requires the premise that women are solely responsible for childcare and that reconciling work and family is impossible. However, since the mid-2000s, work–family balance policies have been strengthened in South Korea to relieve women of the burden of raising the next generation. In particular, the government established its first basic plan for low fertility in 2006 and thereafter, has further developed policy devices to promote fertility.
We estimated the effect of women's income on her first and second childbirths by a Cox proportional hazards model. The results demonstrated that among working women, the higher their income amount, the higher the probability of childbirth. Additionally, when we employed dummies that denoted economic activities and income quartiles to analyze a more comprehensive sample, the group with the highest childbirth hazard was women belonging to the fourth income quartile and non-economic activity, followed by other income quartiles. The group with the lowest hazard was the involuntary unemployed women. Notably, among all income quartiles, only the coefficient of the top income quartile was statistically significant.
When we divided the analysis period (1996–2016) into before the BPLA and after, the results indicated that the positive relationship of income and childbirth was significant only for the recent period (2007–2016). Robustness checks using an alternative income measure, namely, hourly wage, estimating the model by age group, and controlling for husband's income, lead to highly consistent results. Therefore, the negative effect of women's higher income on childbirth due to its greater opportunity cost has been subdued recently. This implies that the government's reform in 2006 to enable women to reconcile their career ambitions with the responsibility of childcare have been successful to a certain extent.
However, one problem of South Korea's maternity protection system is that the policy is not equally applied among women's income classes in reality although the policy is not designed to produce variation in its effects by income level. Although large corporations and public institutions that provide high-income jobs comply with the law-enforced maternity and childcare leave systems, SMEs frequently curb women's use of the leaves. Many SME managers complain that the maternity protection schemes cause financial and management difficulties and are unaware of the schemes intentionally or negligently.
When we added a dummy for the availability of maternity leave to the model, this addition resulted in a very high explanatory power of the leave, whereas that of women's income markedly weakened. Therefore, the high correlation between women's income and work–family compatibility might strengthen the positive relationship of their income and childbirth in South Korea. In other words, the benefits of the BPLA are limited largely to women with high-income jobs, offered generally by the public sector or large businesses. Thus, additional policy efforts are required to ensure that low-income women can also benefit from the improved work–family balance system.
A limitation of the current study is that it only analyzes first and second childbirths because nearly 90% of Korean women have either one or two children. Therefore, an investigation of the relationship between women's economic power and the final number of children would provide further insights.
Supplementary material
The supplementary material for this article can be found at https://doi.org/10.1017/dem.2021.9.
Acknowledgments
This study was supported by the Ministry of Education of the Republic of Korea and the National Research Foundation of Korea (NRF-2020S1A5B8103268).