

Kefir is a healthy and nutritious fermented milk product originating from the North Caucasus region, known for its probiotic properties. The microbiota of kefir varies depending on the production method and fermentation substrate, and it primarily consists of lactic acid bacteria (Lactobacillus spp., Lactococcus spp., Leuconostoc spp. and Streptococcus spp.), acetic acid bacteria (AAB; Acetobacter spp.) and various yeast species (Kluyveromyces, Candida, Saccharomyces, Kazachstania and Pichia spp.) (Guzel-Seydim et al., Reference Guzel-Seydim, Kok-Tas, Greene and Seydim2011; Ströher et al., Reference Ströher, Oliveira, Freitas, Salazar, da Silva, Bresciani, Flôres and Malheiros2025a and Reference Ströher, Oliveira, Freitas, Salazar, Flôres and Malheiros2025b). Traditionally, kefir is produced by inoculating milk with kefir grains. Today, industrial-scale kefir production is carried out by inoculating milk with lyophilized commercial kefir starter cultures (direct-vat-set), which contain common yeast and bacterial species naturally present in kefir grains (Sarica and Coşkun, Reference Sarica and Coşkun2020; Tratnik et al., Reference Tratnik, Bozanic, Herceg and Drgalić2006). Beyond its nutritional value, kefir has attracted attention due to its various biological activities. Studies have demonstrated its anti-inflammatory, immunomodulatory, antimicrobial, anti-proliferative, anti-mutagenic and anticancer properties (Luang-in and Deeseenthum, Reference Luang-in and Deeseenthum2016).
The type of milk and additives used in kefir production directly affect its microbiological and biochemical characteristics (Prado et al., Reference Prado, Blandón, Vandenberghe, Rodrigues, Castro, Thomaz-soccol and Soccol2015). While cow’s milk is most commonly used in commercial kefir production, alternative milk sources such as goat milk are also utilized. Goat milk has a distinct nutritional profile and higher digestibility compared to cow’s milk, owing to its content of short- and medium-chain fatty acids, proteins and minerals (M'hir et al., Reference M'hir, Ayed, De Pasquale, Fanizza, Tlais, Comparelli, Verni, Latronico, Gobbetti, Cagno and Filannino2024; Mollica et al., Reference Mollica, Trinchese, Cimmino, Penna, Cavaliere, Tudisco, Musco, Manca, Catapano, Monda, Bergamo, Banni, Infascelli, Lombardi and Crispino2021). Studies have reported that goat milk kefir generally exhibits lower viscosity and higher serum separation compared to cow milk kefir. These differences are attributed to the structural properties of goat milk, such as its lower casein content, αs-casein ratio and micelle size (Gürel et al., Reference Gürel, Ildız, Sabancı, Koca, Çağındı and Içier2021; Park et al., Reference Park, Oglesby, Hayek, Aljaloud, Gyawali and Ibrahim2019; Sarica and Coşkun, Reference Sarica and Coşkun2020; Tratnik et al., Reference Tratnik, Bozanic, Herceg and Drgalić2006).
To improve the typically low consistency and structural properties of fermented goat milk products, approaches such as increasing milk solids and adding gums have been developed (Buran et al., Reference Buran, Akal, Ozturkoglu-Budak and Yetisemiyen2021; Sarıca et al., Reference Sarıca, Filizkıran, Canbek, Ertürk, Coşkun and Mustuloğlu2021; Tratnik et al., Reference Tratnik, Bozanic, Herceg and Drgalić2006). Recent studies have shown that locust bean gum (LBG), used as a stabilizer, enhances the viscosity and stability of kefir while also supporting its prebiotic effect (Modrackova et al., Reference Modrackova, Makovska, Mekadim, Vlkova, Tejnecky, Bolechova and Bunesova2019; Park et al., Reference Park, Oglesby, Hayek, Aljaloud, Gyawali and Ibrahim2019; Sarıca et al., Reference Sarıca, Filizkıran, Canbek, Ertürk, Coşkun and Mustuloğlu2021). LBG is a polysaccharide obtained by grinding the brown, bean-like fruits of Ceratonia siliqua Linn, a leguminous (Fabaceae) shrub also known as carob, cultivated in the Mediterranean region. Since this gum does not contain starch and consists of galactose and mannose in a 1:4 ratio, it is classified as a galactomannan (Prajapati et al., Reference Prajapati, Jani, Moradiya, Randeria and Nagar2013). One study reported that the addition of locust bean galactomannans to yoghurt improved the viability of starter cultures (Streptococcus thermophilus and Lactobacillus delbrueckii subsp. bulgaricus) compared to the control group (Sadoud et al., Reference Sadoud, Ziar and Riazi2022).
The metabolic activities of microorganisms directly influence the biochemical structure of kefir. Kefir can neutralize superoxide, hydroxyl and peroxide radicals due to by-products of bacterial fermentation and exhibits antioxidant activity (AA) by inhibiting the auto-oxidation of ascorbate and linoleic acid (Bensmira and Jiang, Reference Bensmira and Jiang2012; Perna et al., Reference Perna, Simonetti and Gambacorta2019; Yilmaz-Ersan et al., Reference Yilmaz-Ersan, Ozcan, Akpinar-Bayizit and Sahin2016). Phenolic compounds, which are responsible for this AA, enhance the functional food value of kefir (Baniasadi et al., Reference Baniasadi, Azizkhani, Saris and Tooryan2022).
The concentration of biogenic amines (BAs) is considered critical for the food safety of kefir (Altay et al., Reference Altay, Karbancioglu-Güler, Daskaya-Dikmen and Heperkan2013; Linares et al., Reference Linares, Del Río, Ladero, Martínez, Fernández, Martín and Álvarez2012). BAs are nitrogenous organic compounds of low molecular weight, primarily formed by the microbial decarboxylation of amino acids during fermentation and storage. In fermented foods and beverages, their occurrence is associated with decarboxylase-positive microorganisms and endogenous enzymatic activity (Gardini et al., Reference Gardini, Özogul, Suzzi, Tabanelli and Özogul2016). Common BAs include aliphatic (putrescine [PUT], cadaverine [CAD]), aromatic (tyramine [TyR], phenylethylamine [PhA]) and heterocyclic (histamine [HIS], tryptamine [TRP]) amines, as well as polyamines like spermine (SPM) and spermidine (SPD; Kurt and Zorba, Reference Kurt and Zorba2009; Roselino et al., Reference Roselino, Maciel, Sirocchi, Caviglia, Sagratini, Vittori, Taranto and Cavallini2020). These compounds are of particular interest due to their potential toxicological effects, including hypertensive crises, headaches and interactions with monoamine oxidase inhibitors (Shalaby, Reference Shalaby1997).
In kefir and similar dairy products, BA formation is influenced by the composition and metabolic activity of the fermentative microbiota-primarily Lactobacillus, Enterococcus, Lactococcus and various yeasts (Altay et al., Reference Altay, Karbancioglu-Güler, Daskaya-Dikmen and Heperkan2013; Linares et al., Reference Linares, Del Río, Ladero, Martínez, Fernández, Martín and Álvarez2012). Additional factors such as bacterial density, proteolysis, pH, additives, maturation and storage conditions further affect BA accumulation (Doeun et al., Reference Doeun, Davaatseren and Chung2017; Valsamaki et al., Reference Valsamaki, Michaelidou and Polychroniadou2000). Therefore, monitoring BA levels in kefir is essential for assessing both the microbial quality and consumer safety of the final product.
The AA of fermented dairy products, especially kefir, has attracted considerable research interest in recent years (Stobiecka et al., Reference Stobiecka, Król and Brodziak2022; Saadi et al., Reference Saadi, Zaidi, Oomah, Haros, Yebra and Hosseinian2017; Yilmaz-Ersan et al., Reference Yilmaz-Ersan, Ozcan, Akpinar-Bayizit and Sahin2016). It is known that fermented dairy products such as kefir have antioxidant capacity and are able to scavenge radicals, such as superoxide radicals, hydroxyl radicals and peroxide radicals, and inhibit ascorbate and linoleic acid autoxidation (Perna et al., Reference Perna, Simonetti and Gambacorta2019; Yilmaz-Ersan et al., Reference Yilmaz-Ersan, Ozcan, Akpinar-Bayizit and Sahin2016). Studies have shown that kefir’s functional qualities have been enhanced with some additions, and its AA and phenolic content have been determined (Atalar, Reference Atalar2019; Perna et al., Reference Perna, Simonetti and Gambacorta2019; Saadi et al., Reference Saadi, Zaidi, Oomah, Haros, Yebra and Hosseinian2017; Stobiecka et al., Reference Stobiecka, Król and Brodziak2022). The phenolic composition of milk is influenced by various factors, including pasture intake, dietary composition and grazing period (Perna et al., Reference Perna, Simonetti and Gambacorta2019; Rocchetti et al., Reference Rocchetti, Ghilardelli, Mosconi, Masoero and Gallo2022; Satir and Guzel-Seydim, Reference Satir and Guzel-Seydim2015).
This study investigates the effects of adding LBG on prebiotic activity, proteolytic activity, antimicrobial activity, total phenolic content (TPC), AA and BA formation in kefir.
Materials and methods
Materials
The whole raw goat milk used for kefir production was purchased from a local farmer in Bolu, Türkiye. The milk was obtained by mechanical milking, immediately cooled to approximately 4°C at the farm, transported to the laboratory under refrigerated conditions in insulated containers, and pasteurized within approximately 2 h of milking. Kefir starter culture, which consisted of Lactococcus spp., Leuconostoc spp., Streptococcus thermophilus, Lactobacillus spp., kefir yeast and kefir grain microbiota according to the product information, was obtained from Danisco Biolacta (Kefir DC1, Olsztyn, Poland). LBG was obtained from a company called Kimbiotek (Türkiye). Sterilized bottles (1 L) made of high-density polyethylene material were used for the preservation of the kefir samples.
Kefir manufacture
The milk was transported to the research and development laboratory of the Department of Food Engineering, Bolu Abant Izzet Baysal University. The milk was filtered through cloth and a steel strainer while it was transferred to a batch type of pasteurizer. After pasteurizing the milk at 85°C for 10 min, it was cooled to 25°C. Kefir starter culture was added to the pasteurized milk (13.30% w/w total solids, 4.23% w/w fat, 3.85% w/w protein, 0.75% w/w ash, 0.17 % w/w acidity and pH 6.67) at a level of 0.02 g/L, and the milk was incubated at 25°C until the pH reached 4.60. After incubation, the kefir produced (13.91% w/w total solids, 4.37% w/w fat, 4.15% w/w protein, 0.83% w/w ash, 1.03 % w/w acidity and pH 4.45) was divided into four separate groups.
LBG solutions were prepared at three different concentrations so that the ratio of LBG in the experimental kefir samples was 0.05%, 0.1% and 0.2%. Therefore, 3, 6 and 12 g of LBG were weighed separately, and 480 mL of water was added to them. These mixtures were homogenized with an Ultra-Turrax (15,000 rpm) and pasteurized at 85°C for 10 min to become fully solubilized. In the kefir samples supplemented with LBG, 80 mL of the gum solutions were added to the kefir (920 mL) and mixed with a sterile glass stirring rod to provide homogenization. The samples were coded as K0.05, K0.1 and K0.2 according to their LBG ratio. In the control group, 80 mL of drinkable water pasteurized at 85°C for 10 min was added to the kefir. All samples were kept in the refrigerator for 28 days.
Enumeration of microorganisms
The kefir samples were dispersed, and further dilutions were made in Ringer’s solution. The lactobacilli and lactococci counts were enumerated according to Irigoyen et al. (Reference Irigoyen, Arana, Castiella, Torre and Ibáñez2005), using MRS (deMan, Rogosa, and Sharpe) and M17 media, respectively. The Leuconostoc spp. counts were determined on MSE (Mayeux, Sandine & Elliker) agar (García Fontán et al., Reference García Fontán, Martínez, Franco and Carballo2006). The total mesophilic aerobic bacteria (TMAB) counts were determined on plate count agar (Mainville et al., Reference Mainville, Montpetit, Durand and Farnworth2001). The AAB and yeast counts were enumerated according to Witthuhn et al. (Reference Witthuhn, Schoeman, Cilliers and Britz2005), using APM (Acetobacter peroxydans Medium) and YGC (Yeast Extract Glucose Chloramphenicol) agar, respectively.
Determination of antimicrobial activity of kefir
The antimicrobial properties of the kefir samples were determined using the well diffusion method (Chung et al., Reference Chung, Thomasson and Wu-Yuan1990). The microorganisms used in the study (Escherichia coli O157:H7, Salmonella Typhimurium, Listeria monocytogenes, Staphylococcus aureus and Bacillus cereus) were obtained from the Food Engineering Department’s Food Microbiology Laboratory Culture Collection at Bolu Abant Izzet Baysal University.
According to the method, the microorganisms were cultured in Tryptic Soy (TS) broth medium at 37°C and spread in 100 µL of active cultures for 18–24 h on TS agar. Then, 100 µL of the kefir samples were transferred to 6 mm wells. Petri dishes were incubated for 16–18 h at 37°C to promote the growth of bacteria. At the end of this period, inhibition zones around the wells were measured.
Determination of BA concentrations
The extraction, dansylation, identification and quantification of BAs by HPLC were performed according to the method of Eerola et al. (Reference Eerola, Hinkkanen, Lindfors and Hirvi1993). The chromatographic separations of TRP, 2-PhA, PUT, CAD, HIS, TyR, SPD and SPM were performed in a gradient system (0.1 M ammonium acetate/acetonitrile) at 254 nm wavelength using a photodiode array detector and a C18 (Aqueous; 5 μm, 250 × 4.6 mm i.d.; PerkinElmer, USA) column in the HPLC (Flexar, PerkinElmer, USA) device. The concentrations of BA compounds were calculated as mg/kg kefir.
Determination of proteolytic activity
Proteolytic activity in kefir samples was determined according to Hull (Reference Hull1947) and expressed as tyrosine equivalents. Briefly, 1 g of each sample was precipitated with trichloroacetic acid, and the filtrate was reacted with sodium carbonate and Folin–Ciocalteu reagent. After colour development, the absorbance was measured at 650 nm, and the tyrosine content was expressed as mg tyrosine per g of sample.
Total phenolic content
The extraction method described by Yilmaz-Ersan et al. (Reference Yilmaz-Ersan, Ozcan, Akpinar-Bayizit and Sahin2016) was used. Firstly, 25 mL of extraction solution (methanol: water, 70:30) was added to the 5 g kefir sample. The mixture was stirred at room temperature for 4 h in the dark using a magnetic stirrer. The mixture was then centrifuged (4,000 rpm; 10 min) (Hettich Rotofix 32A, Germany) and the supernatant was filtered through sheets of filter paper. The filtered mixture was transferred into a volumetric flask and brought to 25 mL volume with extraction solution and stored at −20°C until analyses.
The TPC, using Folin–Ciocalteu reagent, was analysed according to the modified method proposed by Shahidi et al. (Reference Shahidi, Chavan and Amarowicz2001). The absorbance of the solution was measured at 720 nm using a UV-1800 spectrophotometer (Shimadzu Corp., Kyoto, Japan). The results were assessed based on plots of the gallic acid calibration curve (linearity range: R 2 = 0.9987) and they were represented in terms of gallic acid equivalents (GAE) mg/100 g of sample.
Antioxidant activity
AA was estimated using the 6-hydroxy-2,5,7,8-tetramethylchroman-2-carboxylic acid (Trolox) equivalent antioxidant capacity method and a UV/VIS spectrophotometer (Re et al., Reference Re, Pellegrini, Proteggente, Pannala, Yang and Rice-evans1999). The sample extract was added to 1 mL of diluted 2,2′-azino-bis (3-ethylbenzothiazoline-6-sulfonic acid) diammonium salt radical cation (ABTS*+) solution; the mixture was mixed, and the absorbance was measured. The absence of ABTS*+ was determined at 734 nm for 6 min by measuring the decrease in absorbance. Trolox was used as a standard compound, and the results were reported as micromolar Trolox equivalent AA (μM TE/100 g).
Statistical analysis
All experimental kefir samples were produced and stored in two independent biological batches, and all analytical determinations were performed in duplicate for each batch. Technical replicate values were averaged prior to statistical analysis, and results are presented as mean ± standard deviation (SD). The effects of treatment (LBG concentration), storage time (1, 14 and 28 days) and their interaction were analysed using linear mixed-effects models fitted by restricted maximum likelihood. Treatment, storage time and their interaction were included as fixed effects, whereas biological batch was included as a random effect to account for variability between independent production batches. Estimated marginal means were used for statistical inference, and pairwise comparisons were performed using the least significant difference procedure where appropriate. Statistical analyses were performed using IBM SPSS Statistics version 20.0 (IBM Corp., Armonk, NY, USA), and statistical significance was established at P < 0.05.
Results and discussion
Microbial profile
Table 1 summarizes the fixed effects of LBG supplementation, storage time and their interaction on the microbial populations of goat milk kefir, whereas the estimated marginal means for each treatment × storage time combination are presented in Table S1. According to the linear mixed model, storage time was the predominant factor affecting microbial populations, significantly influencing all microbial groups examined (P < 0.001). In contrast, the effect of LBG supplementation depended on the microorganism evaluated. Treatment significantly affected lactococci (P < 0.001), AAB (P < 0.05) and yeast counts (P < 0.001), whereas no significant effects were observed for lactobacilli, TMAB or Leuconostoc spp. (P > 0.05). A significant treatment × storage time interaction was detected only for lactococci and yeasts (P < 0.001), indicating that the influence of LBG supplementation on these microorganisms varied throughout storage.
Effects of sample, storage time and their interaction on microbiological properties of goat kefir supplemented with locust bean gum

Table 1 Long description
Microbial counts are reported as mean plus or minus standard deviation for Lactobacilli, Lactococci, TMAB, AAB, Leuconostoc, and Yeast, grouped by Treatment, Storage time in days, and linear mixed model effects. For Treatment, Control shows Lactobacilli 7.26, Lactococci 8.54, TMAB 8.96, AAB 7.14, Leuconostoc 7.23, and Yeast 3.95. Treatment 0.05 percent shows 7.02, 8.23, 8.96, 6.95, 6.94, and 3.89; treatment 0.1 percent shows 7.07, 8.29, 9.00, 6.98, 6.93, and 3.87; treatment 0.2 percent shows 7.12, 8.28, 8.93, 7.06, 7.16, and 3.48. For Storage time, day 1 shows Lactobacilli 9.11, Lactococci 9.27, TMAB 9.56, AAB 9.00, Leuconostoc 8.91, and Yeast 2.67. Day 14 shows 6.16, 7.83, 8.67, 6.03, 6.20, and 3.40; day 28 shows 6.09, 7.90, 8.65, 6.07, 6.09, and 5.32. In the linear mixed model section, Treatment is marked ns for Lactobacilli, TMAB, and Leuconostoc, one star for AAB, and three stars for Lactococci and Yeast. Storage time is marked three stars for all six microbial groups. The interaction of Treatment by Storage time is marked ns for Lactobacilli, TMAB, AAB, and Leuconostoc, three stars for Lactococci, and two stars for Yeast.
Notes: TMAB, total mesophilic aerobic bacteria; AAB, acetic acid bacteria.
Values are presented as mean ± SD. Different lowercase and uppercase letters within columns indicate significant differences among treatments and storage times, respectively, based on pairwise comparisons from the linear mixed model (P < 0.05).
ns, P ≥ 0.05; *P < 0.05; **P < 0.01; ***P < 0.001.
The highest count of lactobacilli was observed in the control on day 1 (Table S1). The lactobacilli count in all samples decreased significantly by the 14th day of storage. In the control sample, there was an almost 3.33 log reduction in lactobacilli counts when compared to the initial population of 9.41 log CFU/g (day 1) with 6.08 log CFU/g (day 28). Similar reductions in bacterial counts were observed in the samples fortified with LBG at the end of the storage period (Table S1). Previous reports (Irigoyen et al., Reference Irigoyen, Arana, Castiella, Torre and Ibáñez2005; Grønnevik et al., Reference Grønnevik, Falstad and Narvhus2011; Meral-Aktaş et al., Reference Meral-Aktaş, Ürkek, Aktaş, Baltacı, Çetin and Şengül2025; Sarica and Coşkun, Reference Sarica and Coşkun2020) demonstrated that the lactobacilli level of kefir decreased roughly 2–3 log units during storage.
The lactococci count of the control samples was higher than those of the samples fortified with LBG both on the first day and on the last day of storage (Table S1). The highest lactococci level was observed in the control on day 1, while the lowest was obtained from the K0.05 sample on day 14. However, the most pronounced decrease occurred between days 1 and 14 in the control (1.7 log CFU/g). This decline is in line with the findings of Irigoyen et al. (Reference Irigoyen, Arana, Castiella, Torre and Ibáñez2005), who reported a 2-log unit reduction, but exceeds the lower reductions (<1.25 log units) described by Temiz and Kezer (Reference Temiz and Kezer2015).
Initial TMAB levels ranged from 9.46–9.63 log CFU/g and decreased to 8.55–8.67 log CFU/g after 28 days of storage (Table S1). Reductions were generally below 1 log unit, except in K0.2, where a 1.07 log decrease was observed. These results are consistent with previous findings reported by Sarica and Coşkun (Reference Sarica and Coşkun2020).
AAB counts decreased from 9.08 log CFU/g on day 1 to 6.12 log CFU/g on day 28 in the control (Table S1). In the LBG-fortified samples, AAB counts decreased from 8.86–9.09 log CFU/g to 6.00–6.14 log CFU/g on day 28. Similar reductions in AAB counts were observed in all samples during storage. The number of AAB after 28-day storage in the present study was very similar to previous reports (Sarica and Coşkun, Reference Sarica and Coşkun2020; Ströher et al., Reference Ströher, Oliveira, Freitas, Salazar, Flôres and Malheiros2025b).
The change in Leuconostoc spp. population was similar to that of AAB during the storage period. As shown in Table S1, there were almost 2.6–2.9 log unit reductions in Leuconostoc spp. population both in the control sample and the LBG-fortified samples. These findings were higher than other findings (Grønnevik et al., Reference Grønnevik, Falstad and Narvhus2011; Gul et al., Reference Gul, Mortas, Atalar, Dervisoglu and Kahyaoglu2015; Sarica and Coşkun, Reference Sarica and Coşkun2020).
In contrast to bacteria, yeast counts increased continuously throughout storage. As shown in Table S1, the lowest and highest yeast levels were determined in the control on days 1 and 28, respectively. The increase in yeast counts during storage tended to decrease with increasing LBG concentration. Among the samples fortified with LBG during storage, the highest increase in yeast count was in the sample K0.05 with 3.06 log units, while the lowest increase was in the sample K0.2 with 1.61 log units. The yeast number in the present study was very similar to previous reports (Grønnevik et al., Reference Grønnevik, Falstad and Narvhus2011; Gul et al., Reference Gul, Mortas, Atalar, Dervisoglu and Kahyaoglu2015), and Grønnevik et al. (Reference Grønnevik, Falstad and Narvhus2011) also showed a steady increase in yeast viability during the storage period.
Antimicrobial activity
It is known that kefir cultures contain various lactic acid bacteria and yeast species and that kefir has an antimicrobial effect resulting from some metabolites produced by these microorganisms (Rosa et al., Reference Rosa, Dias, Grześkowiak, Reis, Conceição and Peluzio2017; Taşkın, Reference Taşkın2020; Zanirati et al., Reference Zanirati, Abatemarco, Sandes, Nicoli, Nunes and Neumann2015). The antibacterial effect is associated with the presence of metabolites such as lactic acid, acetic acid, hydrogen peroxide, diacetyl and bacteriocins (Biadała et al., Reference Biadała, Szablewski, Lasik-Kurdyś and Cegielska-Radziejewska2020).
In our study, the antimicrobial activities of kefir samples after 1, 14 and 28 days were determined using the well diffusion method, and the inhibition diameters of kefirs against pathogenic bacteria were measured (results not shown). Based on the obtained zone diameters, kefir samples showed antibacterial activity against L. monocytogenes and B. cereus after 1 day and against S. Typhimurium after 14 days. The addition of different amounts of LBG did not make any difference to the antibacterial activity of the samples. Erdoğmuş and Bostancı (Reference Erdoğmuş and Bostancı2019) reported that lactic acid bacteria isolated from kefir samples were effective against L. monocytogenes, similar to our study, but showed low antimicrobial activity against E. coli. Kim et al. (Reference Kim, Jeong, Kim, Kang, Chon, Song and Seo2016) examined the antimicrobial activity of four different kefir samples against some food pathogens by fermenting them for 24, 36, 48 and 72 h. The study found that the kefirs reached their strongest and broadest range of activity after 36–48 h. The researchers found that the kefir samples had high antimicrobial activity against B. cereus. Azizkhani et al. (Reference Azizkhani, Saris and Baniasadi2021) found that kefirs produced from different milks had varying antibacterial activity. The study found that kefir samples (cow, camel, ewe and goat milk) exhibited high antibacterial activity against S. aureus, E. coli, S. enterica and L. monocytogenes. Staphylococcus aureus and L. monocytogenes were found to be the most susceptible bacteria to kefir, while E. coli was the most resistant. Hew et al. (Reference Hew, Shafie and Sulaiman2023) also stated that the antibacterial effects of kefirs produced with cow’s milk and almond milk are different, and that the highest antibacterial effect (for E. coli, S. aureus and S. Typhimurium) was in kefir produced by mixing cow’s milk and almond milk at a 1:1 ratio.
On the 28th day of fermentation, no antibacterial activity was detected against any of the pathogens used in the study. This may be due to the decreasing concentration of lactic acid bacteria responsible for antimicrobial activity over time. As the number of these microorganisms decreases, the production of antibacterial metabolites also decreases. The evaporation of organic acids or their transformation into other compounds, such as ethyl alcohol, over time, as well as the denaturation of some substances, such as protein-based bacteriocins, may also contribute to the loss of antibacterial activity (Azizkhani et al., Reference Azizkhani, Saris and Baniasadi2021).
Biogenic amines
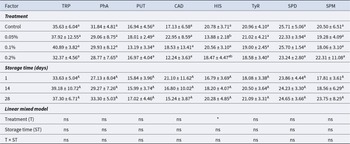
Table 2 summarizes the fixed effects of LBG supplementation, storage time and their interaction on the BA contents of goat milk kefir, whereas the estimated marginal means for each treatment × storage time combination are presented in Table S2. According to the linear mixed model, the effect of LBG supplementation depended on the BAs evaluated. Treatment significantly affected HIS (P < 0.05), whereas no significant effects were observed for TyR and the other BAs (P > 0.05). Neither storage time nor the treatment × storage time interaction significantly affected any of the BAs evaluated (P > 0.05). Across all treatments and storage times, individual BA concentrations ranged from 9.72 ± 0.43 to 50.08 ± 16.89 mg/kg (Table S2). Among the BAs, HIS and TyR are considered most critical due to their toxicological relevance.
HIS was the only BA significantly affected by LBG supplementation (Table 2). The overall mean HIS concentration across all storage time points was highest in the control sample (20.78 ± 3.71 mg/kg) and lowest in the 0.05% LBG sample (13.88 ± 2.18 mg/kg). The 0.2% LBG sample showed an intermediate value (18.47 ± 4.47 mg/kg), whereas the 0.1% LBG sample (20.56 ± 3.10 mg/kg) was comparable to the control. As shown in Table S2, the highest HIS concentration (25.29 ± 2.72 mg/kg) was observed in the control sample at the end of storage, remaining below the no-observed-adverse-effect level (NOAEL) of 50 mg reported by Comas-basté et al. (Reference Comas-basté, Sánchez-Pérez, Veciana-Nogués, Latorre-Moratalla and Vidal-carou2020).
Effects of sample, storage time and their interaction on biogenic accumulation of goat kefir supplemented with locust bean gum

Table 2 Long description
Biogenic amine values are reported as mean plus or minus standard deviation for eight measures: TRP, PhA, PUT, CAD, HIS, TyR, SPD, and SPM, grouped by treatment and by storage time in days. Treatments listed are control, 0.05%, 0.1%, and 0.2%. For treatment means, TRP is 35.63 plus or minus 6.04 for control, 37.92 plus or minus 12.55 for 0.05%, 40.89 plus or minus 3.82 for 0.1%, and 32.37 plus or minus 4.56 for 0.2%. For treatment means, HIS is 20.78 plus or minus 3.71 for control, 13.88 plus or minus 2.18 for 0.05%, 20.56 plus or minus 3.10 for 0.1%, and 18.47 plus or minus 4.47 for 0.2%, with letter markers a, b, and ab shown next to the standard deviations. Storage times listed are 1, 14, and 28 days, with TRP at 33.63 plus or minus 5.04 on day 1, 39.18 plus or minus 10.72 on day 14, and 37.30 plus or minus 6.71 on day 28. For day means, SPM is 17.81 plus or minus 3.61 on day 1, 18.56 plus or minus 6.29 on day 14, and 23.75 plus or minus 8.25 on day 28. The linear mixed model section lists treatment as ns for TRP, PhA, PUT, CAD, TyR, SPD, and SPM, and marked with an asterisk for HIS; storage time is ns for all eight measures, and the treatment by storage time interaction is ns for all eight measures.
Notes: TRP, tryptamine; PhA, 2-phenylethylamine; PUT, putrescine; CAD, cadaverine; HIS, histamine; TyR, tyramine; SPD, spermidine; SPM, spermine.
Values are presented as mean ± SD. Different lowercase and uppercase letters within columns indicate significant differences among treatments and storage times, respectively, based on pairwise comparisons from the linear mixed model (P < 0.05).
ns, P ≥ 0.05; *P < 0.05; **P < 0.01; ***P < 0.001.
Among the remaining BAs (TRP, PhA, PUT, CAD, TyR, SPD and SPM), numerical fluctuations were observed throughout storage (Table S2), but none of these changes was statistically significant according to the linear mixed model. TRP values ranged from 28.95 to 50.08 mg/kg, PhA from 23.29 to 37.84 mg/kg, PUT from 11.11 to 20.15 mg/kg, CAD from 9.72 to 30.83 mg/kg, TyR from 14.68 to 23.83 mg/kg, SPD from 17.92 to 27.29 mg/kg and SPM from 15.11 to 35.15 mg/kg. TyR values remained well below the reported toxic range of 100–800 mg/kg (Hernández-Jover et al., Reference Hernández-Jover, Izquierdo-Pulido, Veciana-Nogués, Mariné-Font and Vidal-Carou1997). These findings indicate that storage for 28 days did not result in a statistically significant accumulation of BAs under the conditions of the present study.
Moreover, the individual BA values and the overall levels observed in this study were well below the suggested maximum total BA level of 750–900 mg/kg for fermented foods and beverages (Ladero et al., Reference Ladero, Calles-Enriquez, Fernandez and Alvarez2010). Therefore, all kefir samples can be considered safe in terms of BA accumulation under the storage conditions applied.
Proteolytic activity
Table 3 summarizes the fixed effects of LBG supplementation, storage time and their interaction on the proteolytic activity of goat milk kefir, whereas the estimated marginal means for each treatment × storage time combination are presented in Table S3. According to the linear mixed model, treatment (P < 0.001), storage time (P < 0.001) and the treatment × storage time interaction (P < 0.01) significantly affected tyrosine content. Across all treatments and storage times, tyrosine content ranged from 0.082 to 0.121 mg tyrosine/g.
Significance of sample, storage time and their interaction on proteolytic activity, total phenolic content and antioxidant activity of goat kefir supplemented with locust bean gum

Table 3 Long description
Factors listed are treatment, storage time in days, and linear mixed model results for tyrosine, total phenolic content labeled TPC, and antioxidant activity labeled AA, with values shown as mean plus or minus standard deviation. For treatment, tyrosine is 0.104 plus or minus 0.016 with letter b for control, 0.114 plus or minus 0.008 with letter a for 0.05 percent, 0.110 plus or minus 0.012 with letter a for 0.1 percent, and 0.109 plus or minus 0.013 with letter a for 0.2 percent. For treatment, TPC is 7.40 plus or minus 1.26 with letter a for control, 7.26 plus or minus 1.14 with letter a for 0.05 percent, 7.23 plus or minus 1.35 with letter a for 0.1 percent, and 7.37 plus or minus 1.43 with letter a for 0.2 percent. For treatment, AA is 0.81 plus or minus 0.25 with letter a for control, 0.94 plus or minus 0.24 with letter a for 0.05 percent, 0.86 plus or minus 0.28 with letter a for 0.1 percent, and 0.88 plus or minus 0.26 with letter a for 0.2 percent. For storage time, tyrosine is 0.095 plus or minus 0.011 with letter C at day 1, 0.111 plus or minus 0.005 with letter B at day 14, and 0.120 plus or minus 0.005 with letter A at day 28. For storage time, TPC is 6.48 plus or minus 1.35 with letter B at day 1, 7.82 plus or minus 0.91 with letter A at day 14, and 7.96 plus or minus 0.69 with letter A at day 28. For storage time, AA is 0.80 plus or minus 0.22 with letter A at day 1, 0.89 plus or minus 0.21 with letter A at day 14, and 0.91 plus or minus 0.32 with letter A at day 28. In the linear mixed model section, treatment is marked with three asterisks for tyrosine and ns for TPC and AA, storage time is marked with three asterisks for tyrosine, two asterisks for TPC, and ns for AA, and the interaction of treatment and storage time is marked with two asterisks for tyrosine and ns for TPC and AA.
Notes: TPC, total phenolic content; AA, antioxidant activity.
Values are presented as mean ± SD. Different lowercase and uppercase letters within columns indicate significant differences among treatments and storage times, respectively, based on pairwise comparisons from the linear mixed model (P < 0.05).
ns, P ≥ 0.05; *P < 0.05; **P < 0.01; ***P < 0.001.
The overall mean tyrosine content was lowest in the control sample (0.104 mg tyrosine/g), whereas the LBG-supplemented samples showed slightly higher values ranging from 0.109 to 0.114 mg tyrosine/g (Table 3). Storage time had a clear effect, with tyrosine content increasing from 0.095 mg tyrosine/g on day 1 to 0.111 mg tyrosine/g on day 14 and 0.120 mg tyrosine/g on day 28, indicating that proteolysis continued during refrigerated storage. The significant treatment × storage time interaction suggests that the extent of proteolytic change differed slightly among treatments. As shown in Table S3, the control sample exhibited the lowest tyrosine content on day 1, whereas all samples reached similar values by day 28.
The increase in tyrosine is primarily attributed to the proteolytic activity of lactic acid bacteria, which hydrolyse caseins into peptides and release free amino acids (Dinkçi et al., Reference Dinkçi, Kesenkaş, Korel and Kınık2015). Although bacterial counts declined during storage, the proteolytic enzymes secreted in earlier stages likely remained active, thereby sustaining amino acid release. The present findings agree with previous reports that demonstrated an increase in tyrosine and other free amino acids during refrigerated storage of kefir (Sarica and Coşkun, Reference Sarica and Coşkun2020; Yıldız-Akgül et al., Reference Yıldız-Akgül, Yetişemiyen, Şenel and Yıldırım2018).
Total phenolic content
Table 3 summarizes the fixed effects of LBG supplementation, storage time and their interaction on the TPC of goat milk kefir, whereas the estimated marginal means for each treatment × storage time combination are presented in Table S3. According to the linear mixed model, storage time significantly affected TPC (P < 0.01), whereas neither LBG supplementation nor the treatment × storage time interaction had a significant effect (P > 0.05). Across all treatments and storage times, TPC ranged from 6.39 to 8.74 mg GAE/100 g.
The general mean TPC increased from 6.48 mg GAE/100 g on day 1 to 7.82 mg GAE/100 g on day 14 and 7.96 mg GAE/100 g on day 28. This indicates that the increase in TPC was mainly associated with storage time rather than LBG concentration. In Table S3, the lowest TPC value was observed in the K0.05 sample on day 1 (6.39 mg GAE/100 g), while the highest value was recorded in the same treatment on day 28 (8.74 mg GAE/100 g). However, because treatment and interaction effects were not significant, these numerical differences should not be interpreted as a specific effect of LBG concentration. In a study conducted by Nurliyani and Sadewa (Reference Nurliyani and Sadewa2015), the TPC of goat milk kefir fortified with inulin and black rice extract and stored at 4°C for up to 7 days ranged between 4.60 and 7.40 mg/100 mL. In fermented whey protein samples using water kefir, the TPC has been reported to range between 7.50 and 8.50 mg GAE/100 g (Alrosan et al., Reference Alrosan, Tan, Easa, Gammoh, Alu'datt, Kubow, Almajwal and Al-qaisi2023).
Similar findings were also observed in different studies (Atalar, Reference Atalar2019; Perna et al., Reference Perna, Simonetti and Gambacorta2019; Yilmaz-Ersan et al., Reference Yilmaz-Ersan, Ozcan, Akpinar-Bayizit and Sahin2016). Perna et al. (Reference Perna, Simonetti and Gambacorta2019) reported that during refrigerated storage, the Folin-Ciocalteu reducing capacity increased in all kefir samples. The reason for this increase can be explained by the temperature and duration of heat treatment, pH, protein type and concentration, the type and structure of phenolic compounds and proteolytic activity of the microorganisms to the breakage of the protein–polyphenol complexes and thus the release of polyphenols (Perna et al., Reference Perna, Simonetti and Gambacorta2019; Yilmaz-Ersan et al., Reference Yilmaz-Ersan, Ozcan, Akpinar-Bayizit and Sahin2018).
Antioxidant activity
Table 3 summarizes the fixed effects of LBG supplementation, storage time and their interaction on the AA of goat milk kefir, whereas the estimated marginal means for each treatment × storage time combination are presented in Table S3. According to the linear mixed model, neither LBG supplementation, storage time, nor their interaction significantly affected AA (P > 0.05). Across all treatments and storage times, AA values ranged from 0.69 to 1.01 µM TE/100 g (Table S3).
The overall mean AA values were 0.80, 0.89 and 0.91 µM TE/100 g on days 1, 14 and 28, respectively (Table 3). Although a slight numerical increase was observed during storage, this change was not statistically significant. Similarly, the mean AA values of the treatment groups were close to each other, ranging from 0.81 to 0.94 µM TE/100 g. Therefore, LBG supplementation did not significantly alter the AA of goat milk kefir. This is consistent with findings reported by Yilmaz-Ersan et al. (Reference Yilmaz-Ersan, Ozcan, Akpinar-Bayizit and Sahin2016) and Saadi et al. (Reference Saadi, Zaidi, Oomah, Haros, Yebra and Hosseinian2017). Yilmaz-Ersan et al. (Reference Yilmaz-Ersan, Ozcan, Akpinar-Bayizit and Sahin2016) investigated the antioxidant properties of kefir produced from goat milk and reported that the ABTS activity during storage ranged between 11.14 and 12.19 mg Trolox/100 mL. According to Saadi et al. (Reference Saadi, Zaidi, Oomah, Haros, Yebra and Hosseinian2017), the duration of storage had a negligible impact on kefir’s AA. Several studies declared that the change of AA in fermented milk products may be attributed to the metabolism of the microorganism of the kefir culture and milk protein proteolysis during fermentation and storage (Perna et al., Reference Perna, Simonetti and Gambacorta2019; Yilmaz-Ersan et al., Reference Yilmaz-Ersan, Ozcan, Akpinar-Bayizit and Sahin2016).
Conclusion
This study evaluated the effects of LBG supplementation on the microbiological, biochemical and biofunctional properties of goat milk kefir during refrigerated storage. Storage time was the primary factor affecting microbial viability, proteolytic activity and TPC, whereas the effects of LBG supplementation were more limited. LBG significantly influenced lactococci, AAB and yeast populations, whereas its effects on BA concentrations were limited and inconsistent across LBG inclusion levels. No significant effects were observed for lactobacilli, TMAB, Leuconostoc spp., TPC or AA.
Overall, LBG supplementation did not markedly alter the general microbiological or biofunctional characteristics of goat milk kefir during storage. Nevertheless, its selective effects on specific microbial groups indicate that LBG may influence microbial dynamics during kefir storage. Further studies are needed to elucidate the mechanisms underlying the selective effects of LBG on microbial populations and BA formation, and to explore its potential application in the development of functional goat milk kefir products.
Supplementary material
The supplementary material for this article can be found at https://doi.org/10.1017/S0022029926102647.
Acknowledgements
During the preparation of this manuscript, the authors used generative AI tools (ChatGPT) and language-editing software (Grammarly) solely to improve readability and linguistic quality. All content was subsequently reviewed, verified and edited by the authors, who accept full responsibility for the integrity and accuracy of the final version of the manuscript.
Author contributions
E.S.: Conceptualization, Methodology, Validation, Formal analysis, Investigation, Writing – original draft, Writing – review and editing, and Visualization. G.B., D.A. and Ş.B.E.: Methodology, Validation, Formal analysis, Investigation, Writing – original draft, Writing – review and editing, and Visualization.
Declaration of interest
All authors certify that they have no affiliations with or involvement in any organization or entity with any financial interest or non-financial interest in the subject matter or materials discussed in this manuscript.
Ethics and approvals
This study was conducted using goat milk obtained from a commercial dairy enterprise and did not involve any experimental procedures on live animals or human participants. Therefore, ethical approval was not required.
Funding statement
The authors did not receive support from any organization for the submitted work.



 Open access

