1. Introduction
Palaeogeographic information provides key starting constraints for plate tectonic reconstructions, in particular for the provenance of terranes and microcontinents that become amalgamated to larger continental masses during collisional processes. The most widely used palaeogeographic indicators include palaeoclimatologic, palaeobiographic and palaeomagnetic data and provenance analysis of detrital heavy minerals (e.g. Van der Voo, Reference Van der Voo1988; McLennan et al. Reference McLennan, Hemming, McDaniel, Hanson, Johnsson and Basu1993; Morton & Hallsworth, Reference Morton and Hallsworth1994; Torsvik et al. Reference Torsvik, Smethurst, Meert, Van Der Voo, McKerrow, Brasier, Sturt and Walderhaug1996; Scotese, Boucot & McKerrow, Reference Scotese, Boucot and McKerrow1999; Golonka & Ford, Reference Golonka and Ford2000; Cocks & Torsvik, Reference Cocks and Torsvik2002; Fedo, Sircombe & Rainbird, Reference Fedo, Sircombe and Rainbird2003). Geochemical and isotope-geochemical fingerprints generally do not provide unambiguous constraints (Arndt & Goldstein, Reference Arndt and Goldstein1987). Furthermore, palaeomagnetic data lack spatial resolution as the latitudinal position of individual tectonic blocks may have an uncertainty range of as large as 40° (in the case of the Early Palaeozoic Peri-Gondwanan shelf, see fig. 11 in Franke, Cocks & Torsvik, Reference Franke, Cocks and Torsvik2017 and references therein).
The possibility to date detrital heavy minerals and, therefore, to constrain the age of the igneous and/or high-grade metamorphic protoliths of sedimentary rocks has gained tremendous significance since the early studies by Ledent, Patterson & Tilton (Reference Ledent, Patterson and Tilton1964) and Tatsumoto & Patterson (Reference Tatsumoto and Patterson1964). In particular, the development of the high spatial resolution analytical tools of secondary ion mass spectrometry (SIMS) and laser ablation inductively coupled plasma mass spectrometry (LA-ICP-MS) has made U–Pb dating of detrital minerals, particularly zircon, the most applied approach in provenance analyses. In comparison to other methods, SIMS and LA-ICP-MS U–Pb dating of zircons provides, with relative ease, palaeogeographic constraints in the form of age spectra that fingerprint the source or sources of detrital zircons in sedimentary rocks. Since its first applications, U–Pb dating of detrital minerals has produced the largest database of provenance.
The subjective comparison of individual zircon age spectra with each other or with likely source areas is in many cases inadequate, as the pattern may be changed during erosion of the source and transport to the sink and, therefore, the similarity of pattern alone is not always conclusive (e.g. Blatt, Reference Blatt1967; Dickinson & Gehrels, Reference Dickinson and Gehrels2009a; Hietpas et al. Reference Hietpas, Samson, Moecher and Chakraborty2011; Zimmermann et al. Reference Zimmermann, Andersen, Madland and Larsen2015). For instance, high-topography (generally young) areas are subject to stronger erosion than deeply eroded low-topography (old or stable) areas and, therefore, zircons derived from the high-topography areas are likely to be overrepresented in the zircon age spectra. Especially in datasets that are dominated by zircons from the youngest magmatic or metamorphic event, the age distribution of older inherited zircons may not be representative (Cawood, Hawkesworth & Dhuime, Reference Cawood, Hawkesworth and Dhuime2012, Reference Cawood, Hawkesworth and Dhuime2013). Similarly, multiple recycling and redeposition of sediments and sedimentary rocks may change the age spectra or result in mixed age spectra with material from different sources (e.g. Blatt, Reference Blatt1967; Moecher & Samson, Reference Moecher and Samson2006; Dickinson & Gehrels, Reference Dickinson and Gehrels2009a; Hietpas et al. Reference Hietpas, Samson, Moecher and Chakraborty2011; Hawkesworth, Cawood & Dhuime, Reference Hawkesworth, Cawood and Dhuime2013; Zimmermann et al. Reference Zimmermann, Andersen, Madland and Larsen2015; Andersen, Kristoffersen & Elburg, Reference Andersen, Kristoffersen and Elburg2016). Some of these problems may be reduced or avoided by using large, compiled datasets and applying quantitative filtering and data evaluation techniques. Statistical data analysis has become possible because of the increasing number of high-quality datasets on the age distribution of detrital zircons.
We present a simple yet powerful approach to statistical data mining and quantitatively evaluating detrital age spectra that allows the identification of provenance end-member populations for a composite crust. We tested the zircon provenance analysis for the Peri-Gondwanan crust north of Africa and adjacent areas for the following reasons: (i) a huge dataset is available for statistical treatment; (ii) there exists detailed geological background information; and (iii) there exists a wide range of tectonic fragments of potentially contrasting provenance that have been juxtaposed during the Variscan orogeny. We compiled 58 601 U–Pb ages from 770 Precambrian to Lower Palaeozoic sedimentary rocks from 160 publications, filtered the dataset to reduce the age spectra to the provenance signal, and compared the provenance signal with age patterns of potential source regions. The resulting provenance map for the Variscan orogen provides fundamental constraints against which published tectonic models, suggested litho-biostratigraphic correlations among different terranes, and the palaeogeographic reconstruction of Peri-Gondwana are tested and in part disqualified.
2. Tectonic elements of the Peri-Gondwanan shelf
2.a. The assemblage of Pangaea
The assembly of the Phanerozoic supercontinent Pangaea encompasses the Palaeozoic convergence of the Gondwana and Laurussia plates. It culminated in the Caledonian and Variscan orogenies by affecting the northern Lower Palaeozoic continental shelf of the Gondwana plate, i.e. Peri-Gondwana, which was situated north of the Amazonas Craton, the West African Craton, the Sahara Metacraton and the Arabian–Nubian Shield. The shelf comprises blocks of Neoproterozoic–Cambrian basement overlain by Lower Palaeozoic volcano-sedimentary successions (e.g. Robardet et al. Reference Robardet, Verniers, Feist and Paris1994; Gutiérrez-Marco et al. Reference Gutiérrez-Marco, Robardet, Rábano, Sarmiento, San José Lancha, Herranz, Pieren Pidal, Gibbons and Moreno2002; Linan et al. Reference Linan, Gozalo, Palacios, Vintaned, Ugidos, Mayoral, Gibbons and Moreno2002; Geyer et al. Reference Geyer, Elicki, Fatka, Zylinska and McCann2008; Servais et al. Reference Servais, Dzik, Fatka, Heuse, Vecoli, Verniers and McCann2008).
The different initial position along the shelf and the contrasting pre-Variscan tectonic history resulted in three provinces of distinctive fauna (e.g. Robardet et al. Reference Robardet, Verniers, Feist and Paris1994; Scotese, Boucot & McKerrow, Reference Scotese, Boucot and McKerrow1999; Cocks & Torsvik, Reference Cocks and Torsvik2002), isotopic signature (Henderson et al. Reference Henderson, Collins, Murphy, Gutierrez-Alonso and Hand2016) and detrital heavy mineral composition of the sedimentary cover of the Peri-Gondwanan crust (e.g. Fernández Suárez et al. Reference Fernández Suárez, Gutiérrez Alonso, Jenner and Tubrett1998; Friedl et al. Reference Friedl, Finger, McNaughton and Fletcher2000; Bea et al. Reference Bea, Montero, Talavera, Abu Anbar, Scarrow, Molina and Moreno2010; Dörr et al. Reference Dörr, Zulauf, Gerdes, Lahaye and Kowalczyk2015; Henderson et al. Reference Henderson, Collins, Murphy, Gutierrez-Alonso and Hand2016): (i) Avalonia (north of the Rheic suture), (ii) West Africa and (iii) East Africa–Arabia. Cambro-Ordovician rifting along the Cadomian–Avalonian belt led to the opening of the Rheic Ocean, thereby separating Avalonia from mainland Gondwana (e.g. Paris & Robardet, Reference Paris and Robardet1990; Veevers, Reference Veevers2004; Nance & Linnemann, Reference Nance and Linnemann2008; Nance et al. Reference Nance, Gutiérrez-Alonso, Keppie, Linnemann, Murphy, Quesada, Strachan and Woodcock2010). Coeval to seafloor spreading, intracontinental extension resulted in the formation of extended Peri-Gondwanan shelf areas north and south of the intervening Rheic Ocean (e.g. Cocks, McKerrow & Van Staal, Reference Cocks, McKerrow and Van Staal1997; Van Staal et al. Reference Van Staal, Dewey, Niocaill, McKerrow, Blundell and Scott1998; Kroner & Romer, Reference Kroner and Romer2013; Stampfli et al. Reference Stampfli, Hochard, Vérard, Wilhem and von Raumer2013). After the Caledonian collision of Avalonia with the East European Craton and Laurentia to form Laurussia during the Late Ordovician–Silurian period (Torsvik & Rehnström, Reference Torsvik and Rehnström2003), the southern boundary of Avalonia developed into an active margin resulting in the subduction of the Rheic Ocean (Nance et al. Reference Nance, Gutiérrez-Alonso, Keppie, Linnemann, Murphy, Quesada, Strachan and Woodcock2010 and references therein). Diachronous collision of Peri-Gondwanan crust with Laurussia caused the Early Devonian–Permian Acadian–Variscan–Alleghenian orogeny (e.g. Matte, Reference Matte2001; Kroner & Romer, Reference Kroner and Romer2013; Stampfli et al. Reference Stampfli, Hochard, Vérard, Wilhem and von Raumer2013; Franke, Cocks & Torsvik, Reference Franke, Cocks and Torsvik2017), thereby forming Western Pangaea, and eventually resulted in syn-collisional escape and strike-slip tectonics (e.g. Arthaud & Matte, Reference Arthaud and Matte1977; Martínez Catalán, Reference Martínez Catalán2012; Kroner, Roscher & Romer, Reference Kroner, Roscher and Romer2016; Stephan et al. Reference Stephan, Kroner, Hahn, Hallas and Heuse2016). Owing to the complex history of the opening and closure of the Rheic Ocean with shelf fragmentation and displacement during collision, respectively, the provenance of individual blocks may be ambiguous. For example, the Ibero-Armorican Arc shows provenance features that have typically been ascribed to Avalonia (e.g. Braid et al. Reference Braid, Murphy, Quesada and Mortensen2011; Pérez-Cáceres et al. Reference Pérez-Cáceres, Martínez Poyatos, Simancas and Azor2017) and West Africa (e.g. Linnemann et al. Reference Linnemann, Pereira, Jeffries, Drost and Gerdes2008b; Díez Fernández et al. Reference Díez Fernández, Catalán, Gerdes, Abati, Arenas and Fernández-Suárez2010; Strachan et al. Reference Strachan, Linnemann, Jeffries, Drost and Ulrich2014) as well as East Africa–Arabia (e.g. Shaw et al. Reference Shaw, Gutiérrez-Alonso, Johnston and Pastor Galán2014; Orejana et al. Reference Orejana, Merino Martínez, Villaseca and Andersen2015). Moreover, as evidenced in the Mediterranean, post-Pangaea divergent and convergent tectonics of micro-continental blocks (e.g. Schmid et al. Reference Schmid, Fügenschuh, Kissling and Schuster2004; Handy, Ustaszewski & Kissling, Reference Handy, Ustaszewski and Kissling2015) further enhance the complexity of the Peri-Gondwana provenance pattern.
2.a.1. Avalonia
As part of Peri-Gondwana, Avalonia contains remnants of the Cadomian magmatic arc that are only exposed in a few small tectonic inliers of East Avalonia, i.e. in the Midland Craton, northern and southern Wales, and Ireland, as well as in Silesia and Małopolska (O'Brien, Wardle & King, Reference O'Brien, Wardle and King1983; Dudek, Reference Dudek, Dallmeyer, Franke and Weber1995; Molzahn, Anthes & Reischmann, Reference Molzahn, Anthes and Reischmann1998; Breitkreuz & Kennedy, Reference Breitkreuz and Kennedy1999; Pharaoh, Reference Pharaoh1999; Belka et al. Reference Belka, Ahrendt, Franke, Wemmer, Franke, Altherr, Haak, Ocncken and Tanner2000; Verniers et al. Reference Verniers, Pharaoh, André, Debacker, De Vos, Everaerts, Herbosch, Samuelsson, Sintubin, Vecoli, Winchester, Pharao and Verniers2002; Krawczyk et al. Reference Krawczyk, McCann, Cocks, England, McBride, Wybraniez and McCann2008). The rocks are dominated by 700–540 Ma old volcano-sedimentary successions that have been intruded by c. 620–540 Ma old I-type granitoids (Pharaoh & Carney, Reference Pharaoh, Carney, Carney, Horak, Pharao, Gibbons, Wilson, Barclay, Bevins, Cope and Ford2000; Linnemann et al. Reference Linnemann, Pereira, Jeffries, Drost and Gerdes2008b; Moryc & Łydka, Reference Moryc and Łydka2012; Strachan, Reference Strachan, Woodcock and Strachan2012).
Upper Proterozoic to Ordovician siliciclastic rocks are characterized by thick turbiditic sequences, which were in part deposited in graben systems that developed during the rifting of Peri-Gondwana. The decoupling of Avalonia from Gondwana is recorded in the change from Early Ordovician Gondwanan faunal signatures to Silurian faunas of Laurentian affinity, i.e. the transition from a cool-water, high-latitude environment (Gondwana) to warmer, lower latitude conditions, i.e. Laurentia (Boyce, Ash & O'Brien, Reference Boyce, Ash and O'Brien1991; Williams, Reference Williams1993; Dean et al. Reference Dean, Monod, Rickards, Demir and Bultynck2000; Chen et al. Reference Chen, Siebel, Satir, Terzioğlu and Saka2002; Oczlon, Seghedi & Carrigan, Reference Oczlon, Seghedi, Carrigan, Linneman, Nance, Kraft and Zulauf2007; Pollock, Hibbard & van Staal, Reference Pollock, Hibbard and van Staal2011). The separation of Gondwana is accompanied by Middle Cambrian to Early Ordovician bimodal volcanism in Avalonia (White et al. Reference White, Barr, Bevier and Kamo1994; Johnson & McLeod, Reference Johnson, McLeod, Nance and Thompson1996; Rogers et al. Reference Rogers, van Staal, McNicoll, Pollock, Zagorevski and Whalen2006; Schulz et al. Reference Schulz, Stewart, Tucker, Pollock and Ayuso2008; Dunning et al. Reference Dunning, Swinden, Kean, Evans and Jenner2009).
The docking of Avalonian terranes to Laurentia is underlined by Early to Middle Ordovician obduction of ophiolites on both Laurentia and Avalonia (Zagorevski et al. Reference Zagorevski, Van Staal, Rogers, McNicoll, Pollock, Tollo, Bartholomew, Hibbard and Karabinos2010). The Early Ordovician rifting from Gondwana and the Late Ordovician docking of East Avalonia to Laurentia (Torsvik & Rehnström, Reference Torsvik and Rehnström2003) are coeval to those in the Meguma and West Avalonian terranes (Keppie & Krogh, Reference Keppie and Krogh2000; MacDonald et al. Reference MacDonald, Barr, White and Ketchum2002).
Post-rifting overstep sequences are characterized by Ordovician manganese-rich sedimentary rocks (Kramm, Reference Kramm1976; Jimenez Millan & Velilla, Reference Jimenez Millan and Velilla1998; Kennan & Morris, Reference Kennan, Morris, Woodcock, Quirk, Fitches and Barnes1999; Dill et al. Reference Dill, Sachsenhofer, Grecula, Sasvári, Palinkaš, Borojevic-Soštaric, Strmic-Palinkaš, Prochaska, Garuti, Zaccarini, Arbouille, Schulz and McCann2008). Because these lithologies are not known from Peri-Gondwanan domains south of the Rheic Ocean, this exclusive feature may serve as a palaeogeographic proxy (Romer, Kirsch & Kroner, Reference Romer, Kirsch and Kroner2011). From the Late Ordovician epoch onwards, Avalonia received detritus from the erosion of the Caledonides due to the connection with Baltica (Belka & Narkiewicz, Reference Belka, Narkiewicz and McCann2008; Verniers et al. Reference Verniers, Maletz, Křiž, Žigaitė, Paris, Schönlaub, Wrona and McCann2008).
2.a.2. Northern Gondwana
The basement of the West African and the East African–Arabian part of Peri-Gondwana consists of the Cadomian magmatic arc combined with volcano-sedimentary rocks that have been intruded by voluminous I-type granitoid bodies of regionally different ages between 620 and 530 Ma (J. J. Beetsma, unpub. Ph.D. thesis, Vrije Universiteit Amsterdam, 1995; Linnemann et al. Reference Linnemann, Gehmlich, Tichomirowa, Buschmann, Nasdala, Jonas, Lützner, Bombach, Franke, Altherr, Haak, Ocncken and Tanner2000, Reference Linnemann, D'Lemos, Drost, Jeffries, Gerdes, Romer, Samson, Strachan and McCann2008a,Reference Linnemann, Pereira, Jeffries, Drost and Gerdesb, Reference Linnemann, Romer, Gerdes, Jeffries, Drost, Ulrich, Linneman and Romer2010b; Ballèvre, Le Goff & Hébert, Reference Ballèvre, Le Goff and Hébert2001; Chantraine et al. Reference Chantraine, Egal, Thiéblemont, Le Goff, Guerrot, Ballèvre and Guennoc2001; Pereira et al. Reference Pereira, Chichorro, Linnemann, Eguiluz and Silva2006; Ezzouhairi et al. Reference Ezzouhairi, Ribeiro, Ait Ayad, Moreira, Charif, Ramos, de Oliveira, Coke, Ennih and Liégeois2008; Talavera et al. Reference Talavera, Montero, Martínez Poyatos and Williams2012).
The overlying Upper Proterozoic to Cambrian sedimentary sequences are characterized by siliciclastic erosional debris from the former Cadomian (e.g. Linnemann et al. Reference Linnemann, Gerdes, Hofmann and Marko2014; Žák & Sláma, Reference Žák and Sláma2017) and Pan-African magmatic arcs (e.g. Balintoni et al. Reference Balintoni, Balica, Ducea, Chen, Hann and Şabliovschi2009; Pereira, Reference Pereira2015) and from the recycled Gondwanan continental crust (e.g. Meinhold, Morton & Avigad, Reference Meinhold, Morton and Avigad2013; Rösel et al. Reference Rösel, Boger, Möller, Gaitzsch, Barth, Oalmann and Zack2014). The Upper Cambrian to Ordovician sedimentary deposits are dominated by highly mature rocks that may reach several thousand metres thickness. These sediments originally experienced intense chemical weathering on a stable continent and were redistributed to the continent margin during the early stages of the rifting of the Rheic Ocean with decreasing detritus from the Cadomian arc (Pique & Michard, Reference Pique and Michard1989; Nägler, Schafer & Gebauer, Reference Nägler, Schafer and Gebauer1995; J. J. Beetsma, unpub. Ph.D. thesis, Vrije Universiteit Amsterdam, 1995; Linnemann et al. Reference Linnemann, Gehmlich, Tichomirowa, Buschmann, Nasdala, Jonas, Lützner, Bombach, Franke, Altherr, Haak, Ocncken and Tanner2000, Reference Linnemann, Hofmann, Romer, Gerdes, Linnemann and Romer2010a; Avigad et al. Reference Avigad, Sandler, Kolodner, Stern, McWilliams, Miller and Beyth2005; Romer & Hahne, Reference Romer and Hahne2010).
A local tectonic feature of the Peri-Gondwanan crust is the so called ‘Sardic phase’ that is recorded as a 457–443 Ma tectono-metamorphic event in Middle Ordovician rocks of the Agordo basement and the Strona–Ceneri Zone of the Southern Alps and in parts of the Carpathians (Poli & Zanferrari, Reference Poli, Zanferrari, Carmignani and Sassi1992; Franz & Romer, Reference Franz and Romer2007; Zurbriggen, Reference Zurbriggen2015) and as a pronounced unconformity in the shelf sediments of the Montagne Noire, the Mouthoumet Massif, the Eastern Pyrenees, the Catalonian Coastal Ranges, the Central Iberian Zone, Sardinia, Corsica, Sicily and in southern Turkey (Lotze, Reference Lotze1956; Carmignani et al. Reference Carmignani, Franceschelli, Pertusati, Memmi and Ricci1982; Gil Ibarguchi, Navidad & Ortega, Reference Gil Ibarguchi, Navidad and Ortega1990; Gutiérrez-Marco, De San José & Pieren, Reference Gutiérrez-Marco, De San José, Pieren and Dallmeyer1990; Hammann, Reference Hammann1992; Robardet et al. Reference Robardet, Verniers, Feist and Paris1994; Valverde-Vaquero & Dunning, Reference Valverde-Vaquero and Dunning2000; Trombetta et al. Reference Trombetta, Cirrincione, Corfu, Mazzoleni and Pezzino2004; Rossi, Oggiano & Cocherie, Reference Rossi, Oggiano and Cocherie2009; Javier Álvaro et al. Reference Javier Álvaro, Colmenar, Monceret, Pouclet and Vizcaïno2016; Cocco & Funedda, Reference Cocco and Funedda2017). According to Gutiérrez-Marco et al. (Reference Gutiérrez-Marco, Robardet, Rábano, Sarmiento, San José Lancha, Herranz, Pieren Pidal, Gibbons and Moreno2002 and references therein), echoes of the Sardic event may be represented by oolitic iron beds in Iberia. It is worth noting that the Sardic event is unknown in the Ossa-Morena Zone, the Armorican Massif, the Bohemian Massif and adjacent areas.
The Upper Ordovician sequences of northern Gondwana are dominated by the widespread occurrence of glaciomarine tillites that are indicative of the glaciation of northern Gondwana (Ghienne, Reference Ghienne2003 and references therein). However, contemporaneous tillites are not known from Avalonia, which must have drifted away from Gondwana earlier. Thus, the glaciomarine tillite represents a tracer to assign individual crustal fragments to the southern passive margin of the Rheic Ocean, i.e. to Gondwana during the Late Ordovician epoch (Linnemann & Heuse, Reference Linnemann and Heuse2000).
2.b. Tectonic models for the pre-Pangaea stage
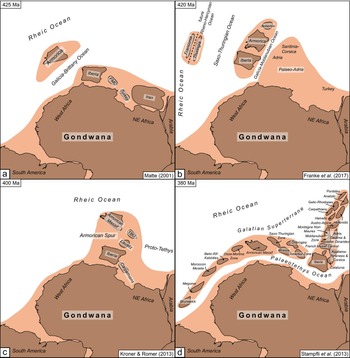
There is broad consensus about the plate tectonic kinematics of Avalonia, which separated from Gondwana at c. 480 Ma (Cocks & Fortey, Reference Cocks and Fortey1982) and collided with the East European Craton (Baltica) in the Late Ordovician epoch (Torsvik & Rehnström, Reference Torsvik and Rehnström2003). However, apart from explanations of tectono-metamorphic processes during the formation of Western Pangaea culminating in the Variscan orogeny, there are several tectonic models that rely on contrasting starting conditions, including a different number of involved plates and oceans and different initial positions along the Peri-Gondwanan shelf south of the Rheic Ocean (Fig. 1):
Tectonic models of pre-Pangaean palaeogeography and architecture of Peri-Gondwana. Note the different number of involved plates and oceans and the position of Iberia. Modified after Matte (Reference Matte2001), Franke, Cocks & Torsvik (Reference Franke, Cocks and Torsvik2017), Kroner & Romer (Reference Kroner and Romer2013) and Stampfli et al. (Reference Stampfli, Hochard, Vérard, Wilhem and von Raumer2013). Orthographic projection.

(i) Matte (Reference Matte1986) explained the distribution of subduction-related high-pressure domains within the Variscan belt by closure of two oceanic domains (Rheic Ocean in the north, and Galicia–Brittany Ocean in the south) involving the collision of three lithospheric plates (Gondwana, Armorica and Laurussia) with initial subduction beneath the intervening Armorican microplate. Prior to the opening of the Galicia–Brittany Ocean, the Armorican microplate as well as the Peri-Gondwanan fragments were attached adjacent to the West African Craton with Iberia in the westernmost position.
(ii) Palaeomagnetic studies (Tait et al. Reference Tait, Bachtadse, Franke and Soffel1997) challenged this model by suggesting that Peri-Gondwana represents an assemblage of microplates that have been separated by individual oceans during the Ordovician–Early Devonian epoch and have been juxtaposed during the Variscan orogeny (Franke, Reference Franke, Franke, Haak, Oncken and Tanner2000; Torsvik & Cocks, Reference Torsvik and Cocks2013; Franke, Cocks & Torsvik, Reference Franke, Cocks and Torsvik2017). Similar to Matte (Reference Matte1986), all microplates were initially located adjacent to the West African Craton.
(iii) Because of striking similarities between sedimentological and faunal data (e.g. Young, Reference Young, McKerrow and Scotese1990; Robardet, Reference Robardet, Catalán, Hatcher, Arenas and García2002), the same geochemical fingerprint of deep chemical weathering (e.g. Noblet & Lefort, Reference Noblet and Lefort1990; Romer & Hahne, Reference Romer and Hahne2010; Ugidos et al. Reference Ugidos, Sánchez-Santos, Barba and Valladares2010), and geochronological, isotope-geochemical data and provenance data (e.g. Linnemann et al. Reference Linnemann, McNaughton, Romer, Gehmlich, Drost and Tonk2004) of Cambrian to Devonian sedimentary rocks covering the basement of the Armorican Terranes, Kroner et al. (Reference Kroner, Hahn, Romer, Linnemann, Linnemann, Nance, Kraft and Zulauf2007) proposed that Peri-Gondwana south of the Rheic Ocean represents an extended shelf of the Gondwana plate comprising Cadomian blocks that are separated by thinned continental crust. Kroner & Romer (Reference Kroner, Romer, Linnemann and Romer2010) introduced the term ‘Armorican Spur’ and explained the Variscan orogeny as the exclusive result of the collision between the two plates of Gondwana and Laurussia subsequent to the closure of the Rheic Ocean. Iberia is placed in a central position of the spur. Coeval to the ongoing Gondwana–Laurussia convergence, the Devonian opening of the Palaeotethys Ocean occurred east of the Armorican Spur (Kroner & Romer, Reference Kroner, Romer, Linnemann and Romer2010, Reference Kroner and Romer2013) due to plate tectonic reorganization processes (Kroner, Roscher & Romer Reference Kroner, Roscher and Romer2016).
(iv) Alternatively, Stampfli & Borel (Reference Stampfli and Borel2002) placed all Peri-Gondwanan fragments together with Asian terranes such as Turkey, Turan (Iran), Pamirs, Tarim and North China in a coherent ribbon-like terrane, i.e. the so called ‘Hun Superterrane’, that detached from Gondwana during the opening of the Palaeotethys Ocean during the Late Ordovician–Silurian period. The assembly is mainly based on the distribution of Cambrian–Devonian carbonate platforms and the Cambro-Ordovician drifting patterns. Later, Stampfli et al. (Reference Stampfli, Hochard, Vérard, Wilhem and von Raumer2013) rejected the model of a coherent Hun Superterrane. The newly defined ‘Galatian Superterrane’ contains the entire Peri-Gondwanan crust south of the Rheic Ocean and north of Africa (Fig. 1) and remained an integral part of Gondwana until the Devonian period. Owing to the Devonian opening of the Palaeotethys Ocean, this ribbon continent rifted off from Gondwana and collided with Laurussia not before the Late Visean final stage of the Variscan orogeny.
3. Methods
3.a. Database selection and pre-processing
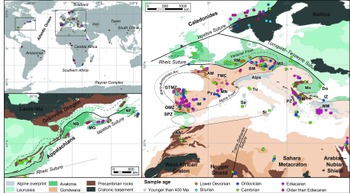
Age spectra of Precambrian to Lower Palaeozoic samples were constructed on the basis of detrital zircon U–Pb ages from 160 publications (Fig. 2). The compilation combines single grain age data obtained by thermal ionization mass spectrometry (TIMS), LA-ICP-MS and SIMS (Tables S1, S2 in the online Supplementary Material available at http://journals.cambridge.org/geo). To uncover provenance patterns of the age spectra of each sample, we filtered the dataset as follows:
Simplified tectonic map with location of the investigated samples. Abbreviations: AA – Anti-Atlas; AM – Armorican Massif; BM – Bohemian Massif; Do – Dobrogea; GTMZ – Galicia–Trás-os-Montes Zone; FMC – French Massif Central; IM – Iberian Massif; IZ – Istanbul Zone; MG – Meguma; MM – Menderes Massif; Mo – Moesia; MS – Moravo-Silesian Zone; NB – New Brunswick; NF – Newfoundland; OMZ – Ossa-Morena Zone; Py – Pyrenees; PZ – Pelagonian Zone; RM – Rhenish Massif; Sa – Sardinia; Si – Sicily; SM – Serbo-Macedonian Massif; SPZ – South Portuguese Zone; Tu – Tuscany. A georeferenced kmz file (S4) of the sample locations is provided in the online Supplementary Material available at http://journals.cambridge.org/geo.
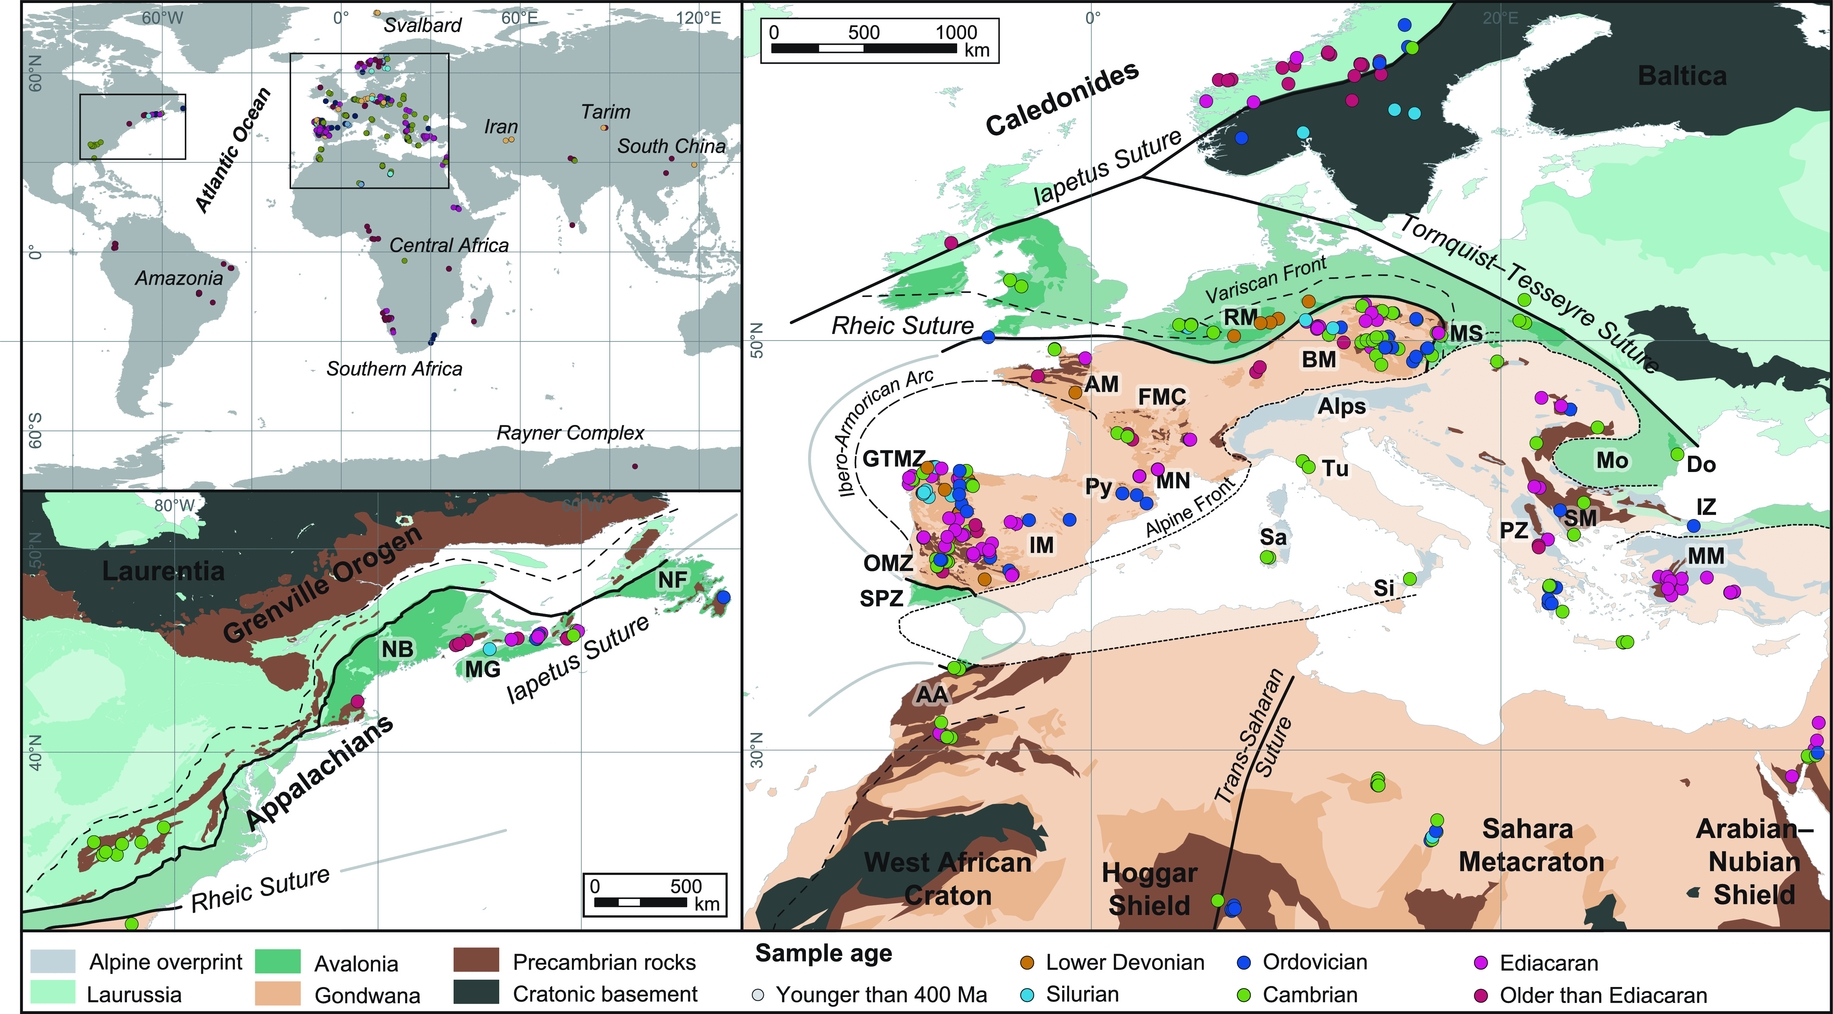
(i) We exclusively used samples that were deposited before 400 Ma, i.e. pre-Variscan samples (if the sample age was not given by the authors, we have used the age of the youngest zircon population as the minimum estimate for the deposition age) (Dickinson & Gehrels, Reference Dickinson and Gehrels2009b).
(ii) The entire dataset was re-processed using a common age calculation and concordance filter to ensure comparability (Table S3 in the online Supplementary Material available at http://journals.cambridge.org/geo). To guarantee that only concordant grains, i.e. with <10 % normal and <5 % reverse discordance, were included in the age compilation, the concordance of zircon grains older than 1000 Ma were calculated from their 206Pb–238U and 207Pb–206Pb ages and those of zircon grains younger than 1000 Ma were calculated from their 206Pb–238U and 207Pb–235U ages. Note, using 207Pb–206Pb ages to estimate discordance of Phanerozoic zircons may result in apparent discordance as for geologically young samples the intersection between the discordia reflecting the 207Pb–206Pb age and the concordia has a very flat angle. Even a small error in the 207Pb/206Pb ratio has a major effect on the apparent 207Pb–206Pb age (e.g. Mattinson, Reference Mattinson1987). Because of the shape of the concordia, which flattens for older ages, the intersection of the 207Pb/206Pb discordia and the concordia is better defined for older ages. For the data analysis, we used, therefore, the 206Pb–238U age for Phanerozoic and Neoproterozoic zircons and the 207Pb–206Pb age for zircons older than 1000 Ma.
(iii) Statistical data analysis, especially multidimensional scaling, is strongly influenced by large populations. The majority of the pre-Variscan samples, however, are affected by the Variscan and Cadomian orogeny, which eventually results in the over-representation of younger zircon grains. Statistical analysis of the entire age spectrum of each sample will put a much higher weight on these late events, which are of little relevance for provenance analysis, and only a little weight on the older zircon populations. Statistical data treatment may yield a different result if only the relevant portion of the spectrum is included in the dataset. For provenance analysis, the relevant information is preserved in the older detrital record (Cawood, Hawkesworth & Dhuime, Reference Cawood, Hawkesworth and Dhuime2013). Therefore, all zircon age spectra have been truncated to include exclusively pre-Cadomian ages, i.e. >700 Ma.
(iv) For detrital zircon data, the statistical adequacy, i.e. the extent to which the observed age abundance matches the corresponding abundance in the sediment, is influenced by the number of grains analysed (Vermeesch, Reference Vermeesch2004; Andersen, Reference Andersen2005; Pullen et al. Reference Pullen, Ibáñez-Mejía, Gehrels, Ibáñez-Mejía and Pecha2014) and by the sample preparation procedure (Sláma & Košler, Reference Sláma and Košler2012). An insufficient number of zircon grains analysed per sample, i.e. k <117, may cause certain age populations to go undetected or result in spurious peaks in the age spectra (Sircombe, Reference Sircombe2000; Vermeesch, Reference Vermeesch2004). The premise of a minimum of k = 117 ages (Vermeesch, Reference Vermeesch2004) refers to the original dataset, but is unwarranted after the exclusion of parts of the age spectrum. Cadomian ages amount to more than 75 % of the total age spectra in the majority of the compiled samples. For instance, a notional sample comprising 117 ages satisfies the condition, but it contains 88 Cadomian ages and 29 ages of the proper provenance. In order to preserve the proportional fraction in a statistically minimal input, we solely included samples containing more than 30 concordant ages in the >700 Ma age compilation.
3.b. Multidimensional scaling
Provenance analysis that is based on geochronological data requires comparison of the age distributions between the samples. Our dataset comprising n = 705 age distributions would result in n(n – 1)/2 = 248160 pairwise comparisons, which is definitely not feasible to do visually.
Mathematically, the similarity between two objects can be expressed as the distance between these objects within Euclidean space. Because the geochronological space is a functional space, it has to be transformed into Euclidean space. Multidimensional scaling (MDS) is a dimension-reducing algorithm that transfers the Kolmogorov–Smirnov dissimilarities between samples into Euclidean distances between the corresponding points within a multidimensional space (Vermeesch, Reference Vermeesch2013).
An advantage of MDS is the sample-size independence of the Kolmogorov–Smirnov test for a population size larger than 30 (Geweke & Singleton, Reference Geweke and Singleton1980; Bearden, Sharma & Teel, Reference Bearden, Sharma and Teel1982; Razali & Wah, Reference Razali and Wah2011). The technique has been successfully applied in several provenance studies (Stevens et al. Reference Stevens, Carter, Watson, Vermeesch, Andò, Bird, Lu, Garzanti, Cottam and Sevastjanova2013; Nie et al. Reference Nie, Peng, Möller, Song, Stockli, Stevens, Horton, Liu, Bird, Oalmann, Gong and Fang2014; Arboit et al. Reference Arboit, Collins, Morley, King and Amrouch2016; Rittner et al. Reference Rittner, Vermeesch, Carter, Bird, Stevens, Garzanti, Andò, Vezzoli, Dutt, Xu and Lu2016).
The resulting output matrix (MDS configuration) gives the (dis)similarity among the various data as coordinates in a geometric space. The dimensionality is chosen by the user. The more dimensions, the better the statistical fit of the data and the lower the significance of the various dimensions. We applied a three-dimensional solution to describe the variation of the large sample set.
3.c. Clustering the dataset
To objectively identify groups of similar age signature, i.e. provenance, we clustered the MDS data by using the corresponding Kolmogorov–Smirnov dissimilarities. The choice of the clustering algorithm depends on the MDS configuration. On the one hand, there is little domain knowledge to determine the input parameters in advance, e.g. the number of clusters and the presence of outliers. On the other hand, the algorithm has to discover clusters with arbitrary shapes, because the shapes of clusters in three-dimensional MDS may be, for instance, spherical, drawn-out, linear or elongated. We applied two cluster algorithms for the following reasons:
(i) Small sample size leads to a noisy MDS configuration as age populations may remain undetected. Classic clustering algorithms, e.g. k-means or hierarchical methods, are unable to discriminate between outliers and proper groups of data (Ester et al. Reference Ester, Kriegel, Sander and Xu1996). The source fingerprint of a sample may be blurred if recycling processes and/or sediment mixing took place during source-to-sink transport. Simple two-component mixing of two end-members results in elongate MDS configurations, whereas contributions from several sources or several processes result in irregular MDS configurations. The shape may be more arbitrary if several sources or processes are involved. The number of potential sources within the dataset, which is necessary information to determine the number of clusters, is unknown and, therefore, has to be estimated indirectly from the density of the data. For instance, Density-Based Spatial Clustering of Application with Noise (DBSCAN) is an algorithm aimed to detect outliers and handle arbitrary cluster shapes (Ester et al. Reference Ester, Kriegel, Sander and Xu1996). The principle is that for each point of a cluster the neighbourhood of a given radius has to contain at least a minimum number of points, i.e. the density in the neighbourhood of the point has to exceed some threshold. Hierarchical Density-Based Spatial Clustering of Application with Noise (HDBSCAN) computes the hierarchy of all DBSCAN clusterings, and then uses a stability-based extraction method to find optimal cuts in the hierarchy by defining the minimum number of points within a cluster as the only input parameter (Campello, Moulavi & Sander, Reference Campello, Moulavi, Sander, Pei, Tseng, Cao, Motoda and Xu2013).
(ii) MDS configurations with little or no noise are suitable for discrimination by hierarchical clustering analysis. This algorithm builds the hierarchy from the individual samples by progressively merging similar clusters. The similarity is expressed in pairwise Euclidean distances and the agglomeration results are presented in a dendrogram. The agglomeration is stopped when a sufficiently small number of clusters is achieved or the distances between cluster agglomerations exceeds a certain threshold. Both the number of clusters and the distances between cluster agglomerations, which are the input parameters for the clustering, are unknown and have to be estimated by the user. To avoid subjective interference in the cluster result, the unsupervised learning algorithm ‘gap statistic’ can estimate the optimal number of clusters (Tibshirani, Walther & Hastie, Reference Tibshirani, Walther and Hastie2001). The method uses the output of clustering and compares intra-cluster scattering with the scatter expected under a null reference distribution of the data, i.e. a distribution with no obvious clustering. Varying the number of clusters as the input parameter, the optimal number of clusters corresponds to the set up that yields the largest gap between both intra-cluster scatterings. The clustering result is validated and, if necessary, optimized by using a silhouette plot. The silhouette method tests for consistency within clusters by comparing the similarity of a sample i to its own cluster and to the other clusters (Rousseeuw, Reference Rousseeuw1987). The silhouette width generally ranges from –1 to 1. A value close to 1 indicates that the sample lies within its own cluster. If a sample lies between its assigned cluster and another one, the silhouette is between 0 and 1. Low or negative values mean the sample lies within another cluster indicating poor clustering or assignment to the wrong cluster. The next best fit cluster corresponds to the ‘neighbour’ that represents the cluster with the lowest average dissimilarity to a particular sample. The quality of the clustering is measured by the average silhouette over all the data of the entire dataset.
3.d. Reading cluster-coupled multidimensional scaling
Classic detrital zircon provenance analysis compares the zircon age spectra of sedimentary rocks from a sink area with the age spectra of magmatic (and metamorphic) events of different cratonic source areas. The source with the highest similarity to the sink is interpreted to be the provenance. Thus, an MDS cluster containing a compilation of magmatic and metamorphic events of a potential source represents a group of sedimentary rocks with mutual provenance. However, the shape of an MDS configuration depends on the number of sources (or provenances) and the sedimentary recycling and mixing processes involved during the source-to-sink transport. A simple two-provenance mixing results in an elongate MDS configuration with each provenance at the respective ends of the elongated MDS shape (‘end-member’). The ‘mixing line’ between the end-members indicates sedimentary mixing or recycling of both provenances (Vermeesch, Reference Vermeesch2013; Sharman & Johnstone, Reference Sharman and Johnstone2017).
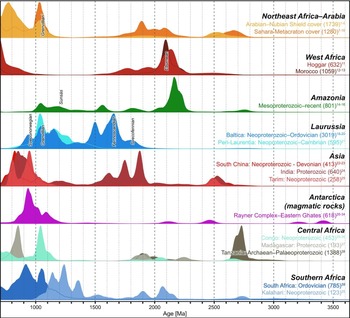
The underlying premise of this approach is a complete knowledge of the history of the source, as statistical data analysis of incomplete age spectra may result in meaningless or spurious outputs (see discussion in Section 3.a). The geochronological database of magmatic-metamorphic events of the Precambrian basement of northern Africa (e.g. Sahara Metacraton) is likely to be incomplete, as the craton is poorly exposed and northern Africa was an area of sediment accumulation rather than erosion during the Cambro-Ordovician period (Avigad et al. Reference Avigad, Gerdes, Morag and Bechstädt2012; Garfunkel, Reference Garfunkel2015). The West African Craton, the Sahara Metacraton and the Arabian–Nubian Shield are still largely covered by Cambro-Ordovician sedimentary rocks and, therefore, are unlikely to be significant source regions during the Cambro-Ordovician period. We avoid this gap in information and constrain the pre-Variscan palaeogeographic position of Variscan units on the Peri-Gondwanan shelf by comparing the detrital zircon age spectra of the corresponding sedimentary rocks with coevally deposited sedimentary rocks covering the cratonic Gondwana basement (Fig. 3). Similarities to these age distributions either indicate a proximate palaeogeographic position or at least the transport of the zircons by a common delta-fan system.
U–Pb ages of detrital zircons of potential source areas. Only pre-Devonian sedimentary rocks unless otherwise specified. Distributions of detrital zircon ages are plotted as kernel density estimates (bandwidth of 20 Ma, Epanechnikov kernel, 90–105 % concordance). Number of analysed ages in brackets. References (superscript): (1) Andresen et al. (Reference Andresen, Abu El-Enen, Stern, Wilde and Ali2014); (2) Avigad et al. (Reference Avigad, Kolodner, McWilliams, Persing and Weissbrod2003); (3) Avigad et al. (Reference Avigad, Stern, Beyth, Miller and McWilliams2007); (4) Avigad et al. (Reference Avigad, Weissbrod, Gerdes, Zlatkin, Ireland and Morag2015); (5) Kolodner et al. (Reference Kolodner, Avigad, McWilliams, Wooden, Weissbrod and Feinstein2006); (6) Moghadam et al. (Reference Moghadam, Li, Griffin, Stern, Thomsen, Meinhold, Aharipour and O'Reilly2017); (7) Altumi et al. (Reference Altumi, Elicki, Linnemann, Hofmann, Sagawe and Gärtner2013); (8) Bea et al. (Reference Bea, Montero, Talavera, Abu Anbar, Scarrow, Molina and Moreno2010); (9) Meinhold et al. (Reference Meinhold, Morton, Fanning, Frei, Howard, Phillips, Strogen and Whitham2011); (10) Meinhold, Morton & Avigad (Reference Meinhold, Morton and Avigad2013); (11) Linnemann et al. (Reference Linnemann, Ouzegane, Drareni, Hofmann, Becker, Gärtner and Sagawe2011); (12) Abati et al. (Reference Abati, Aghzer, Gerdes and Ennih2010); (13) Avigad et al. (Reference Avigad, Gerdes, Morag and Bechstädt2012); (14) Horbe et al. (Reference Horbe, Motta, de Almeida, Dantas and Vieira2013); (15) Matteini et al. (Reference Matteini, Dantas, Pimentel, de Alvarenga and Dardenne2012); (16) Andersen, Griffin & Pearson (Reference Andersen, Griffin and Pearson2002); (17) Be'eri-Shlevin et al. (Reference Be'eri-Shlevin, Gee, Claesson, Ladenberger, Majka, Kirkland, Robinson and Frei2011); (18) Gee et al. (Reference Gee, Ladenberger, Dahlqvist, Majka, Be'eri-Shlevin, Frei, Thomsen, Corfu, Gasser and Chew2014); (19) Slama (Reference Slama2016); (20) Bream et al. (Reference Bream, Hatcher, Miller, Fullagar, Tollo, McLelland, Corriveau and Bartholomew2004); (21) Hofmann et al. (Reference Hofmann, Linnemann, Rai, Becker, Gärtner and Sagawe2011); (22) Yao et al. (Reference Yao, Shu, Santosh and Li2012); (23) Shu et al. (Reference Shu, Deng, Zhu, Ma and Xiao2011); (24) Boger et al. (Reference Boger, Carson, Wilson and Fanning2000); (25) Carson et al. (Reference Carson, Boger, Fanning, Wilson and Thost2000); (26) Corvino et al. (Reference Corvino, Boger, Wilson and Fitzsimons2005); (27) Corvino & Henjes-Kunst (Reference Corvino and Henjes-Kunst2007); (28) Corvino et al. (Reference Corvino, Boger, Henjes-Kunst, Wilson and Fitzsimons2008); (29) Halpin et al. (Reference Halpin, Daczko, Milan and Clarke2012); (30) Kelly, Clarke & Fanning (Reference Kelly, Clarke and Fanning2002); (31) Kelly, Clarke & Fanning (Reference Kelly, Clarke and Fanning2004); (32) Mikhalsky et al. (Reference Mikhalsky, Beliatsky, Sheraton and Roland2006).

4. Results
4.a. MDS and clustering results and validation
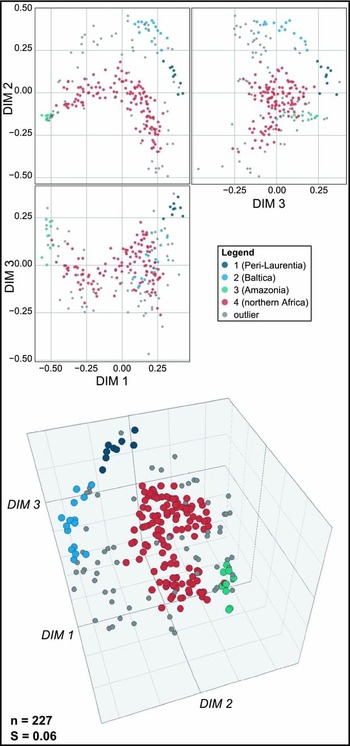
The MDS of pre-Variscan metasedimentary rocks shows several groups with slightly scattered samples (Fig. 4). HDBSCAN is then the most suited analysis tool for such a slightly noisy distribution of MDS data. Results of the density-based clustering are summarized in Table S5 and Figure S6 in the online Supplementary Material available at http://journals.cambridge.org. HDBSCAN detects four clusters and several outlier samples, i.e. samples with undeterminable provenance or exotic age spectra. The different groups are named according to the provenance of included reference samples (Fig. 4).
Non-metric multidimensional scaling of >400 Ma metasedimentary rocks (based on calculated Kolmogorov–Smirnov distances between zircon U–Pb age spectra, only zircon ages older than 700 Ma, 90–105 % concordance, minimum 30 ages). n – number of samples used for the statistics; S – stress factor. Colour coding refers to the HDBSCAN results. Minimum points within a cluster = 3. The large cluster ‘4’ (red), i.e. northern Africa/Arabia, is additionally hierarchically clustered in Figure 5. For an interactive three-dimensional version see Figure S6 in the online Supplementary Material available at http://journals.cambridge.org.

The large cluster ‘4’ contains reference samples from northern Africa. Although the cluster contains reference samples from three different regions (West African Craton, Sahara Metacraton and Arabian–Nubian Shield cover sequences), the high density of the clusters indicates a transition among the age spectra of the Peri-Gondwanan shelf sediments. This may be due to mixing of source fingerprints in the age spectra because of sediment mixing or recycling processes during source-to-sink transport.
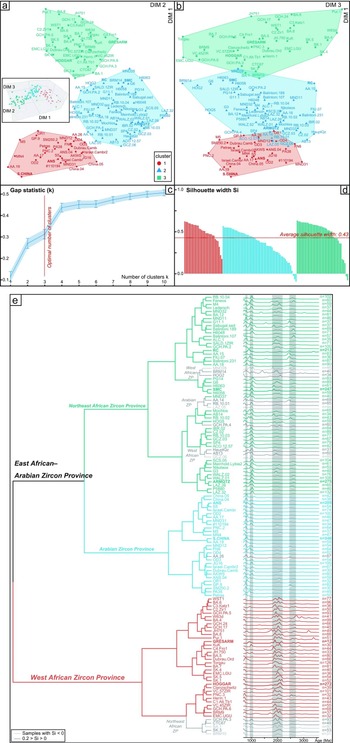
To cluster the high-density data, agglomerative hierarchical clustering was applied to the northern African group (Fig. 5). The number of clusters is estimated using the gap statistics, yielding discrimination of the northern African group into three clusters (Fig. 5c). The clusters are correlated with reference samples covering the West African Craton, Sahara Metacraton and the Arabian–Nubian Shield. Finally, the clustering result is validated and optimized using the silhouette width (Fig. 5d). The average silhouette width of 0.43 points to an appropriate clustering result. Branches of the dendrogram with low or negative silhouette widths are lastly assigned to the corresponding cluster group of the proposed neighbour (Fig. 5e). Results of the hierarchical clustering are summarized in Table S7 and displayed in Figure S8 in the online Supplementary Material available at http://journals.cambridge.org.
(a–b) Non-metric multidimensional scaling and hierarchical clustering of the ‘northern Africa’ cluster (Fig. 4). Inset displays the three-dimensional MDS (see Fig. S8 in the online Supplementary Material available at http://journals.cambridge.org). (c) Determination of the optimal number of clusters via gap statistics. (d) Validation of the clustering results based on cluster silhouette plots. The average silhouette Si = 0.44 indicates an ‘appropriate’ clustering (according to Rousseeuw, Reference Rousseeuw1987). Low or negative Si values indicate poor clustering or false cluster assignment (see Table S7 in the online Supplementary Material available at http://journals.cambridge.org). (e) Dendrogram of the hierarchical clustering and kernel density estimates of each sample with a bandwidth of 30 Ma, Epanechnikov kernel. n refers to the number of concordant zircon grains. Samples with low Si values are displayed with grey dotted lines. Samples in bold refer to the compiled reference samples (Fig. 3).

The cluster-coupled MDS gives clusters containing discrete reference samples. Hence, the unsupervised statistical approach allows the identification of the end-member detrital composition of the pre-Variscan sedimentary rocks. The statistical robustness of such a solution is evaluated by the excess scatter of the non-metric MDS output. The goodness-of-fit measure of a non-metric MDS is given by normalizing the raw stress to the sum of the squared fitted distances (Kruskal, Reference Kruskal1964; Kruskal & Wish, Reference Kruskal and Wish1978). The resulting stress value (S value) depends on the sample size of the input dataset and the dimensionality of the MDS configuration. The higher the sample size, the higher the probability of including different clusters of age distributions and/or erroneous data and, thus, the higher the scatter of the MDS configuration. A large sample size and the likely inclusion of age spectra that contain undetected age populations due to insufficiently dated grains, however, characterize the stress factor as representing a noise-value rather than a goodness-of-fit value (Borg & Groenen, Reference Borg and Groenen2005). Our MDS solution gives a final stress value of S = 0.06 that qualifies the configuration as being ‘fair’ according to Kruskal (Reference Kruskal1964). However, regarding the large input sample size of our dataset (n = 227), a value of 0.06 indicates a very robust statistical solution. The statistical analysis of the detrital zircon ages distinguishes four zircon provinces containing significantly different age spectra: (i) Laurussian (with Baltica and Laurentia), (ii) Avalonian, (iii) West African and (iv) East African–Arabian age spectra (Fig. S9 in the online Supplementary Material available at http://journals.cambridge.org).
4.b. Laurussian Zircon Province
The MDS configuration of Laurussian age spectra displays a continuous elliptic group of two clusters containing Baltica- (HDBSCAN cluster ‘2’) and Laurentia-derived samples (‘1’, Fig. 4). The age spectra of samples from the ‘Laurussian Zircon Province’ are characterized by Meso- to Palaeoproterozoic zircon crystals with major age peaks at 0.95 Ga (Sveconorwegian event), 1.05–1.15 Ga, 1.5–1.65 Ga (Fennoscandian) and 1.8 Ga (Svecofennian) and minor Neoarchaean populations.
4.c. Avalonian Zircon Province
The MDS configuration of Avalonian age spectra comprises cluster ‘3’ and surrounding outlier samples (Fig. 4) from NW Svalbard, the Avalonian Terranes of the Appalachians (Ganderia, West Avalonia and Meguma), the British Isles, the Rhenish Massif, the Harz Mountains, the Moravo-Silesian Zone, the Serbo-Macedonian Massif, Pelagonia, the Istanbul Zone, the Mauretanides and northern Morocco. The age patterns of Avalonia are characterized by containing predominantly Mesoproterozoic zircon populations with dominant 1.2 Ga (Sunsás event), ~1.5 Ga and 2.1–2.2 Ga peaks (Fig. 3) corresponding to an Amazonian signature (Matteini et al. Reference Matteini, Dantas, Pimentel, de Alvarenga and Dardenne2012; Horbe et al. Reference Horbe, Motta, de Almeida, Dantas and Vieira2013). Significant signatures of the West African cover sequences (Fig. 3) in areas of generally Amazonian predominance (Meguma, North Wales and northern Morocco) indicate deposition at the distal parts of Avalonia (Waldron et al. Reference Waldron, Schofield, White and Barr2011).
The mixing line between Amazonian and Laurussian provenances in the MDS configuration (Fig. S9 in the online Supplementary Material available at http://journals.cambridge.org) points to sediment recycling processes. Laurussian affinities of the Upper Silurian – Lower Devonian samples (Svalbard and Rheno-Hercynian Zone) are related to the proximity of Laurussia after the closure of the Iapetus Ocean (Pettersson, Pease & Frei, Reference Pettersson, Pease and Frei2010; Zeh & Gerdes, Reference Zeh and Gerdes2010), whereas Amazonian ages in Silurian and younger sedimentary rocks point to the recycling of the underlying sedimentary rocks.
4.d. West African Zircon Province
The ‘West African Zircon Province’ stems from the HDBSCAN cluster ‘3’ (Fig. 4) and the West African cluster of the hierarchical clustering (Fig. 5). The age spectra are characterized by the Eburnean (2.1 Ga) peak, and a 1.8–2.0 Ga peak, whereas ‘Grenvillian’ (1.0 Ga) zircons are absent. This age distribution corresponds to Precambrian–Lower Palaeozoic (meta-) sedimentary rocks covering the West African Craton in Morocco and Algeria (Abati et al. Reference Abati, Aghzer, Gerdes and Ennih2010; Linnemann et al. Reference Linnemann, Ouzegane, Drareni, Hofmann, Becker, Gärtner and Sagawe2011; Avigad et al. Reference Avigad, Gerdes, Morag and Bechstädt2012). The West African province comprises sedimentary rocks from the Saxo-Thuringian Zone in the Bohemian Massif and the Sudetes, the Teplá-Barrandian Unit, the Moldanubian Zone, the northern and central parts of the Armorican Massif, the NW French Massif Central, as well as the allochthonous units of the Galicia–Trás-os-Montes Zone and the Ossa-Morena Zone.
The gradual transition of the West African cluster towards the Amazonian cluster (reference samples from NE Brazil and the Damara orogen, Fig. S9 in the online Supplementary Material available at http://journals.cambridge.org), i.e. Amazonian zircons in parts of the West African group (allochthonous units of Galicia–Trás-os-Montes Zone and Ossa-Morena Zone), indicates sediment mixing of material derived from South America and western to central Africa on the Gondwanan shelf.
Because zircon age patterns of the samples assigned to the West African Zircon Province do not change during the entire Early Palaeozoic era, the zircon provenance of sediments remains constant during the investigated time range. There is, however, a temporary change to East African–Arabian age spectra in Upper Ordovician samples.
4.e. East African–Arabian Zircon Province
Zircon age spectra that are dominated by a 1.8–2.0 Ga peak, a subordinate Eburnean (2.1 Ga) peak, a modest 2.5–2.7 Ga peak, a significant ~1.0 Ga ‘Grenvillian’ peak and a ~800 Ma peak are assigned to the ‘East African–Arabian Zircon Province’ because of close similarities to sedimentary rocks from Egypt, Israel, Jordan and Iran (Fig. 5). The group comprises sedimentary rocks from the Central Iberian, Cantabrian and West Asturian–Leonese zones, the Pyrenees, Sardinia, Tuscany, Apulia, Sicily, the Southern Alps, the Austroalpine basement of the Alps (Heinrichs et al. Reference Heinrichs, Siegesmund, Frei, Drobe and Schulz2012), the Peloponnese, Crete and the Menderes Massif. Moreover, the province contains samples from South China, the Tarim Block, Madagascar and South Africa. Similarly to the West African Zircon Province, the age patterns of the sedimentary rocks assigned to the East African–Arabian Zircon Province do not change during the entire Early Palaeozoic era, pointing to a constant zircon provenance during the entire time span.
4.f. Exotic age spectra
Individual samples from Pelagonia (Zlatkin, Avigad & Gerdes, Reference Zlatkin, Avigad and Gerdes2014), the Brabant Massif (Linnemann et al. Reference Linnemann, Herbosch, Liégeois, Pin, Gärtner and Hofmann2012), the Moravo-Silesian Zone (Košler et al. Reference Košler, Konopásek, Sláma and Vrána2014) and the Sudetes (Mazur et al. Reference Mazur, Szczepański, Turniak and McNaughton2012) were not assigned to one of the zircon provinces. Although a sufficiently large number of zircon grains were dated, zircon ages characteristic for a particular province were missing. This may be due to recycling or sediment mixing with an unknown source during the source-to-sink transport. This process affects only four samples and, therefore, may be a rare phenomenon. Samples from other Gondwana areas (North China, basement of Lesser Himalaya, Madagascar, southern Africa and Congo) constitute isolated clusters with no affinities to any sample from the Variscan basement. It is worth noting that all different source reference samples plot in individual clusters that do not interfinger with clusters of a different source. This indicates that our statistical approach including a huge dataset and targeted filtering is able to identify provenance end-member populations for a composite crust.
5. Discussion
5.a. Evidence for a vast and contiguous Peri-Gondwanan shelf
As demonstrated above, the different zircon provinces can be used to subdivide the pre-orogenic crust of Peri-Gondwana into domains of contrasting provenance. Subsequently these domains were affected by collisional and extensional tectonic processes during the formation and destruction of Pangaea in the Palaeozoic and the Meso- to Cenozoic era, respectively. The extra-Alpine part of Central and Western Europe, i.e. the classic Variscides, preserves the Late Palaeozoic arrangement of these continental crustal domains, whereas the Peri-Gondwanan domains in the Mediterranean region additionally were affected by rifting processes related to the break-up of Pangaea and accretion processes due to later plate convergence between Africa–Arabia and Eurasia during the Alpine orogenic cycle. Although it is out of the scope of this paper to reconstruct the different continental blocks of the Mediterranean region in terms of a pre-break-up, i.e. Pangaea constellation, the dataset allows for testing assumptions about the principal arrangement of the Peri-Gondwanan crustal domains during the Palaeozoic era as well as the number of Palaeozoic oceans.
Our data analysis reveals that the majority of the Peri-Gondwanan crust stays connected with Gondwana until the Early Devonian epoch. Apart from the opening of the Rheic Ocean, which separates Avalonia from mainland Gondwana, there is no evidence for sea floor spreading inside Peri-Gondwana changing the provenance pattern of the sediments. Moreover, the sporadic mixture of West African zircon spectra with East African–Arabian spectra in the East African–Arabian Zircon Province dominated area (e.g. Franz et al. Reference Franz, Linnemann, Hofmann, Winkler and Ullrich2013; Rösel et al. Reference Rösel, Boger, Möller, Gaitzsch, Barth, Oalmann and Zack2014) or vice versa (e.g. Fernández-Suárez et al. Reference Fernández-Suárez, Gutiérrez-Alonso, Pastor-Galán, Hofmann, Murphy and Linnemann2014) indicates sediment exchange between parts of both provinces (as indicated by the mixing line between both end-members, Fig. 4), and thus, rather contradicts the existence of additional oceanic lithosphere.
5.b. The Avalonia Zircon Province north of the Rheic suture
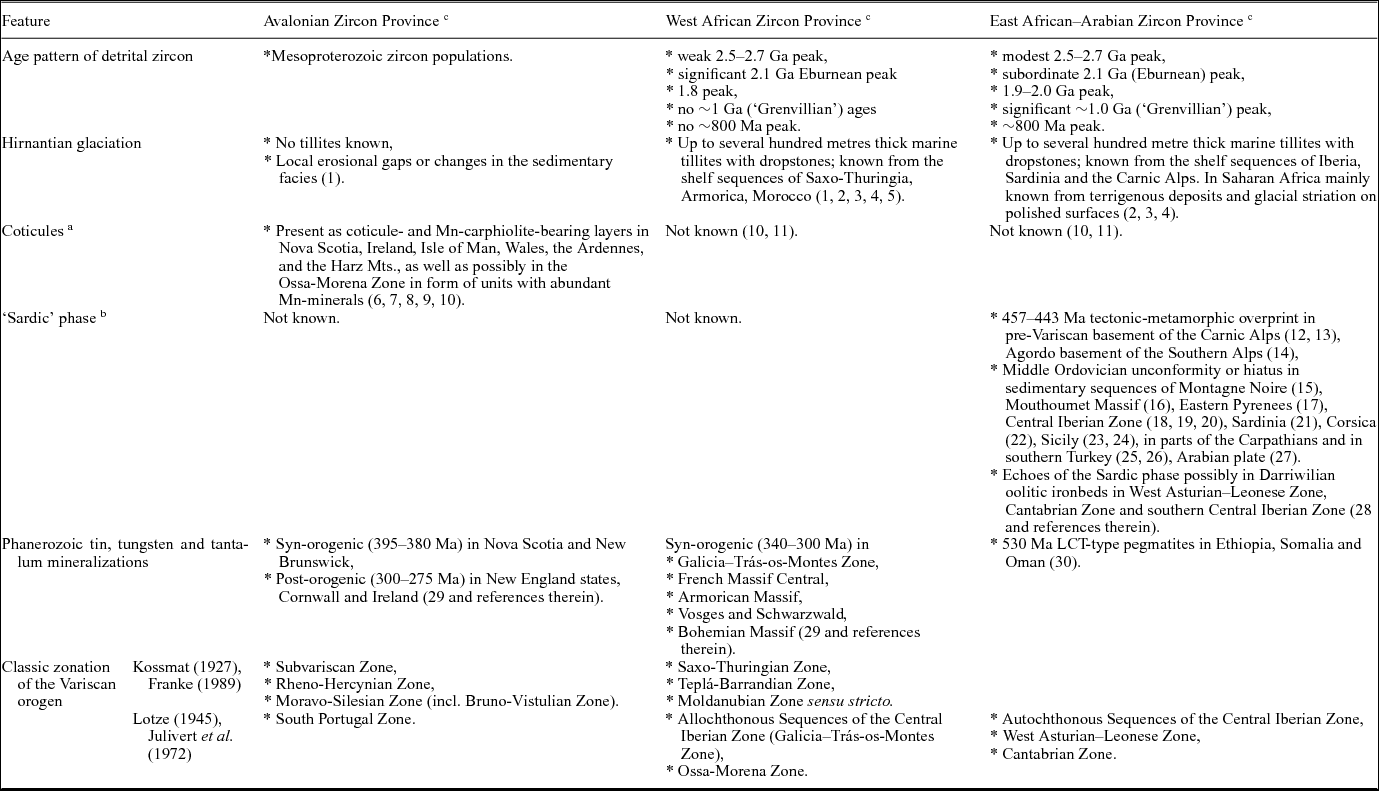
The dataset analysed here further corroborates existing views in terms of Avalonia as a contiguous terrane assembled to Laurussia in the Ordovician–Silurian period (e.g. Murphy et al. Reference Murphy, Strachan, Nance, Parker and Fowler2000; Oczlon, Seghedi & Carrigan, Reference Oczlon, Seghedi, Carrigan, Linneman, Nance, Kraft and Zulauf2007; Strachan et al. Reference Strachan, Collins, Buchan, Nance, Murphy and D'Lemos2007; Satkoski, Barr & Samson, Reference Satkoski, Barr and Samson2010; Ustaömer et al. Reference Ustaömer, Ustaömer, Gerdes and Zulauf2011; Barr et al. Reference Barr, Hamilton, Samson, Satkoski and White2012; Willner et al. Reference Willner, Barr, Gerdes, Massonne and White2013). Peri-Gondwanan crust ascribed to Avalonia (Fig. 2) is characterized by a significant change in the detrital zircon age spectra of Cambrian to Silurian sedimentary rocks, reflecting the change of source areas with the opening of the Rheic Ocean. Pre-Silurian rocks are dominated by detrital age spectra with an Amazonian signature (Fig. 1). The characteristic Baltica–Laurentia detritus in Silurian and younger sedimentary rocks reflects a Laurussian drainage system. Amazonian signatures in sedimentary rocks deposited at this time originate from the recycling of older sedimentary rocks. The Early Palaeozoic separation of Avalonia and related terranes from Gondwana is corroborated by palaeogeographic proxies such as the exclusive occurrence of Ordovician manganese-coticules and the absence of Hirnantian diamictites that are typical for Peri-Gondwanan crust to the south of the Rheic Ocean (Table 1; Fig. 6).
Provenance features of crustal blocks from the Acadian–Variscan orogenic belts of Europe

a Ordovician manganese-rich sedimentary rocks. bMiddle Ordovician. cReferences: (1) Le Heron et al. (Reference Le Heron, Ghienne, El Houicha, Khoukhi and Rubino2007); (2) Robardet & Doré (Reference Robardet and Doré1988); (3) Villas et al. (Reference Villas, Vennin, Álvaro, Hammann, Herrera and Piovano2002); (4) Monod et al. (Reference Monod, Kozlu, Ghienne, Dean, Günay, Hérissé, Paris and Robardet2003); (5) Linnemann et al. (Reference Linnemann, Romer, Gerdes, Jeffries, Drost, Ulrich, Linneman and Romer2010b); (6) Kramm (Reference Kramm1976); (7) Jimenez Millan & Velilla (Reference Jimenez Millan and Velilla1998); (8) Kennan & Morris (Reference Kennan, Morris, Woodcock, Quirk, Fitches and Barnes1999); (9) Waldron et al. (Reference Waldron, White, Barr, Simonetti and Heaman2009); (10) Romer, Kirsch & Kroner (Reference Romer, Kirsch and Kroner2011); (11) Dill et al. (Reference Dill, Sachsenhofer, Grecula, Sasvári, Palinkaš, Borojevic-Soštaric, Strmic-Palinkaš, Prochaska, Garuti, Zaccarini, Arbouille, Schulz and McCann2008); (12) Franz & Romer (Reference Franz and Romer2007); (13) Zurbriggen (Reference Zurbriggen2015); (14) Poli & Zanferrari (Reference Poli, Zanferrari, Carmignani and Sassi1992); (15) Robardet et al. (Reference Robardet, Verniers, Feist and Paris1994); (16) Javier Álvaro et al. (Reference Javier Álvaro, Colmenar, Monceret, Pouclet and Vizcaïno2016); (17) Gil Ibarguchi, Navidad & Ortega (Reference Gil Ibarguchi, Navidad and Ortega1990); (18) Lotze (Reference Lotze1956); (19) Gutiérrez-Marco, De San José & Pieren (Reference Gutiérrez-Marco, De San José, Pieren and Dallmeyer1990); (20) Valverde-Vaquero & Dunning (Reference Valverde-Vaquero and Dunning2000); (21) Carmignani et al. (Reference Carmignani, Franceschelli, Pertusati, Memmi and Ricci1982); (22) Rossi, Oggiano & Cocherie (Reference Rossi, Oggiano and Cocherie2009); (23) Trombetta et al. (Reference Trombetta, Cirrincione, Corfu, Mazzoleni and Pezzino2004); (24) Cocco & Funedda (Reference Cocco and Funedda2017); (25) Hammann (Reference Hammann1992); (26) Ghienne et al. (Reference Ghienne, Monod, Kozlu and Dean2010); (27) Sharland et al. (Reference Sharland, Archer, Casey, Davies, Hall, Heward, Horbury and Simmons2001); (28) Gutiérrez-Marco et al. (Reference Gutiérrez-Marco, Robardet, Rábano, Sarmiento, San José Lancha, Herranz, Pieren Pidal, Gibbons and Moreno2002); (29) Romer & Kroner (Reference Romer and Kroner2015); (30) Küster et al. (Reference Küster, Romer, Tolessa, Zerihun, Bheemalingeswara, Melcher and Oberthür2009).
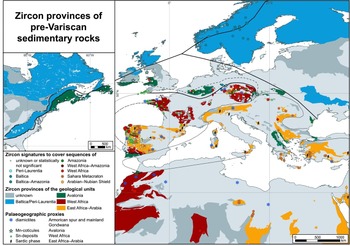
Spatial distribution of the pre-Variscan zircon provinces along the Variscan basement of Europe and North America.

The Meguma terrane contains an Amazonian signature (Fig. 3) with an Eburnean age population, i.e. West African zircons (Murphy et al. Reference Murphy, Fernández-Suárez, Keppie and Jeffries2004a; Waldron et al. Reference Waldron, Schofield, White and Barr2011). This far travelled West African detritus in the pre-rifting basement is explained by a mixing of Amazonian with West African zircons at the distal shelf position along the Avalonian Peri-Gondwanan shelf (Romer, Kirsch & Kroner, Reference Romer, Kirsch and Kroner2011).
The exotic position of Avalonian crust in the Mediterranean, i.e. Pelagonia (Hellenides) and the Serbo-Macedonian Massif (Meinhold et al. Reference Meinhold, Kostopoulos, Frei, Himmerkus and Reischmann2010; Zlatkin, Avigad & Gerdes, Reference Zlatkin, Avigad and Gerdes2014, Reference Morton and Hallsworth2017), is corroborated by our data analysis. Both units are sandwiched between crusts of predominantly East African–Arabian provenance. Whether the juxtaposition of these exotic units resulted from pre-Pangaean processes (Zlatkin, Avigad & Gerdes, Reference Zlatkin, Avigad and Gerdes2017) or is related to younger tectonics remains an open question and cannot be answered by detrital zircon provenance alone.
5.c. The Peri-Gondwanan shelf south of the Rheic Ocean
5.c.1. The East African–Arabian Zircon Province
The East African–Arabian Zircon Province contains sedimentary rocks from the eastern Gondwana mainland (East Africa, Arabia, Madagascar, South Africa, South China, see Fig. S9 in the online Supplementary Material available at http://journals.cambridge.org). Because the provenance of these samples is still unknown (Collins, Kinny & Razakamanana, Reference Collins, Kinny and Razakamanana2012; Yao et al. Reference Yao, Shu, Santosh and Li2012; Vorster et al. Reference Vorster, Kramers, Beukes and Van Niekerk2015) and detrital zircon age data alone cannot identify the distinct provenance, it is out of scope of this paper to clarify the provenance of the zircon provinces of the northern Peri-Gondwanan shelf. Nevertheless, the Peri-Gondwanan shelf sediments were probably fed by a complex, eastern Gondwana super-fan system with detritus probably from recycled orogens like the East African Orogen, the Rayner–Eastern Ghates Complex and the Irumide Belt (Squire et al. Reference Squire, Campbell, Allen and Wilson2006; Meinhold, Morton & Avigad, Reference Meinhold, Morton and Avigad2013; Rösel et al. Reference Rösel, Boger, Möller, Gaitzsch, Barth, Oalmann and Zack2014).
As revealed by our analysis, the East African–Arabian Zircon Province spans from Western Europe to the Middle East (Fig. 6). Zircon data indicating an East African–Arabian provenance previously were only used for regional reconstructions. For instance, relying on the detrital record of the Romanian Carpathians, Balintoni et al. (Reference Balintoni, Balica, Ducea, Chen, Hann and Şabliovschi2009) suggested for the ‘Romanian Carpathians Terrane’ a palaeogeographic position close to the Arabian–Nubian Shield. Palaeontological evidence, detrital U–Pb ages and isotopic signatures (Bea et al. Reference Bea, Montero, Talavera, Abu Anbar, Scarrow, Molina and Moreno2010; Díez Fernández et al. Reference Díez Fernández, Catalán, Gerdes, Abati, Arenas and Fernández-Suárez2010; Fernández-Suárez et al. Reference Fernández-Suárez, Gutiérrez-Alonso, Pastor-Galán, Hofmann, Murphy and Linnemann2014; Shaw et al. Reference Shaw, Gutiérrez-Alonso, Johnston and Pastor Galán2014; Orejana et al. Reference Orejana, Merino Martínez, Villaseca and Andersen2015; Henderson et al. Reference Henderson, Collins, Murphy, Gutierrez-Alonso and Hand2016) from the Central Iberian, West Asturian–Leonese and Cantabrian zones point to an initial position close to Egypt contradicting classic palaeogeographic models (e.g. Crowley et al. Reference Crowley, Floyd, Winchester, Franke and Holland2000; Robardet, Reference Robardet, Catalán, Hatcher, Arenas and García2002; Stampfli, von Raumer & Borel, Reference Stampfli, von Raumer, Borel, Catalán, Hatcher, Arenas and García2002; von Raumer, Stampfli & Bussy, Reference von Raumer, Stampfli and Bussy2003; Murphy et al. Reference Murphy, Pisarevsky, Nance and Keppie2004b; Cocks & Torsvik, Reference Cocks, Torsvik, Gee and Stephenson2006; Franke, Cocks & Torsvik, Reference Franke, Cocks and Torsvik2017) that all assume a West African provenance (Fig. 1) for this part of Iberia.
Recognizing the vast spatial distribution of this type of Peri-Gondwanan crust, Dörr et al. (Reference Dörr, Zulauf, Gerdes, Lahaye and Kowalczyk2015) combined different domains, including North Iberia, Sardinia, Apulia, the Hellenides and Pontides and referred to them as the ‘Minoan Terrane Assemblage’. As visualized in Figure 6, the spatial distribution of the East African–Arabian provenance actually is even larger and reaches at least as far to the east as Iran (Moghadam et al. Reference Moghadam, Li, Griffin, Stern, Thomsen, Meinhold, Aharipour and O'Reilly2017), possibly as far as Tarim and South China. Our data analysis (Fig. 5) reveals that the zircon spectra of Tarim and South China also have close similarities to terranes of the East African–Arabian provenance, which implies that this zircon province encompasses a huge segment of contiguous Peri-Gondwana with comparable provenance. The extent of the East African–Arabian Zircon Province to the east is not well constrained, whereas to the west, i.e. in Western Europe, it is sharply defined, especially in Iberia (see Fig. 6).
5.c.2. The West African Zircon Province
The largest part of the internal zone of the Variscides of Europe and northern Africa sensu stricto belongs to the West African Zircon Province. Here, the tectono-metamorphic record indicates initial collision between Laurussia and Peri-Gondwana in Lower Devonian rocks at 400 Ma (e.g. Kreuzer et al. Reference Kreuzer, Seidel, Schüssler, Okrusch, Lenz and Raschka1989; Schaltegger et al. Reference Schaltegger, Schneider, Maurin and Corfu1996; Lardeaux et al. Reference Lardeaux, Ledru, Daniel and Duchene2001; Nutman et al. Reference Nutman, Green, Cook, Styles and Holdsworth2001; Ordóñez Casado et al. Reference Ordóñez Casado, Gebauer, Schäfer, Gil Ibarguchi and Peucat2001; Lucks et al. Reference Lucks, Schulz, Audren, Triboulet, Catalán, Hatcher, Arenas and García2002; Kryza & Fanning, Reference Kryza and Fanning2007; Bröcker et al. Reference Bröcker, Klemd, Cosca, Brock, Larionov and Rodionov2009; Berger et al. Reference Berger, Féménias, Ohnenstetter, Bruguier, Plissart, Mercier and Demaiffe2010), whereas continental crust of the East African–Arabian Zircon Province is not affected by collisional tectonics before the Carboniferous period, i.e. c. 50 Ma later (Dallmeyer et al. Reference Dallmeyer, Catalán, Arenas, Gil Ibarguchi, Gutiérrez, Alonso, Farias, Bastida and Aller1997; Giacomini, Bomparola & Ghezzo, Reference Giacomini, Bomparola and Ghezzo2005; Rubatto et al. Reference Rubatto, Ferrando, Compagnoni and Lombardo2010; Langone et al. Reference Langone, Braga, Massonne and Tiepolo2011; Martínez Catalán et al. Reference Martínez Catalán, Rubio Pascual, Montes, Fernández, Barreiro, Dias Da Silva, Clavijo, Ayarza, Alcock, Turner, Healy, Hillis and Welch2014). Hence, the West African Zircon Province can be regarded as the leading edge of Peri-Gondwana, i.e. the Armorican Spur (Kroner & Romer, Reference Kroner and Romer2013), during the collision of Gondwana and Laurussia.
In terms of the pre-orogenic sedimentary record, Lower Palaeozoic sequences of the West African Zircon Province carry the chemical signal of intense chemical weathering on a stable continent, i.e. decomposition of feldspar with pronounced loss of those feldspar-bound elements (Ca, Na, Sr, Pb) that are not incorporated in or adsorbed on clay minerals. Sedimentary accumulation of this debris on the extended Peri-Gondwanan shelf as a result of break-up and uplift was followed by tectonic stacking during the Variscan collision and subsequent melting, eventually resulting in the formation of major tin–tungsten deposits within the Variscides (Romer & Kroner, Reference Romer and Kroner2015, Reference Romer and Kroner2016). The lack of notable tin deposits in terranes of the East African–Arabian Zircon Province underlines the significant differences in terms of provenance between the West African Zircon Province and the East African–Arabian Zircon Province (Table 1; Fig. 6).
As revealed by our study, the West African Zircon Province contains detrital age spectra that resemble sedimentary rocks from Morocco, the Hoggar Shield, the Damara orogen and from NE Brazil. Because of the contrasting detrital age spectra, the shelf areas belonging to the West African and East African–Arabian zircon provinces cannot be supplied by a common Gondwana super-fan system. We propose that the northern Peri-Gondwanan shelf was fed by at least two independent fan systems, namely the ‘West Gondwana super-fan system’ and the ‘East Gondwana super-fan system’.
5.d. The Early Palaeozoic palaeogeography of Iberia
Because of lithological and palaeontological similarities between the Lower Palaeozoic strata of Central Iberia and Armorica (Brittany), most palaeogeographic reconstructions of the pre-Variscan Gondwanan architecture place Iberia adjacent to Armorica. For instance, lithostratigraphic arguments led to the classic correlation of autochthonous Lower Ordovician quartzites of the ‘Grès Armoricain Formation’ and the ‘Armorican Quartzite Formation’ of Brittany and Central Iberia, respectively. This correlation served as a strong argument for spatial closeness in the Early Palaeozoic era. Palaeomagnetic studies are not able to prove this hypothesis since reliable data are lacking due to large gaps in the geological record of Iberia and the Armorican Massif (Perroud & Bonhommet, Reference Perroud and Bonhommet1984; Perroud, Calza & Khattach, Reference Perroud, Calza and Khattach1991; Tait et al. Reference Tait, Bachtadse, Franke and Soffel1997; Franke, Cocks & Torsvik, Reference Franke, Cocks and Torsvik2017).
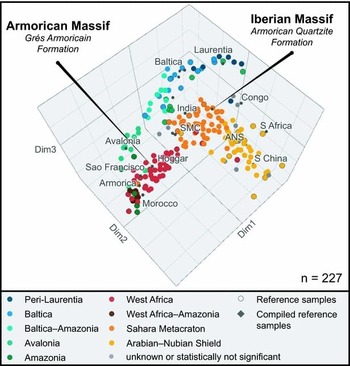
Our statistical evaluation yields significantly different zircon spectra for Iberia and the Armorican Massif, especially for the Armorican Quartzite and the Grès Armoricain formations (Fig. 7). A different palaeogeographic position is additionally corroborated by the East African faunal affinities of Central Iberia in contrast to the West African affinities of Brittany (e.g. Mélou, Oulebsir & Paris, Reference Mélou, Oulebsir and Paris1999; Gutiérrez-Marco et al. Reference Gutiérrez-Marco, Robardet, Rábano, Sarmiento, San José Lancha, Herranz, Pieren Pidal, Gibbons and Moreno2002; Robardet & Gutiérrez-Marco, Reference Robardet, Gutiérrez-Marco, Gibbons and Moreno2002). Hence, in terms of sediment supply, the coeval depositional areas are unrelated and there may be a large distance between Armorica and Central Iberia before rifting of Peri-Gondwana started.
Three-dimensional output of non-metrical MDS and final discrimination of the pre-Variscan samples into the palaeogeographic groups. Note the significantly different age spectra of the Lower Ordovician French ‘Grès Armoricain Formation’ and the Iberian ‘Armorican Quartzite Formation’. Figure S9 in the online Supplementary Material available at http://journals.cambridge.org is interactive and provides additional information about each data point when hovering over it with the mouse cursor.

In terms of deformation and metamorphic ages, the Armorican Massif and Central Iberia were differently affected by the Variscan orogeny. The Armorican Massif was affected by the early Variscan tectono-metamorphic event in the Early Devonian epoch (Ballèvre et al. Reference Ballèvre, Marchand, Godard, Goujou, Christian, Wyns, Chantraine, Rolet, Santallier, Piqué and Keppie1994; Rolet et al. Reference Rolet, Gresselin, Jegouzo, Ledru, Wyns, Chantraine, Rolet, Santallier, Piqué and Keppie1994; Kroner & Romer, Reference Kroner and Romer2013), whereas Central Iberia remained in a stable shelf position with undisturbed marine sedimentation at this time (Garcia-Alcalde et al. Reference Garcia-Alcalde, Carls, Alonso, López, Soto, Truyols-Massoni, Valenzuela-Rios, Gibbons and Moreno2002). Thus, the regions of the West African Zircon Province should be located close to West Africa, whereas Central Iberia and other regions of the East African–Arabian Zircon Province may have been positioned on the Peri-Gondwanan shelf further east, i.e. adjacent to the Sahara Metacraton and the Arabian–Nubian Shield (see also discussion in Meinhold, Morton & Avigad, Reference Meinhold, Morton and Avigad2013). The resulting late Variscan westward-directed lateral escape of Iberia is in many models not considered (e.g. Matte, Reference Matte2001; Franke, Cocks & Torsvik, Reference Franke, Cocks and Torsvik2017) or underestimated (Kroner & Romer, Reference Kroner and Romer2013).
5.e. Palaeogeographic models
The provenance pattern of the Variscan orogen and its palaeogeographic implications are not regarded in any tectonic model. The crucial point is the pre-orogenic position of Iberia. Instead of an East African–Arabian provenance, Iberia is commonly believed to have a West African provenance and, thus, is located close to the West African Craton in many models (Matte, Reference Matte2001; Kroner & Romer, Reference Kroner and Romer2013; Franke, Cocks & Torsvik, Reference Franke, Cocks and Torsvik2017; Fig. 2).
Stampfli et al. (Reference Stampfli, Hochard, Vérard, Wilhem and von Raumer2013) considered an eastern position of Central Iberia, which is supported by palaeontological data (e.g. Mélou, Oulebsir & Paris, Reference Mélou, Oulebsir and Paris1999; Gutiérrez-Marco et al. Reference Gutiérrez-Marco, Robardet, Rábano, Sarmiento, San José Lancha, Herranz, Pieren Pidal, Gibbons and Moreno2002; Robardet & Gutiérrez-Marco, Reference Robardet, Gutiérrez-Marco, Gibbons and Moreno2002) and in line with our provenance analysis that indicates that Iberia is part of the East African–Arabian Zircon Province (Fig. 1d). Stampfli et al. (Reference Stampfli, Hochard, Vérard, Wilhem and von Raumer2013) placed Iberia with the Moldanubian Zone and the French Massif Central in the eastern part of the proposed Galatian Superterrane, even though the latter two regions show a completely different provenance, i.e. the West African Zircon Province. Moreover, the classic Avalonian terranes of the Northern Appalachians, in particular Meguma and Brunswick, and parts of Far East Avalonia, i.e. Dobrogea, Moesia and the Istanbul Zone are also interpreted as integral parts of the Galatian Superterrane that supposedly did not detach from Gondwana before the Devonian period (Fig. 1d). This palaeogeographic reconstruction, however, is in conflict with the palaeontological and sedimentary record (Boyce, Ash & O'Brien, Reference Boyce, Ash and O'Brien1991; Williams, Reference Williams1993; Dean et al. Reference Dean, Monod, Rickards, Demir and Bultynck2000; Chen et al. Reference Chen, Siebel, Satir, Terzioğlu and Saka2002; Oczlon, Seghedi & Carrigan, Reference Oczlon, Seghedi, Carrigan, Linneman, Nance, Kraft and Zulauf2007; Pollock, Hibbard & van Staal, Reference Pollock, Hibbard and van Staal2011) and provenance data (this study) of these areas showing Avalonian and Laurussian affinities since the Silurian period. Hence, the Galatian Superterrane represents an unconstrained assemblage of Peri-Gondwanan crust with apparently randomly juxtaposed domains of the Avalonian, West African and East African–Arabian zircon provinces. Such a zircon provenance pattern would imply that the transport agents (e.g. rivers) would cross.
6. Conclusions
Multidimensional scaling coupled with density-based clustering allows the identification of provenance end-member populations of the composite Variscan crust. The resulting pre-orogenic palaeogeographic constraints should be considered in future plate tectonic models:
The discrimination of the pre-Pangaean continental crust into four principal zircon provinces, namely the Laurussian, the Avalonian, the West African and the East African–Arabian zircon provinces, and their spatial distribution provide fundamental constraints that are tested against published tectonic models, litho-biostratigraphic correlations among different terranes and palaeogeographic reconstructions of Peri-Gondwana:
(i) The Avalonian Zircon Province constitutes the contiguous Avalonian part of the Peri-Gondwanan shelf that has received sediments derived from the Amazonas Craton, and, after the separation from Gondwana, sediments derived from Laurussia.
(ii) The East African–Arabian Zircon Province characterizes the large contiguous Peri-Gondwanan shelf from Central Iberia to Tarim and has received detritus via the eastern Gondwana super-fan system.
(iii) The West African Zircon Province constitutes part of the shelf adjacent to the West African Craton and the ultimate leading edge of Gondwana during the collision with Laurussia, i.e. the Armorican Spur. The detritus was shed by the western Gondwana super-fan system.
(iv) The collision of the Armorican Spur is followed by the westward indention of the Iberian promontory by late Variscan lateral escape movements. This juxtaposes sedimentary rocks of the West African Zircon Province (Armorican Spur) with sedimentary rocks of the East African–Arabian Zircon Province (Iberia).
(v) The zonation of the zircon provinces overlaps with domain-specific features that provide additional palaeogeographic proxies, namely manganese-coticules representative for the Avalonian Zircon Province, the Sardic tectono-metamorphic event for the East African–Arabian Zircon Province and tin–tungsten deposits for the West African Zircon Province.
(vi) The statistical analysis of the detrital zircon ages provides no evidence for the existence of any additional oceans to the south of the Rheic Ocean, separating the zircon provinces of the Peri-Gondwanan crust from each other or from the Gondwana mainland. The pre-Pangaean architecture of the Peri-Gondwanan crust is explained by an extended but contiguous Gondwanan shelf. Nevertheless, the Sardic tectono-metamorphic event at the western edge of the East African–Arabian Zircon Province indicates intracontinental tectonics probably related to plate tectonic reorganization due to the ongoing formation of Pangaea.
Acknowledgements
We are grateful to Sonja Frölich and Judy Adamek (Technische Universität Bergakademie Freiberg) for their help to collect the data. Pieter Vermeesch (UCL) is thanked for methodological advice and implementation of very helpful tools in the R's package ‘provenance’ (Vermeesch, Resentini & Garzanti, Reference Vermeesch, Resentini and Garzanti2016). We acknowledge Guido Meinhold for editorial handling. This research was supported by the BMBF r4 project ‘GEM’ (grant number: 033R134).
Supplementary material
To view supplementary material for this article, please visit https://doi.org/10.1017/S0016756818000031