I. INTRODUCTION
Nonoriented Si–Fe steel is the key material for carrying magnetic flux in electric motors.Reference Oda, Kohno and Honda1 To produce a high efficiency electric motor, magnetic properties of the NOES have been widely studied, and found to be closely related to the steel chemistry, microstructure, and texture.Reference Kestens, Jonas, Van Houtte and Aernoudt2–Reference Shimanaka, Ito, Matsumura and Fukuda4 For further improving the motor efficiency, the importance of determining the residual stress field induced by manufacturing processes, such as stamping, welding, and coating processes, has been recognized.Reference Chivavibul, Enoki, Konda, Inada, Tomizawa and Toda5–Reference Rygal, Moses, Derebasi, Schneider and Schoppa7
Electrical steels are typically used as thin laminations, each with an insulating coating, for better magnetic properties, environmental resistance, heat resistance, and lower core loss in the final product.Reference Lindenmo, Coombs and Snell8 The insulating coating, applied to isolate each lamination electrically and reduce eddy current losses, is commonly made from a mixture of organic and inorganic compounds.Reference Lindenmo, Coombs and Snell8 The application of the coating induces a nonuniform stress state in both the coating and the steel substrate.Reference Zhu, Xie, Hu, Chen and Zhang9 The residual stress can be a result of not only temperature and humidity variations,Reference Perera10 but also a misfit strain at the coating/steel interface.Reference Zhang, Xu, Wang, Wu and Jiang11
Stress in electrical steels is typically determined by the following methods: x-ray diffraction (XRD), magnetic Barkhausen noise, strip bending theory, and indentation. A few studies on the residual stress of the coating and the steel substrate have been carried out in the past.Reference Zhang, Xu, Wang and Wu12,Reference Tsui and Clyne13 More specifically for electrical steels, the stress induced by the coating process was mostly studied in grain oriented electrical steel (GOES) laminates.Reference Beyer, Lahn, Schepers and Stucky6,Reference Fukuda, Satoh, Ichida, Itoh and Shimanaka14,Reference Washko and Choby15 Within the steel substrate, an average uniaxial tensile stress, ranging from 20 to 150 MPa, was estimated from strip bending theory.Reference Beyer, Lahn, Schepers and Stucky6 The presence of the tensile stress was found to be associated with improved core loss of the coated GOES.Reference Beyer, Lahn, Schepers and Stucky6 A similar beneficial effect from the presence of residual stress induced by coating was observed in NOES.Reference Chivavibul, Enoki, Konda, Inada, Tomizawa and Toda5 A directional core loss improvement was found, which was suggested to be related to a biaxial stress state.Reference Chivavibul, Enoki, Konda, Inada, Tomizawa and Toda5 Unfortunately, no quantitative measurements were carried out in this study about the stress magnitude. The studies on the effect of residual stress on core loss and stress estimation from strip bending theory only provide general understanding of the stress state at macroscale level. There is still a stress field at the microscale level that has not yet been explored well, especially in NOES. Nanoindentation has been applied to stress measurement due to surface modificationReference Frutos, Multigner and Gonzalez-Carrasco16 and thermal spray coating processReference Zhu, Xie, Hu, Chen and Zhang9 in stainless steel. Different from stress measurement by XRD, where accuracy is influenced by instrument setup, material grain size, and strain gradient of the target field,Reference He17,Reference Luo and Jones18 nanoindentation has been successfully applied to obtain microstress information, including the stress affected zone and localized stress magnitude, with a lateral resolution as fine as 20 µm.
Nanoindentation has been developed and widely used in materials science for determining mechanical properties at the microscale level.Reference Oliver and Pharr19–Reference Lee, Kim, Lee, Kim, Koo and Kwon21 Hardness (H) and reduced modulus (E r) values for a sample can be determined using the Oliver and Pharr (O&P) method.Reference Oliver and Pharr19 Hardness has been shown to change as a function of the residual stress level, whereby it is increased by compression and reduced by tension.Reference Suresh and Giannakopoulos22 This relationship was first observed in nanoindentation experimentsReference Tsui, Oliver and Pharr23 and later verified by a numerical studyReference Bolshakov, Oliver and Pharr24 on aluminum alloys. To calculate the stress level, one of the three main approachesReference Suresh and Giannakopoulos22,Reference Carlsson and Larsson25–Reference Swadener, Taljat and Pharr27 developed is Suresh and Giannakopoulos (SG) method.Reference Suresh and Giannakopoulos22 From the literature, it has been successfully applied to the stress measurements of plasma-spray coated stainless steelReference Zhu, Xie, Hu, Chen and Zhang9 and evaluation of an equibiaxial stress in thin carbon film.Reference Taylor, Wayne and Chiu28 To estimate the stress value using this approach, either previous material properties or presence of a reference are required to be known.
Another approach of confirming the presence of residual stress is through variations in magnetic domain structure. This magnetic domain structure change as a result of the stress introduced by the coating has been characterized mainly in GOES,Reference Fukuda, Satoh, Ichida, Itoh and Shimanaka14,Reference Washko and Choby15,Reference Chukwuchekwa, Moses and Anderson29 and only limited number of studies are available on NOES.Reference Senda, Fujita, Honda, Kuroki and Yagi30 From these studies, a common feature was observed. The application of tensile stress resulted in a redistribution and increase in the number of 180° domain walls along the stress direction. If present, supplementary domain structures (the small domain features oriented in a different direction to the primary magnetization) were also decreased or eliminated under tension. This variation in magnetic domain structure can be directly observed using a scanning electron microscope (SEM).Reference Hubert and Schafer31,Reference Newbury, Joy, Echlin, Fiori and Goldstein32
In this study, two types of commercial NOES were studied, and the residual stress induced by the coating process was investigated along different cross sections using both nanoindentation and SEM. The nature and magnitude of the stress were first calculated based on the hardness changes according to the SG method. Additionally, the presence of stress was then further confirmed by domain structure variations from direct magnetic domain imaging.
II. MATERIALS AND METHODS
A. Sample preparation
Two types of commercially available low carbon, 2.8% Si nonoriented electrical steels with a thickness of ∼300 µm were investigated, in the fully-processed, i.e., stress relief annealed (SRA), and semi-processed (non-SRA) conditions. Small pieces (10 × 6 mm) were cut from long NOES strips using a slow speed diamond blade. The as-received strips were mounted in a rigid wax before cutting to provide mechanical support. After cutting, the small samples went through one of the three following procedures.
Procedure 1: NOES with coating intact
The samples were kept at the as-received state after cutting.
Procedure 2: NOES with coating removed
After cutting, coating from some non-SRA samples was carefully removed by 1 µm diamond suspension until it just disappeared. The progress of coating removal was monitored by color variation, from brown (coating) to brown/silver (steel). Hence, a minimum amount of the steel layer was removed.
Procedure 3: Vacuum-annealed NOES without coating
Coating was completely removed from pieces of non-SRA samples by mechanical grinding on 600 grit papers. The non-SRA samples without coating were then laboratory annealed in vacuum at 800 °C for 24 h followed by 10 h of slow cooling in a furnace.
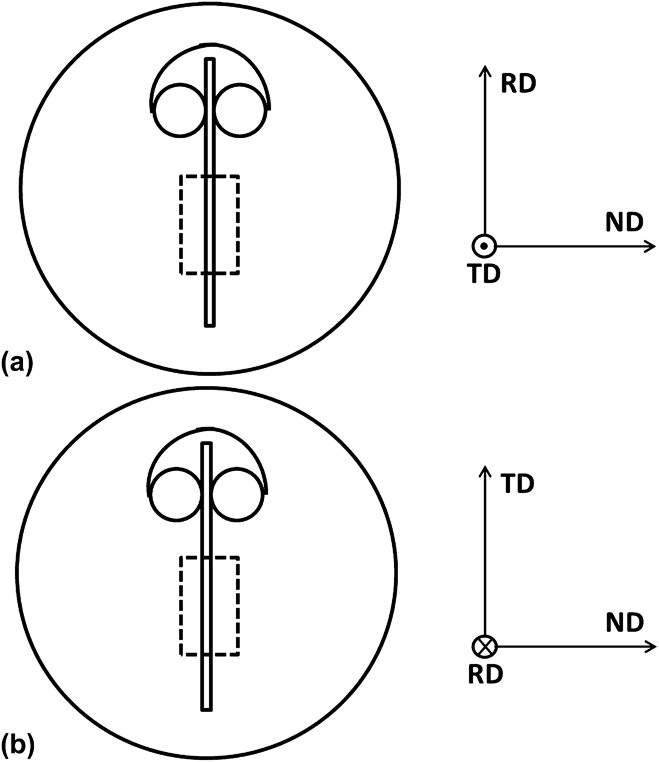
All types of specimens with and without coating were mounted in epoxy resin at room temperature with conductive fillers added, as shown schematically in Fig. 1. The cross sections along the rolling direction (RD) and the transverse direction (TD) were investigated in this work. The mounted specimens were then mechanically ground on 600 grit papers for 20 min to remove the damaged layer due to cutting. The exposed cross sections of the strips were then further prepared by mechanically grinding up to 1200 grit papers and 24 h vibratory polishing with 0.05 µm colloidal silica. The same procedure was followed for preparing samples for both scanning electron microscopy and nanoindentation.
Schematics of the mounted cross sections along (a) RD and (b) TD, where ND represents sample normal direction. The specimens were supported by plastic clips, and the areas enclosed by the dashed line were investigated.

B. Imaging and microanalysis by electron microscopy
A Hitachi SU-70 (Hitachi High-Technologies, Rexdale, ON, Canada) field-emission scanning electron microscope (FESEM) equipped with a Bruker Quantax 400 silicon drift detector (Bruker Canada, Milton, ON, Canada) as an energy dispersive spectrometer (EDS) was used to characterize the composition of the coating. The coating secondary electron (SE) and backscattered electron (BSE) micrographs were recorded at an accelerating voltage of 5 kV with a conventional Everhart-Thornley detector and a photodiode backscatter electron detector, respectively. X-ray microanalysis points were acquired at an accelerating voltage of 15 kV and the quantitative results were obtained using the standardless PhiRhoZ quantification mode from Bruker.
Grain orientations were determined by electron backscattered diffraction (EBSD) at 70° specimen tilt and an acceleration voltage of 20 kV with a Nordlys EBSD camera (Oxford Instruments, U.K.) with four forescatter detector (FSD) diodes. The collected signals were analyzed using HKL Channel 5 software. At the same sample position, magnetic domains were imaged using the bottom two FSD diodes at an acceleration voltage of 30 kV and a high probe current (∼10 nA), as described elsewhere.Reference Gallaugher, Chromik, Brodusch and Gauvin33 Both EBSD and magnetic domain imaging were carried out under the “field free” mode of the SEM.
C. Nanoindentation
Nanoindentation was carried out on the NOES specimens using a TriboIndenter (Hysitron, Minneapolis, MN), equipped with a three-sided pyramid Berkovich diamond tip. Before indenting on the NOES specimen, the tip area was calibrated by indenting on fused quartz. Indentations using a peak load of 5 mN (reaching a maximum penetration depth of ∼200 nm) and a loading rate of 1 mN/s were performed in an array of lines of increasing distance from the coating. A 20 µm distance was kept among individual indents, and the lateral size for the residual indentation imprint was ∼2 µm across. An example of the indentation sites is shown in a scanning electron microscopy micrograph in Fig. 2.
Secondary electron micrograph of nanoindentation imprints (a) performed at a region indicated by the red square in a schematic diagram (b), where positions of indenting array are represented by black dots.
Both hardness (H) and reduced modulus (E r) from each individual position were calculated using Eqs. (1) and (2), where P max is the maximum loading force, A is the projected contact area, and S is the measured stiffness at the beginning of the unloading curve.Reference Fischer-Cripps34 The projected contact area (A) can be calculated from the contact depth (h c) according to the Oliver and Pharr method [Eq. (3)].Reference Oliver and Pharr19
 $$H = {{P_{\max } } \over A}\quad ,$$
 $$E_{\rm{r}} = {S \over 2}{{\sqrt \pi } \over {\sqrt A }}\quad {\rm{,}}$$
 $$A = 24.5h_{\rm{c}}^2 + C_1 h_{\rm{c}}^1 + C_2 h_{\rm{c}}^{1/2}\quad.$$
For quantitative stress measurement, the nature of the stress was first determined by the direction of the shift of the nanoindentation loading curve with regard to a reference loading curve (obtained from a stress free material), followed by the stress magnitude calculation using the following two equations.Reference Suresh and Giannakopoulos22
 $${{A_0^\prime } \over {A^\prime }} = 1 - {\sigma \over {H_0 }}\left( {{\rm{Tensile}}\;{\rm{stress}}} \right)\quad {\rm{,}}$$
 $${{A_0^\prime } \over {A^\prime }} = 1 + {{\sigma \sin \alpha } \over {H_0 }}\left( {{\rm{Compressive}}\;{\rm{stress}}} \right)\quad {\rm{.}}$$
where A′ and A 0′ are the projected contact areas from stressed and stress-free (reference) materials, respectively, H 0 is the hardness from the reference material, σ is the residual stress level, and α is the attack angle between the indenter and the material surface. Typical load–displacement curves obtained from the reference and stressed regions are shown in Fig. 3. For hardness and modulus data, all curves were included in the analysis. For an estimate of the stress by the SG method, analysis was conducted at the maximum penetration depth on the loading curves, where only curves with small pop-in loads similar to the curves shown in Fig. 3 were used. Some curves that exhibited higher pop-in loads (not shown) were not included in the SG analysis.
Representative load–displacement curves obtained from reference and stressed regions of NOES by nanoindentation tests.
III. RESULTS AND DISCUSSION
A. NOES substrate characterization
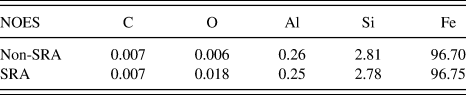
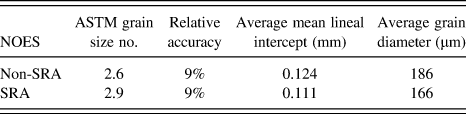
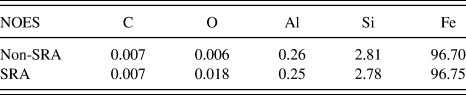
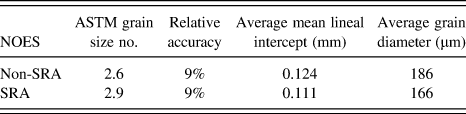
The chemistry of both the non-SRA and SRA samples was obtained according to ASTM standards E1479 and E1019. Both samples were found to contain similar compositions (Table I). The sample grain size was measured according to the ASTM E112-10 standard using the Heyn lineal intercept procedure, where the number of intercepts from six drawn lines was counted. A measured average grain diameter of 186 µm for the non-SRA NOES was slightly larger than that of the SRA steel, which was 166 µm. Relative accuracies of 9% were obtained for both measurements (Table II).
Chemical compositions of non-SRA and SRA samples (wt%).
Grain size measurements of non-SRA and SRA samples.
B. NOES coating characterization
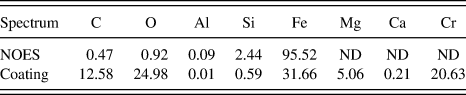
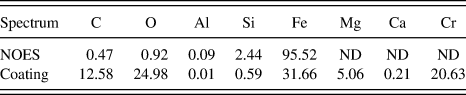
Based on the SE and BSE micrographs recorded in the SEM, the thickness of the coating was estimated to be around 1 µm and was uniformly distributed along the steel's surface. Within the thin coating, submicrometer pores of approximately 100 nm in diameter were observed, as shown in Fig. 4(a). Two spectra were obtained from the coating and the non-SRA NOES substrate, as shown in Fig. 4(b). The chemical compositions were determined by standardless x-ray microanalysis. The analysis indicated that the coating mainly consisted of C, O, Mg, Cr, and Fe, with traces of Si and Ca (Table III), which are commonly found in compositions of base/forsterite (Mg2SiO4) coating for grain oriented steel.Reference Washko and Choby15
BSE (left) and SE (right) micrographs of the coating are shown in (a). The coating thickness is approximately 1 µm and ∼100 nm pores (indicated by the white arrow) are observed uniformly through the whole coating. Chemical composition measurements (in wt%) for both the non-SRA NOES and coating (b) were done by standardless point analysis using EDS. The positions, where the spectra were obtained, are indicated on the BSE image, as shown in (c).
Chemical composition (in wt%) for both the non-SRA NOES and coating by semiquantitative point analysis using EDS, where ND stands for not detected.
C. Nanoindentation: Interior hardness
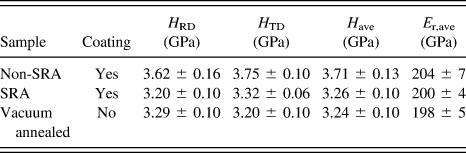
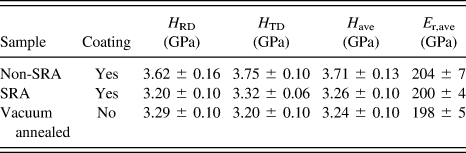
Hardness values were measured from the interior of the strip cross sections for non-SRA, SRA, and vacuum-annealed NOES samples. For each individual cross section, an average value was obtained from 6 indentations ∼120 µm away from the coating/steel interface. As shown in Table IV, a similar hardness value was measured along both the RD and TD cross sections for all samples. No obvious anisotropic mechanical properties were detected. Comparing between non-SRA and SRA samples, the average hardness was reduced significantly after the stress relief annealing process, from 3.71 to 3.26 GPa. A similar magnitude of hardness reduction was produced with a 24 h laboratory annealing of the non-SRA sample without coating, where the average hardness was 3.24 GPa. The hardness from the vacuum-annealed specimen was treated as zero stress reference hardness for later residual stress calculations.
Hardness (H) and reduced modulus (E r) values were determined by nanoindentation ∼120 µm away from the coating/steel interface on both the RD and TD cross sections.
D. Nanoindentation: Near surface hardness profile
1. Coating intact versus removed
Prior to indenting on the non-SRA RD cross sections, the presence of the coating was confirmed by BSE micrographs. Then after nanoindentation, the distances between indents and the coating/steel interface (edge) were measured using SE micrographs. Line profiles of hardness and reduced modulus were calculated from ∼5 individual large grains (≥100 µm in diameter) in contact with the coating. Based on channeling and optical contrast of the sample, crystal orientations were different at each probed grain. For a given distance from the coating/steel interface, an average hardness and modulus were calculated from ∼40 measurements, where these data were taken from all the probed grains of differing orientations. This averaging was conducted as the general trend for all grains was similar and for this study we are focusing on the average overall effect of the coating. In future work, an examination of the effect of crystallographic orientation on the stress profiles may be conducted.
The hardness variations with and without the presence of coating are shown in Fig. 5(a). With coating, the hardness was reduced to a minimum value of 3.0 GPa (at a distance of ∼20 µm), followed by a hardness increase to a plateau of ∼3.6 GPa as the distance was increased away from the coating/steel interface. Once the coating was removed, this hardness decrease was not observed, and a constant value of ∼3.6 GPa was calculated through all distances from the interface that were tested. The absence of a hardness decrease upon coating removal implied that the hardness decrease in the coated NOESs was not created by the specimen mounting, but was a result of the presence of the coating.
Changes in average mechanical properties, (a) hardness (H) and (b) reduced modulus (E r), along non-SRA rolling direction (RD) cross sections as the distance increased from the coating/steel interface. The dashed line shows the trend of hardness variation with coating.
For all indent distances to the edge tested, the average reduced modulus was calculated to be between 190 and 210 GPa for both samples (with and without the coating) as shown in Fig. 5(b). With the presence of the coating, a 10% reduction in modulus was observed at a distance of ∼20 µm away from the coating/steel interface. Possible reason is that the presence of residual stress alters material pile-up formation around the indents, which leads to errors in estimating the contact area for the modulus calculation. Similar effects have been reported in the literature.Reference Tsui, Oliver and Pharr23
2. Variations of hardness along RD versus TD
Indentations were also carried out on RD and TD cross sections of the non-SRA and SRA samples following a similar procedure, both with intact coating. From both the non-SRA and SRA samples, similar trends of hardness variations were observed on both the RD and TD cross sections. As shown in Fig. 6, the trend of hardness variation remained indifferent of the cross section direction. A similar magnitude of hardness change was observed along both directions. However, once the hardness profile reached a plateau, a higher hardness value (3.5 GPa) was obtained from the non-SRA sample than that was obtained from the SRA sample (3.3 GPa). A similar magnitude of hardness (3.3 GPa) was observed in non-SRA, without coating, after laboratory vacuum annealing process [Fig. 6(c)]. From both the non-SRA and SRA samples, a region of lower hardness compared to the rest of the hardness versus position curve was observed at approximately 20 µm from the coating/steel interface.
Changes in hardness (H) along different cross section directions of non-SRA (a), SRA (b), and average from both directions of vacuum-annealed NOES (c) samples as the distance increased from the coating/steel interacting edge. The dashed line shows the trend of hardness variation.
3. Interpretation of hardness with regard to residual stress
The hardness from the plateau regions, where no significant effect of the coating was present, was compared firstly. Similar hardness values were obtained from both the SRA sample [Fig. 6(b)] and the non-SRA sample that had no coating and was laboratory annealed in vacuum [Fig. 6(c)]. However, a significant increase in hardness was observed in the non-SRA [Fig. 6(a)] from a similar region. The elevated amount of hardness could be explained by strain hardening effect due to NOES manufacture processes,Reference Frutos, Multigner and Gonzalez-Carrasco16,Reference Kestens and Jacobs35 which was effectively removed by the annealing process.
With the hardness from the vacuum-annealed NOES sample serving as a nonstressed reference point, a lower hardness means the presence of tensile stress, and a higher hardness means the presence of compressive stress.Reference Suresh and Giannakopoulos22 Since the hardness value in the plateau region from the SRA [Fig. 6(b)] sample was similar to that from the vacuum-annealed sample, the hardness changes observed from the region (i.e., close to the coating/steel interface) were mostly related to residual stress and not strain hardening. The dip in the near surface hardness profile indicated a tensile residual stress.
A similar hardness profile was obtained from the non-SRA [Fig. 6(a)] sample, where a dip followed by a plateau region was observed as the distance to the coating/steel interface increased. Compared to the vacuum-annealed sample, the elevated hardness in the interior is believed to be strain hardening related, as discussed before. Despite this, the level of hardness about 20 µm from the coating/steel interface is the same for both the non-SRA and SRA cases.
Based on the average hardness values obtained from multiple grains with varied crystal orientations, the stress values can be estimated using the SG method [Eqs. (4) and (5)].Reference Suresh and Giannakopoulos22 This method assumes an equibiaxial stress state, which is not the case for our specimens. However, the SG method has been shown to provide reasonable prediction on an average residual stress value (average of the stresses along two axes).Reference Lee and Kwon36 Numerical simulations compared to nanoindentation showed that the average stress is a reasonable assumption.Reference Mann37 We consider the utility of using the SG method here to that extent: to provide an estimate of the average stress imposed on the steel by the coating near the interface.
A nonstressed reference hardness (H 0) and projected contact area (A 0) were calculated by averaging the values obtained from the interior of the vacuum-annealed NOES. An average tensile stress of approximately 200 MPa was calculated for both the non-SRA and SRA samples. The magnitudes of the tensile stress from RD and TD were similar for both the non-SRA and SRA samples along both cross section directions. The average stress found here by nanoindentation is similar to reported values in the literature for a relatively thick TiN coating (>2 µm) on GOES, where the stress was measured by beam bending techniques.Reference Beyer, Lahn, Schepers and Stucky6
The residual stress induced by the coating process is primarily originated from a misfit strain between the coating and steel substrate,Reference Zhang, Xu, Wang, Wu and Jiang11 but it can be affected by the changes in temperature and humidity.Reference Perera10 As a result, a nonlinear stress gradient in the substrate is created, similar to the nonuniform stress field indicated by the hardness profiles shown in Figs. 5 and 6. The magnitude of the stress varied depending on the distance to the interface.Reference Zhu, Xie, Hu, Chen and Zhang9,Reference Zhang, Xu, Wang, Wu and Jiang11 Despite the strain hardening effect, the presence of the tensile stress in the NOES improves its magnetic properties by reducing core loss along the direction of the stress field.Reference Chivavibul, Enoki, Konda, Inada, Tomizawa and Toda5 This improved core loss has been associated with better aligned and elongated magnetic domain structure as a result of the tensile stress,Reference Fukuda, Satoh, Ichida, Itoh and Shimanaka14 and it can be tailored by optimizing the coating thickness.Reference Chivavibul, Enoki, Konda, Inada, Tomizawa and Toda5,Reference Beyer, Lahn, Schepers and Stucky6
E. Variations in magnetic domain structure versus indentation profile
From the cross section of the coated non-SRA sample along the RD, grain crystallographic orientations were determined by EBSD [Fig. 7(a)] and magnetic domain structure was observed [Fig. 7(b)] in the region close to the coating. Within the region shown in Fig. 7(a), β parameter (as defined for NOES in Ref. Reference Gallaugher, Chromik, Brodusch and Gauvin33), was calculated, which is defined as the angle between the closest easy axis and the RD–TD plane, or surface of the sample. A larger value of β means a larger deviation between the easy axis and the surface. The grain indicated by a star had a relatively high β (9.6°), indicative of a finer, branched domain structure with supplementary domains.Reference Gallaugher, Chromik, Brodusch and Gauvin33 This expected domain structure with supplementary domains was visible in the regions of the grain away from the coated surface, with the main domain alignment in the direction of the closest easy axis to the surface [black arrow in Fig. 7(b)]. However, in the region close to the coating/steel interface, the domain structure consisted of simple domains with no supplementary domain structure present. An average nanoindentation hardness profile was obtained by indenting in a 15 × 5 matrix (average of the 5 lines) with 20 µm apart within the same region as shown in Fig. 7(b). As shown in Fig. 7(c), hardness obtained from the region close to the coating/steel interface was lower than that obtained from the remaining area of the same grain. As discussed in the previous sections, this reduced hardness indicated the presence of tensile stresses.
Variation of magnetic domain structure as a result of stress. Crystal orientations were determined by electron backscatter diffraction (a) and illustrated by the crystal on the right (b) for the grain indicated by the star. The NOES texture parameter β for the same grain was calculated from the orientation.Reference Gallaugher, Chromik, Brodusch and Gauvin33 Additionally, the stressed zone determined is outlined by the red dashed box on the left, and the unstressed zone is outlined by the blue dashed box on the right in (b). One nanoindentation hardness profile (c) was obtained from the same area as in (b).
The reduction in supplementary domain structure in the coating/steel interface region was consistent with the presence of tensile residual stress, which has been previously reported in GOESReference Fukuda, Satoh, Ichida, Itoh and Shimanaka14,Reference Washko and Choby15,Reference Chukwuchekwa, Moses and Anderson29 and NOES.Reference Senda, Fujita, Honda, Kuroki and Yagi30 With respect to the stress introduced by the coating, supplementary domain structure was significantly reduced or eliminated in NOES.Reference Senda, Fujita, Honda, Kuroki and Yagi30 An equivalent of 5 MPa or less external tension was enough to achieve this modification on the domain structure.Reference Washko and Choby15 The direct observation of reduction in supplementary domain structure with a SEM provides complementary information about the tensile residual stress zone near the coating/steel interface in addition to nanoindentation.
IV. CONCLUSION
Nanoindentation was demonstrated to be a useful technique for probing the variation in mechanical properties in a NOES lamination. Hardness profiles as a function of position from the coating/steel interface allowed for a separation of various effects, such as strain hardening in non-SRA specimens and stress imposed by the coating for all specimens. Samples with coating removal were also used to demonstrate the differences in hardness profiles imposed by the coatings. In this study, the focus was on the average tensile stress effect the coating had on the stress state of the steel, which plays an important role in the magnetic properties in the intended application. An average tensile stress of 200 MPa was estimated for both the SRA and non-SRA samples, where this stress state was found approximately 20 µm from the coating/steel interface. The presence of the coating stress was further validated by the observation of magnetic domain structure combined to grain orientation using the forescatter detector of the EBSD system of a FESEM with a high accelerating voltage and probe current. The stressed magnetic domain structure in the stressed region was found to be simpler compared with that observed in the unstressed region within the single grain. This coating-induced tensile stress could potentially reduce the core loss and subsequently improve the efficiency of electric motors.
ACKNOWLEDGMENT
This research was supported by the Natural Science and Engineering Research Council (NSERC) and General Motors Canada. The authors would like to thank Dr. Florient Bridier and Dr. Philippe Bocher at École de technologie supérieure (ETS) for access to the SEM. Yaoyao Ding would like to thank Dr. Hendrix Demers for his help with reviewing this manuscript.