Implications
Maize cob silage (MCS) can replace barley and sodium hydroxide wheat (SHW) as a major energy-providing cereal for dairy cows. Even though the feed intake decreases slightly when feeding MCS, cows are able to maintain the same milk yield on MCS as on more traditional energy supplements. MCS possesses roughage qualities with respect to the rumen environment, while being sufficiently energy rich to replace barley and SHW as energy supplement for milk production. Methane emissions are not different when comparing MCS, SHW and barley in mixed rations; hence, the environmental impact is the same among rations.
Introduction
The site of starch digestion in ruminants has great influence on the voluntary feed intake and is affected by the starch source, conservation method, and physical or chemical processing; and the dry matter intake (DMI) decreases significantly when highly rumen-digestible starch sources are fed to dairy cows (Allen, Reference Allen2000). However, starch is an important energy-providing nutrient for dairy cows, and cereal grains are the most commonly used energy supplements in rations for dairy production (Nozière et al., Reference Nozière, Ortigues-Marty, Loncke and Sauvant2010).
The volatile fatty-acid (VFA) production in the rumen is also affected by starch type and physical treatment (Nozière et al., Reference Nozière, Ortigues-Marty, Loncke and Sauvant2010). Propionate acts as a hydrogen sink, and changes in the fermentation pattern towards propionate decrease methane emissions. Sodium hydroxide wheat (SHW) has a lower rumen digestibility than rolled barley (Larsen et al., Reference Larsen, Lund, Weisbjerg and Hvelplund2009), and therefore the methane production might be lower when cows are fed SHW compared with barley, whereas maize cob silage (MCS) might be more comparable to barley than SHW in fermentation pattern and methane emissions. This is because immature maize starch has a higher ruminal degradation than mature maize starch (Jensen et al., Reference Jensen, Weisbjerg, Nørgaard and Hvelplund2005).
Ruminal acidosis can be prevented through reducing the ruminal degradability of the starch in the ration by chemical treatment of grains or by choosing energy sources with naturally low rumen degradability (Nozière et al., Reference Nozière, Ortigues-Marty, Loncke and Sauvant2010), which will defer some of the starch digestion to the small intestine (Larsen et al., Reference Larsen, Lund, Weisbjerg and Hvelplund2009). Ruminal acidosis can occur when feeding barley as the major energy supplement, whereas SHW reduces this risk owing to a reduced ruminal starch degradability of SHW caused by the chemical treatment and the feeding of whole grains (O’Mara et al., Reference O’Mara, Murphy and Rath1997; De Campeneere et al., Reference De Campeneere, De Boever and De Brabander2006). Another means of preventing ruminal acidosis is by increasing the amount of roughage in the ration, which consequently reduces the energy density of the ration. The degree of reduction in energy density depends on the digestibility of the roughage. Hence, maximising the roughage proportion of mixed rations for dairy production increases the need for highly digestible roughages to secure the animals’ energy supply (De Brabander et al., Reference De Brabander, De Boever, De Smet, Vanacker and Boucqué1999).
In maize silage, a higher digestibility can be obtained by harvesting at an early stage of maturity (Jensen et al., Reference Jensen, Weisbjerg, Nørgaard and Hvelplund2005), by leaving a larger proportion of stubble behind in the field or, ultimately, by harvesting only the maize cobs (including kernels) for MCS (Flachowsky et al., Reference Flachowsky, Peyker, Schneider and Henkel1993). MCS is an interesting alternative to grain feeding with digestibility and dietary properties between roughage and concentrate, and it has previously been shown that steers and bull calves for slaughter thrive on MCS and can maintain daily weight gains comparable to animals fed rolled barley (Umoh and Holmes, Reference Umoh and Holmes1976). However, the nutritional value of MCS in dairy production is not well described in the literature.
The aim of this study was to determine whether the energy value of, and methane emissions from, MCS is comparable to the more commonly used energy sources in rations for dairy cattle, rolled barley and SHW, and if its higher structural value could secure a rumen environment comparable to the rumen environment in SHW-fed cows.
Material and methods
Animals and experimental design
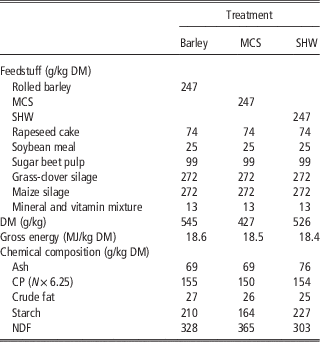
All animal experiments complied with the Danish Ministry of Justice Law No. 726 (9 September 1993) concerning experiments on animals and care of experimental animals. Two different studies were carried out, organised in a 3×3 Latin square design with three experimental periods and three grass-clover and maize silage-based mixed rations (~60% roughage) where the energy supplement of the mixed ration was either rolled barley, SHW or MCS (Table 1). Each period lasted 3 weeks.
Composition of mixed rations containing barley, maize cob silage (MCS) or sodium hydroxide wheat (SHW)

DM=dry matter.
Study 1
The first study was a 3×3 repeated Latin square production study carried out at the Danish Cattle Research Centre (DCRC) in Foulum, Denmark, between April and June 2011, which included 45 Danish Holstein cows blocked according to days from calving (between 30 and 262 at the beginning of the study (mean±s.d.; 165±72) within lactation number (first or later). These cows had an average milk yield of 31.0±8.5 kg/day and weighed 664.0±68.0 kg at the beginning of the study. At the end of the study, the average weight had increased to 680.1±76.0 kg.
Study 2
The second study was subsequently carried out at the Department of Animal Science, Aarhus University in Foulum, Denmark, between August and October 2011. This study included three lactating rumen-canulated Danish Holstein cows between 64 and 239 days from calving with an average milk yield of 24.6±9.3 kg/day and an average BW of 641.3±47.0 kg at the beginning of the study. At the end of the study, the average milk yield was 21.7±6.5 kg/day and the average BW 628.3±27.1 kg.
Housing and management
Study 1
Cows were kept in a loose-housing system with slatted floors and cubicles with mattresses. A free cow-traffic system was applied for access to an automatic milking system (DeLaval AB, Tumba, Sweden). Within the dairy unit, the 45 experimental cows were housed in one group with access to an automatic milking unit (AMU). Mixed rations were fed in mangers mounted on scales with individual cow identification by electronic ear tag. There were 6 mangers per treatment group, and all 15 cows in a given treatment group had access to all mangers containing the given treatment ration. When cows changed treatments, the ration in the mangers was changed; this meant that the Latin squares were not balanced out; however, the cows were able to eat from the same mangers throughout the study, preventing effects of a manger change on top of the ration change. Cows had access to fresh drinking water at all times. The facilities and management procedures at DCRC are described in detail by Bossen et al. (Reference Bossen, Weisbjerg, Munksgaard and Højsgaard2009) and Bossen and Weisbjerg (Reference Bossen and Weisbjerg2009).
Study 2
Cows were housed in tie-stalls on mattresses with sawdust bedding and milked twice daily at 0600 and 1700 h in the stalls. Animals were weighed once at the beginning of each study period and once at the end of the study. Cows had access to fresh drinking water at all times.
Rations and feeding
Study 1
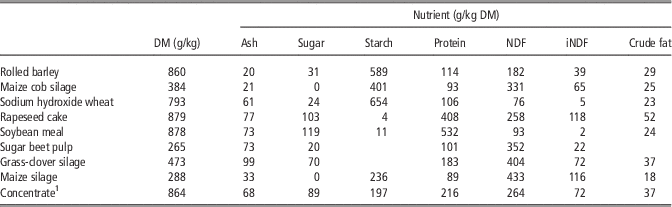
Treatments consisted of three different mixed rations where the main energy supplement was either 25% rolled barley, SHW or MCS on ration dry matter (DM) basis (Table 1). The chemical composition of individual feedstuffs is shown in Table 2. The maize (Patrick, Limagrain A/S, Horsens, Denmark) was grown at Aarhus University in Foulum. The maize cob was harvested with a theoretical cutting length of 5 mm on 8 November 2010 using a Claas Jaguar 890 (Claas KGaA mbH, Harsewinkel, Germany) with a kernel processor. The maize cob was added 1.44 l ensiling additive (Lalsil Fresh, Lallemand, MO, Canada) per tonne, and stored in round bales wrapped in plastic using an Orkel MP 2000 Compactor (Orkel A/S, Fannrem, Norway). SHW was prepared by adding 30 kg of sodium hydroxide and 100 l water to 1000 kg of whole wheat kernels and mixing for 10 min. The wet SHW was left in a pile for 10 h to heat up and subsequently dried and cooled in a 10-cm layer on the barn floor. Cows had ad libitum access to the mixed rations in the mangers and were additionally allowed 2.5 kg DM/day of concentrate in the AMU allocated at each visit according to milking interval as described by Bossen et al. (Reference Bossen, Weisbjerg, Munksgaard and Højsgaard2009). Composition of the concentrate was as follows: rapeseed cake (230 g/kg), sugar beet pulp, dried (170 g/kg), barley (130 g/kg), wheat (120 g/kg), oats (100 g/kg), sunflower cake, partly dehulled (70 g/kg), artificially dried grass, pelleted (50 g/kg), wheat bran (50 g/kg), soybean meal, toasted (40 g/kg), sugar beet molasses (20 g/kg) and mineral mixture (20 g/kg). Roughage DM content was determined weekly for ration formulation adjustment.
Chemical composition of feedstuffs

DM=dry matter; iNDF=indigestible NDF.
1 In the automatic milking unit in study 1 (not used in study 2). Composition: rapeseed cake (230 g/kg); sugar beet pulp, dried (170 g/kg); barley (130 g/kg); wheat (120 g/kg); oats (100 g/kg); sunflower cake, partly dehulled (70 g/kg); artificially dried grass, pelleted (50 g/kg); wheat bran (50 g/kg); soybean meal, toasted (40 g/kg); sugar beet molasses (20 g/kg); mineral mixture (20 g/kg).
Study 2
The mixed rations from study 1 were vacuum packed with ~15 kg in each bag and stored at −20oC. Before feeding, the bags were thawed and the cows fed twice daily at 0530 and 1730 h according to the ad libitum feed intake the previous day. Refusals were kept at ~5% of the daily intake. At every feeding, 10 g chromium oxide (Cr2O3) and 10 g titanium dioxide (TiO2) was given as digestive markers through the rumen cannula. No concentrate was fed in addition to the mixed ration in study 2.
Data collection
Study 1
Mixed ration intake was recorded in mangers on scales from the Insentec RIC system (Marknesse, the Netherlands). Information about milk yield and cow weight at each milking was obtained from the AMU. Every week, milk samples from all cows were collected from all milkings during 48 h in the AMU for chemical analysis for content of fat, protein and lactose. The AMU was equipped with a device for concentrate feeding and weighing of concentrate refusals at the end of each cow visit. For further information about data collection and management at DCRC see Bossen et al. (Reference Bossen, Weisbjerg, Munksgaard and Højsgaard2009) and Bossen and Weisbjerg (Reference Bossen and Weisbjerg2009). One faecal sample was obtained from each cow by grab sampling the last day of each experimental period for DM determination. Faecal consistency in individual cows was scored on a scale from 1 to 5, where 1 represented liquid faeces and 5 represented firm faecal balls. Scoring was carried out simultaneously by two persons.
Study 2
Feed intake was recorded daily by weighing offered feed and refusals. Samples of the feed were taken daily between days 11 and 14 and analysed for content of DM, ash, nitrogen, starch, crude fat and NDF. Samples of refusals were collected on days 12 to 15 for determination of DM. Water consumption was measured during days 12 to 15. Milk yield was recorded on two consecutive milkings (morning and evening) once weekly, and milk samples were analysed for content of fat, protein and lactose for use in methane calculations. Faecal samples were taken morning and evening on days 12 to 15, pooled within cow and analysed for content of DM, ash, NDF, Cr2O3 and TiO2. Nutrient digestibilities were calculated using Cr2O3 and TiO2 as markers and presented as an average of the two markers.
Chewing and ruminating time was quantified using the IGER Jaw Movement Recorder (Ultra Sound Advice, London, UK) during 24 h on day 11 and 13 (Rutter et al., Reference Rutter, Champion and Penning1997). Rumen pH was measured every hour between feedings on day 14 of each treatment period. Rumen fluid was collected from the ventral rumen sac through a rumen fluid sampler tube (Bar Diamond Inc., Parma, ID, USA) and from the central rumen mat by straining a sample of the contents of the mat through a cloth. The pH was measured with a MeterLabTM PHM 220 pH metre (Radiometer, Copenhagen, Denmark). Samples of rumen fluid were stored at −20°C until selected samples (0730, 1230 and 1730 h) were analysed for contents of VFA. Rumen evacuation was carried out on the last day of each experimental period, as described by Stensig et al. (Reference Stensig, Weisbjerg and Hvelplund1998), and samples of rumen content analysed for content of DM and NDF.
Methane was measured from days 18 to 21 by means of open-circuit indirect calorimetry. The chambers had a volume of ~17 m3 and the outside dimensions were 183 cm (width)×382 cm (length)×245 cm (height). The chambers were built of a steel frame and covered with transparent polycarbonate plates and placed in a square 2×2 so that the cows could see each other. On day 20, cows switched chambers diagonally to reduce potential background differences in the barn. Methane and carbon dioxide were measured by infrared sensors, and flow by a mass flow metre. All instruments were delivered by Columbus instruments (Columbus, OH, USA). Air composition of barn air and chamber air were measured every 12.5 min. Excretion of methane and carbon dioxide was calculated from the gas concentration in barn air, in exhaust air from the chambers and air flow. Volumes of methane are given at standard temperature and pressure (0°C, 101.325 KPa). Further details on chamber construction, ventilation system and instruments can be found in a study by Hellwing et al. (Reference Hellwing, Lund, Weisbjerg, Brask and Hvelplund2012).
Laboratory analyses
Milk samples were analysed for content of fat, protein and lactose by Eurofins Steins Laboratory A/S (Holstebro, Denmark) on a Milkoscan 4000 infrared analyser. DM in feed, rumen contents and faeces was determined by drying in a forced-air oven at 60°C for 48 h. Starch, NDF, CP, crude fat and ash were analysed as described by Bossen et al. (Reference Bossen, Weisbjerg, Munksgaard and Højsgaard2009). In forages and MCS organic matter, digestibility was determined as described by Tilley and Terry (Reference Tilley and Terry1963). Sugar was analysed by the Luff–Schoorl method modified from Schoorl (Reference Schoorl1929), and indigestible NDF was determined after rumen incubation during 288 h as described by Åkerlind et al. (Reference Åkerlind, Weisbjerg, Eriksson, Thøgersen, Udén, Ólafson, Harstad and Volden2011). The digestive marker, Cr2O3, was determined by spectrophotometric determination of chromate after oxidation of Cr2O3 with sodium peroxide. The analysis was carried out as described by Schürch et al. (Reference Schürch, Lloyd and Crampton1950). TiO2 was determined as described by Myers et al. (Reference Myers, Ludden, Nayigihugu and Hess2004). The concentrations of VFA were determined according to the method described by Canibe et al. (Reference Canibe, Højbjerg, Badsberg and Jensen2007) using a Hewlett Packard gas chromatograph (model 6890) equipped with a flame ionisation detector and a 30 m SGE BP1 column (Scientific Instrument Services, NJ, USA). Values for net energy content were calculated as Scandinavian Feed Units (SFU) and presented as MJ Net Energy for Lactation (NEL), using the fixed conversion coefficient 7.89 MJ NEL/SFU (Bossen et al., Reference Bossen, Weisbjerg, Munksgaard and Højsgaard2009). Gross energy content of the diets was calculated as described by Volden and Nielsen (Reference Volden and Nielsen2011).
Statistical analysis
Study 1
The first 2 weeks of each study period were considered as adaptation; hence, production data from the third week of each treatment period was included in the analyses. ANOVA was performed in the MIXED models procedure of SAS® (SAS Institute Inc., Cary, NC, USA) on weekly averages using the model
 ${\rm Y}_{{ijk}} =\mu {\plus}\alpha _{i} {\plus}\beta _{j} {\plus}\left( {\alpha \beta } \right)_{{ij}} {\plus}\delta _{{\rm k}} {\plus}{\rm C}_{{ijkl}} {\plus}{\varepsilon}_{{ijkl}} $
where Y
ijk
is the dependent variable, μ the overall mean, α
i
the fixed effect of period i (1, 2, 3), β
j
the fixed effect of treatment j (Barley, MCS, SHW), (αβ)
ij
the effect of the interaction between period i and treatment j, δ
k
the fixed effect of block k (1, 2, …, 15), Cijkl
the random effect of animal l (1, 2, …, 45) within block, and ε
ijkl
the random residual error. Random effects are assumed normally distributed with mean value 0 and constant variance C
ijkl
~N(0, σ
2
C) and ε
ijkl
~σ
2.
Study 2
The first 12 days of each study period was considered as adaptation. ANOVA was performed in the MIXED models procedure of SAS® using the model
 ${\rm Y}_{{ijk}} =\mu {\plus}\alpha _{i} {\plus}\beta _{j} {\plus}{\rm C}_{{ijk}} {\plus}{\varepsilon}_{{ijk}} $
where Y
ijk
is the dependent variable, μ the overall mean, α
i
the fixed effect of period i (1, 2, 3), β
j
the fixed effect of treatment j (Barley, MCS, SHW), Cijk
the random effect of animal k (1, 2, 3) and ε
ijk
the random residual error. Random effects are assumed normally distributed with mean value 0 and constant variance C
ijk
~N(0, σ
2
C) and ε
ijk
~σ
2.
When analysing for the effect of treatment on rumen pH and VFA, the following model was applied: Y ijkl =μ+α i +β j +C ijkl +λ l +(βλ) jl +ε ijkl where Y ijkl is the dependent variable, μ the overall mean, α i the fixed effect of period i (1, 2, 3), β j the fixed effect of treatment j (Barley, MCS, SHW), C ijkl the random effect of animal k (1, 2, 3), λ l the fixed effect of sample number l (pH: 1, 2, …,12) (VFA: 1, 2, 3), (βλ) jl is the interaction between treatment j and sample number l and ε ijkl is the random residual error. The covariance structure of the repeated measures during consecutive sampling times within animal and period was accounted for by applying the repeated statement for the MIXED procedure in SAS® using the autoregressive first-order covariance structure, AR(1) (Littell et al, Reference Littell, Milliken, Stroup, Wolfinger and Schabenberger2006). Random effects were assumed normally distributed with mean value zero and constant variance C ijkl ~N(0, σ 2 C) and ε ijkl ~σ 2.
Data are presented as least squares means, and Tukey–Kramer-adjusted differences (Littell et al., Reference Littell, Milliken, Stroup, Wolfinger and Schabenberger2006) are considered statistically significant if P⩽0.05 and as tendencies if 0.05<P<0.10.
Results
The MCS was harvested in 2010, after a colder than normal growth season. The temperature sum as daily mean temperature above 6°C, summed over the growing season, was for Denmark only 1348 in 2010, the lowest in the period 2001 to 2010, with a mean of 1466 (Mikkelsen, Reference Mikkelsen2011). The in vitro OM digestibility was 81.5%.
Study 1
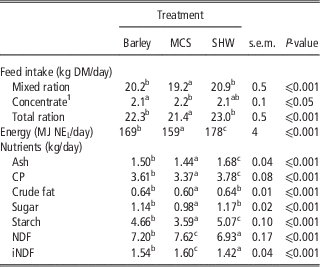
Intake of the mixed ration containing MCS was lower than the intake of the mixed rations containing barley (P⩽0.01) and SHW (P⩽0.001; Table 3). The intake of concentrate offered in the AMU increased when cows were fed MCS compared with barley (P⩽0.05) but not when compared with SHW- (P⩽0.13; Table 3), following an increased milking frequency in MCS-fed cows compared with barley- (P⩽0.001) and SHW- (P⩽0.01) fed cows (Table 4). Overall, this resulted in a lower total feed intake in MCS-fed cows compared with barley- (P⩽0.05) and SHW- (P⩽0.001) fed cows, which ultimately lead to a lower energy intake on the MCS ration than on the barley (P⩽0.001) and SHW (P⩽0.001) rations, respectively (Table 3).
Intake of feed and nutrients from mixed rations containing barley, maize cob silage (MCS) or sodium hydroxide wheat (SHW) (study 1)

DM=dry matter; iNDF=indigestible NDF.
1 In the automatic milking unit.
a,bDifferent indexes indicate Tukey–Kramer adjusted significant difference of least squares means (P⩽0.05) within rows.
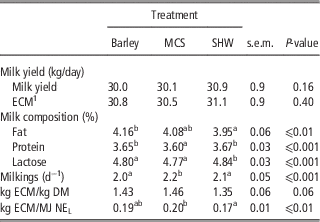
Milk yield and composition, daily milkings in the automatic milking unit and production efficiency from mixed rations containing barley, maize cob silage (MCS) or sodium hydroxide wheat (SHW) (study 1)

DM=dry matter.
1 Energy-corrected milk (ECM, 3.140 MJ/kg) calculated as described by Sjaunja et al. (Reference Sjaunja, Baevre, Junkkarinen, Pedersen and Setälä1991).
a,bDifferent indexes indicate Tukey–Kramer adjusted significant difference of least squares means (P⩽0.05) within rows.
Milk and ECM yields were not different among treatments. However, the chemical composition of the produced milk differed (Table 4). The milk fat content was higher in cows fed the barley ration than in cows fed the SHW ration (P⩽0.01), whereas MCS-fed cows only tended to have a higher fat content than cows fed the SHW ration (P=0.06). The milk protein content was lower in MCS-fed cows compared with barley- (P⩽0.01) and SHW- (P⩽0.001) fed cows. The lactose content was higher in cows fed the SHW ration than in cows fed the barley (P⩽0.001) and MCS (P⩽0.001) rations, whereas the lactose content in barley-fed cows only tended to be higher than in MCS-fed cows (P=0.06) (Table 4).
The decreased energy intake combined with the similar ECM yield resulted in a higher production efficiency per MJ NEL in MCS-fed cows than in cows fed SHW (P⩽0.01), and a tendency to a higher efficiency in barley-fed cows compared with SHW- (P=0.07) fed cows. The production efficiency per kg DM was higher in MCS-fed cows than in SHW-fed cows (P=0.05) (Table 4).
The faecal DM content was 12.4±0.2% in barley-fed cows, 11.8±0.2% in MCS-fed cows and 12.1±0.2% in SHW-fed cows with a significant effect of treatment (P⩽0.05), owing to a significant difference between barley- and MCS-fed cows (P=0.05). Faecal scores were 2.9±0.05 in MCS-fed cows and 2.8±0.05 in barley- and SHW-fed cows and no effect of treatments were found (P=0.16).
Study 2
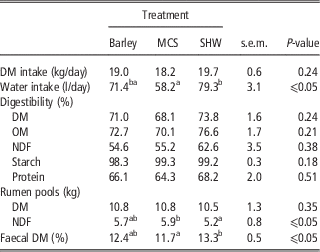
The daily DMI and the digestibilities of DM, OM, starch, protein and NDF were unaffected by treatments (P⩾0.18). The same was the case for the rumen pool of DM (P=0.35). However, the rumen pool of NDF was higher in barley- (P⩽0.05) and MCS- (P⩽0.05) fed cows than in cows fed the SHW ration (Table 5). The highest faecal DM content was found in cows fed the SHW ration, but it was only significantly higher compared with MCS-fed cows (P⩽0.05). In barley-fed cows, the faecal DM content only tended to be lower (P=0.07) (Table 5). The water intake was higher in SHW-fed cows than in MCS-fed cows (P⩽0.05) and tended to be higher in barley-fed cows than in MCS-fed cows (P=0.06) (Table 5).
Dry matter (DM) intake, apparent digestibility of DM, organic matter (OM), NDF, starch and protein together with rumen pools of DM and NDF and faecal DM content from mixed rations containing barley, maize cob silage (MCS) or sodium hydroxide wheat (SHW) (study 2)

a,bDifferent indexes indicate Tukey–Kramer adjusted significant difference of least squares means (P⩽0.05) within rows.
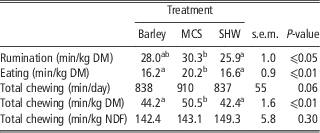
The eating time per kg DM was significantly longer in MCS-fed cows compared with barley- (P⩽0.01) and SHW- (P⩽0.01) fed cows, and the time spent ruminating was numerically longer in MCS-fed cows than in barley-fed cows and significantly longer than in SHW-fed cows (P⩽0.05). This resulted in a significantly increased total chewing time per kg DM in cows fed the MCS ration than in cows fed the barley (P⩽0.05) and SHW (P⩽0.01) rations. However, no treatment effects were found on total chewing time per kg NDF (P=0.29). Total chewing time in minutes per day only tended to be higher in MCS-fed cows than in barley- (P=0.09) and SHW- (P=0.07) fed cows (Table 6).
Rumination, eating and chewing time from mixed rations containing barley, maize cob silage (MCS) or sodium hydroxide wheat (SHW) (study 2)

DM=dry matter.
a,bDifferent indexes indicate Tukey–Kramer adjusted significant difference of least squares means (P⩽0.05) within rows.
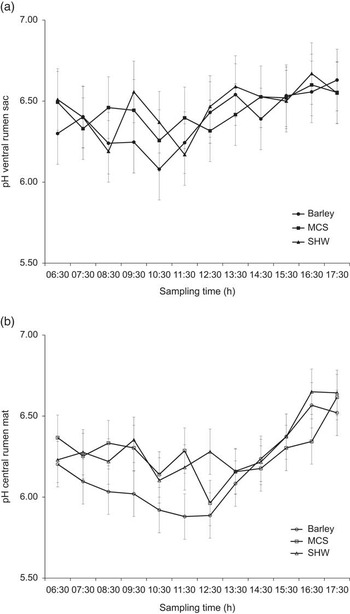
In the ventral sac, no overall effect of treatment was found on rumen pH (P=0.51), whereas in the central mat a significant effect of treatment was found (P⩽0.05), probably owing to the pH in barley-fed cows declining more rapidly and to a numerically lower level than the pH in cows fed MCS or SHW (Figure 1). There were no interactions between rations and sampling time in the ventral sac (P=0.78) or the central mat (P=0.76). There were no significant differences between treatments at any given sampling time.
Rumen pH±s.e.m. measured in the (a) ventral rumen sac and the (b) central rumen mat, of cows eating mixed rations containing barley, maize cob silage (MCS) or sodium hydroxide wheat (SHW) (study 2). Cows were fed twice daily at 0530 and 1730 h.

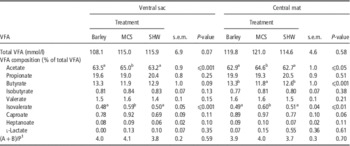
Treatments tended to affect the total concentration of VFA in the ventral sac (P=0.07), whereas in the central mat no effect of treatments was found (P=0.58). The numerically lowest total concentration of VFA was found in the ventral sac of barley-fed cows. The molar proportion of acetate was higher in MCS-fed cows than in barley- (P⩽0.05) and SHW- (P⩽0.05) fed cows in both the central mat and the ventral sac. Similarly, molar proportions of isovalerate were higher in MCS-fed cows than barley- (P⩽0.05) and SHW- (P⩽0.05) fed cows. The molar proportion of butyrate in the central mat was lower in MCS-fed cows (P⩽0.05) than in SHW- (P⩽0.05) and barley-fed cows (Table 7). No interactions were found between rations and sampling time.
Molar proportions of volatile fatty acids (VFA) measured in the ventral rumen sac and the central rumen mat, respectively, from mixed rations containing barley, maize cob silage (MCS) or sodium hydroxide wheat (SHW) (study 2)

1 (A+B)/P=(acetate+butyrate)/propionate.
a,bDifferent indexes indicate Tukey–Kramer adjusted significant difference of least squares means (P⩽0.05) within rows.
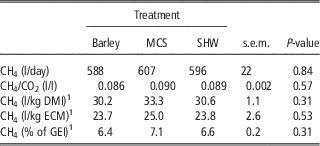
The total daily methane emissions were not affected by treatment (P=0.80). Daily methane emissions related to either DMI, gross energy intake or ECM yield were all unaffected by treatment (P⩾0.31; Table 8)
Methane emission, ratio between methane and carbon dioxide, methane emission related to dry matter intake (DMI), energy-corrected milk (ECM) and methane lost as percentage of gross energy intake (GEI) for mixed rations containing barley, maize cob silage (MCS) or sodium hydroxide wheat (SHW) (study 2)

1 On the basis of data obtained for DMI, GEI and ECM during methane measurements in the chambers.
Discussion
The colder than normal growth season in 2010 resulted in the MCS being less developed, with a lower DM and starch content than expected under average Danish growth conditions (Mikkelsen, Reference Mikkelsen2011). However, the overall quality of the silage was good with an in vitro OM digestibility of 81.5%.
Study 1
In the present study 1, the DM intake was higher for the SHW ration than for the barley and MCS rations. In Holstein cows, De Campeneere et al. (Reference De Campeneere, De Boever and De Brabander2006) compared rolled wheat and SHW fed as part of a maize and grass silage-based mixed ration, where wheat constituted ~26% of DM. They found a higher daily DM intake in cows fed the SHW than in cows fed rolled wheat, increasing the daily NEL intake of the cows. In contrast, Phipps et al. (Reference Phipps, Sutton, Humphries and Jones2001) found no difference in DMI between cows fed rolled wheat and cows fed SHW. However, in their study, the proportion of wheat in the ration was lower (17% of DM) than in the study by De Campeneere et al. (Reference De Campeneere, De Boever and De Brabander2006) (26% of DM) and the present studies (25% of DM). Similarly, O’Mara et al. (Reference O’Mara, Murphy and Rath1997) found no difference in DMI between cows fed SHW or ground wheat, but in their study DMIs were generally very low (14 kg/day). The higher intake of the SHW-based ration might be explained by a decreased ruminal degradability of starch in SHW, which is expected to render the rumen environment less compromised by fermentation products (O’Mara et al., Reference O’Mara, Murphy and Rath1997; De Campeneere et al., Reference De Campeneere, De Boever and De Brabander2006; Larsen et al., Reference Larsen, Lund, Weisbjerg and Hvelplund2009) or by the lower NDF intake in SHW-fed cows compared with barley- and MCS-fed cows (Table 3). In the present study 1, the DMI was lowest for the MCS ration. In steers fed ~40% to 45% of DM/day as either rolled barley or MCS with a low DM content (34%), Umoh and Holmes (Reference Umoh and Holmes1976) found no significant difference in DMI or live weight gain of steers, indicating similar palatability of the different rations. The significantly higher concentrate intake and number of daily milkings in the AMU in MCS-fed cows in the present study 1 can be interpreted as indicating a lower palatability of the MCS ration compared with the barley and SHW rations, because the palatability of the offered concentrate in the milking unit has been shown to affect the milking frequency in AMUs (Madsen et al., Reference Madsen, Weisbjerg and Hvelplund2010). This has been shown previously by De Brabander et al. (Reference De Brabander, Cottyn and Boucqué1992) who compared ensiled maize grain with ground concentrate in rations based on whole crop maize silage and grass silage. However, the lower energy intake of MCS-fed cows may also have contributed to their increased motivation for increasing the concentrate intake. Water intake was the lowest on the MCS diet probably because of the lower DM concentration in MCS compared with other grains, and was highest on SHW diet probably as a response to the higher sodium intake.
Despite the lower DMI, and consequently reduced intake of energy-providing nutrients in MCS-fed cows in the present study 1, MCS-fed cows were able to maintain the same milk yield and ECM yield as SHW- and barley-fed cows, which increased the production efficiency in MCS-fed cows compared with SHW-fed cows. It is unknown whether this is related to a smaller weight gain in MCS-fed cows, as weight loss and gain should be interpreted with caution in a Latin square design with three-week periods. As expected, the protein content of the produced milk was positively correlated with the energy intake of the cows, as shown by others (Broderick, Reference Broderick2003). The milk fat content has previously been shown to decrease when the amount of highly degradable starch increases through increasing the wheat proportion from 8% to 32% in a total mixed ration (Hetta et al., Reference Hetta, Tahir and Swensson2010). In contrast, O’Mara et al. (Reference O’Mara, Murphy and Rath1997) found no effect on fat content in the milk by feeding 20% of the DM in a 60 : 40 forage to concentrate ratio diet as either rolled wheat, SHW or ground maize. The fat content was, however, numerically lower in their SHW treatment and it was speculated that the generally low milk yield (<22 kg/day) in the study by O’Mara et al. (Reference O’Mara, Murphy and Rath1997) was responsible for the lack of effect of their treatments on milk yield and composition. In the present study 1, the lowest milk fat content was found in the SHW treatment and the highest in the MCS and barley treatments.
The faecal DM content was not different in barley- and SHW-fed cows, whereas MCS-fed cows had a lower faecal DM content. This was not accompanied by any differences in faecal scores between treatments. In study 2, faecal DM contents similar to study 1 were found in barley- and MCS-fed cows, whereas it was significantly higher in SHW-fed cows in this study. It should be noted that in study 1 only one sample per cow was collected in each study period, owing to the large number of loose-housed cows.
Study 2
The declining milk yields found in study 2 is probably explained by the cows being in late lactation. The weight loss also encountered in study 2 is probably because of the cows in study 2 not being fed the concentrate allowance, which was fed to the loose-housed cows in the AMU in study 1. Hence, the energy concentration of the total ration of cows in study 2 was lower than in study 1.
A significant effect of treatment on rumen pH was found in the central rumen mat in contrast to no treatment effect in the ventral rumen sac, probably because fermentation predominantly takes place in the central rumen mat (Storm and Kristensen, Reference Storm and Kristensen2010). However, none of the treatments in the present study 2 gave rise to severely reduced rumen pH, which would compromise rumen function. From the course of the pH curves from the central rumen mat, it seemed that SHW and MCS gave rise to different fermentation patterns than the barley ration. Barley-fed cows showed a typical drop in pH subsequent to feeding, which only slowly stabilised at the level of SHW- and MCS-fed cows ~7 h after feeding. In contrast, MCS- and SHW-fed cows had a more stable rumen pH after feeding, which remained just below 6.5. The same pH patterns were shown by O’Mara et al. (Reference O’Mara, Murphy and Rath1997), when comparing ground wheat and SHW, and by Gulmez and Turkmen (Reference Gulmez and Turkmen2007), when comparing ground wheat and ground maize. There are different explanations to the more stable rumen pH of MCS- and SHW-fed cows compared with barley-fed cows: In MCS-fed cows, the higher intake of NDF leads to an increase in chewing time (Tables 3 and 6), which aids in stabilising the pH by stimulating saliva secretion and rumen motility (Nørgaard et al., Reference Nørgaard, Nadeau and Randby2011), and the reduced starch degradability of SHW in the rumen should, in theory, prevent an accumulation of fermentation products (O’Mara et al., Reference O’Mara, Murphy and Rath1997; De Campeneere et al., Reference De Campeneere, De Boever and De Brabander2006). However, no differences in total VFA were found in the present study 2. DM, OM, starch, protein and NDF digestibilities of MCS were not different from the digestibilities of the more traditional grains, which indicates that, even though MCS, in terms of rumen environment, has roughage qualities, it is digestible to a degree not different from barley and SHW.
In the central mat, total VFA was numerically lowest in the SHW-fed cows, but no treatment effects were found. When comparing highly rumen-degradable energy sources, such as rolled barley and MCS, to less rumen-degradable energy sources, such as SHW, Gulmez and Turkmen (Reference Gulmez and Turkmen2007) showed that ground wheat (high rumen degradability) resulted in higher total VFA than ground maize (low rumen degradability). Jensen et al. (Reference Jensen, Weisbjerg, Nørgaard and Hvelplund2005) found no differences in total VFA when comparing maize silages of different stages of maturity and rumen degradability, and acetate : propionate : butyrate ratios varied between 68 : 20 : 12 and 69 : 19 : 13, independent of the rumen degradability of the maize silage. In the present study, acetate, propionate and butyrate amounted to ~96% of the total VFA in the rumen contents. In the central mat of MCS-fed cows, the ratio was 68 : 20 : 12 and in barley- and SHW-fed cows 65 : 21 : 14, but in the present study 2 no treatment effect was found. Previous findings have shown that a high roughage content in the ration gives rise to higher acetate : propionate : butyrate molar ratios than grain-based diets (Bergman, Reference Bergman1990). The higher content of isovalerate in MCS-fed cows indicates a higher protein degradation in the rumen than when cows are fed barley or SHW, but it could also be linked to a different amino-acid composition of the MCS compared with barley and SHW.
The DMI during methane measurements (data not shown) was not different from the DMI during the digestibility study, as also shown previously in the same experimental unit (Hellwing et al., Reference Hellwing, Lund, Weisbjerg, Brask and Hvelplund2012). Overall, there was no difference in methane emission between treatments, which is in agreement with Moe et al. (Reference Moe, Tyrrell and Hooven1973) and Klevenhusen et al. (Reference Klevenhusen, Kreuzer and Soliva2011) who compared maize v. oats and maize v. barley, respectively. The DMI has been shown to explain a significant amount of the variation in the methane emission (Mills et al., Reference Mills, Kerbreab, Yates, Crompton, Cammell, Dhanoa, Agnew and France2003), and therefore it was expected that MCS would have had the lowest total methane emission in l/day of the three treatments. However, MCS total methane emissions were not different from SHW and barley. The lack of treatment differences on total methane emission were probably because of a more methanogenic rumen VFA profile on MCS with a higher proportion of acetate in the rumen content of MCS-fed cows.
In conclusion, when MCS replaced barley or SHW as the major energy source in mixed rations for dairy cows, it gave rise to a lower DMI without affecting apparent digestibilities. The ECM yield was unaffected by treatment and the fat content on MCS was comparable to barley, whereas the protein content decreased when MCS was used in the ration. From ruminal VFA patterns and pH measures, it appeared that MCS possessed roughage qualities with respect to rumen environment, while at the same time being sufficiently energy rich to replace barley and SHW as energy supplement for milk production. Methane emissions were unaffected by the choice of major energy source in the mixed ration.
Acknowledgements
The studies were financed by ‘Mælkeafgiftsfonden’, a foundation under the Danish Agriculture and Food Council supporting research in dairy production. The authors wish to express their sincere gratitude to the staff working in the barns and laboratories at the Danish Cattle Research Centre and the Department of Animal Science, Aarhus University, for their kind assistance.