Introduction
In the last decade, the number of neuroimaging studies has increased markedly in psychiatric journals, promising to improve the understanding and treatment of mental health disorders by shedding light on how the brain is (dis)organized in health and disease. A widely used approach has been to consider brain function, and dysfunction, at the level of interactions or connections between brain regions collectively constituting a network. Within this framework, several mental health disorders have been associated with abnormalities of brain connectivity or networks (Kelly et al. Reference Kelly, Zuo, Gotimer, Cox, Lynch, Brock, Imperati, Garavan, Rotrosen, Castellanos and Milham2011; Gong & He, Reference Gong and He2015), with dysconnectivity theories of schizophrenia being a prominent example (Friston & Frith, Reference Friston and Frith1995; Bullmore et al. Reference Bullmore, Frangou and Murray1997; Stephan et al. Reference Stephan, Friston and Frith2009).
However, there are many challenges in imaging studies of human brain connectivity, and it is perhaps unsurprising that the area has its share of controversies and inconsistent findings (Spence et al. Reference Spence, Liddle, Stefan, Hellewell, Sharma, Friston, Hirsch, Frith, Murray, Deakin and Grasby2000; Vul et al. Reference Vul, Harris, Winkielamn and Pashler2009). Some of the challenges are technically specialized, such as the effects of small transient head movements on the estimation of functional connectivity from resting state functional magnetic resonance imaging (fMRI; Power et al. Reference Power, Barnes, Snyder, Schlaggar and Petersen2012), and will require specialist methodological efforts to resolve (Patel et al. Reference Patel, Kundu, Rubinov, Jones, Vertes, Ersche, Suckling and Bullmore2014). But some of the challenges are more general. For example, most network studies of psychiatric disorders have been based on small-medium sample sizes, that are often inadequately powered or with limited replicability (Kapur et al. Reference Kapur, Phillips and Insel2012). Published studies usually use structural MRI or resting-state fMRI, which limits cognitive or psychological interpretation of network properties. Another challenge is related to the macroscopic view of the brain provided by MRI, which will not be sufficient to understand the complex neurobiological mechanisms underpinning brain function and dysfunction (Bargmann & Marder, Reference Bargmann and Marder2013). Thus, there is a pressing need to link the macroscopic scale examined by neuroimaging data with more microscopically detailed knowledge about the cellular and molecular profiles of distinct brain regions in health and disease.
We here review results from some recent articles that have taken a novel approach to the analysis of neuroimaging connectivity data, which might provide a way forward to deal with some of these strategic issues in neuroimaging science. These studies have used publicly available datasets or published articles, working with meta-data in a similar way to traditional meta-analyses, but going beyond the goal of increasing the power of small studies. Instead, they have focused on incorporating new information into connectivity studies, e.g. integrating network models of the brain with data on cognitive task performance, clinical diagnosis, or cortical cytoarchitecture. We describe this novel approach as ‘meta-connectomics’, a term we define broadly as the use of different methods of network analysis in the context of previously published primary studies and/or publicly accessible databases, in an effort to understand more about brain network organization in health and disease. Specifically we will explore how recent studies have related brain network topology to normal cognitive function, to disorder-related abnormalities of local brain structure and function, and to cellular and transcriptional data on individual network nodes. For more general texts on connectomics and brain network analysis see Sporns (Reference Sporns2011) and Fornito et al. (Reference Fornito, Zalesky and Bullmore2016).
Although our focus will be on human neuroimaging, we should note that some of the earliest examples of meta-connectomics involved collation of primary tract-tracing studies of anatomical connectivity in mammalian cortex with a view to providing a whole-brain perspective. The use of injectable tracers, which are actively transported within neurons, has a long tradition in neuroscience to map the brain connectivity of a specific region. The primary tract-tracing literature comprised multiple individual studies describing the anatomical connections of a specific brain region. Several initiatives collated these meta-data, providing foundational results about the hierarchical organization of the visual system in the macaque (Felleman & Van Essen, Reference Felleman and Van Essen1991), and the complex ‘small-world’ topology of whole-brain networks in the macaque (Stephan et al. Reference Stephan, Kamper, Bozkurt, Burns, Young and Kotter2001) and the cat (Scannell et al. Reference Scannell, Blakemore and Young1995).
Linking brain connectivity to cognition using co-activation meta-analysis
Meta-analysis has been widely used in neuroimaging research, initially to combine studies reporting volumes of specific anatomical regions (Wright et al. Reference Wright, Rabe-Hesketh, Woodruff, David, Murray and Bullmore2000). From an early stage in neuroimaging history, the use of a common stereotactic coordinate system was advocated in order to make results comparable across studies (Fox, Reference Fox1995). This allowed the development of novel meta-analytic methods which summarized studies reporting voxel-level results (Eickhoff et al. Reference Eickhoff, Laird, Grefkes, Wang, Zilles and Fox2009; Radua et al. Reference Radua, Mataix-Cols, Phillips, El-Hage, Kronhaus, Cardoner and Surguladze2012). However, connectivity studies have not been widely meta-analysed due to the large variability in the methods used in the primary literature, which have precluded an adequate comparison between studies.
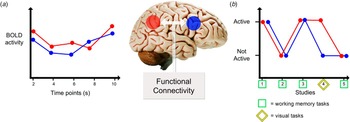
Although meta-analytic methods have not been able to resolve questions of statistical power in connectivity studies by combining multiple primary studies, meta-data has been used in alternative ways to address connectivity, particularly by analysis of functional co-activation. In order to understand co-activation studies, we need to look back at what we understand by functional brain connectivity. Functional connectivity has been defined as the ‘temporal correlation between remote neurophysiological events’ (Friston, Reference Friston1994). A typical functional connectivity study would thus measure the correlation or coherence between a pair of regional fMRI or electroencephalogram (EEG) time series recorded with the participant ‘at rest’ or during task performance (Fig. 1a ). Co-activation meta-analytic studies also infer functional connectivity between two areas by looking at their correlated activity. However, instead of focusing on correlated activity between time-points (the series of fMRI volumes typically acquired every 2 s), the co-activation method looks at correlated activity between primary studies in the published literature (Fig. 1b ). Unlike more traditional meta-analytic approaches, which mainly summarize the primary data in terms of the same variables as originally reported, co-activation meta-analyses use the relationship between activations measured locally in the primary data to infer connectivity between local regions in the brain functional co-activation network. In other words, whereas meta-analyses traditionally aim to answer with greater precision the same question that was already addressed by the primary studies, co-activation meta-analyses seek to answer a question that was not posed originally in any of the primary studies. Recent reviews have discussed more extensively the methodological issues in meta-connectivity analysis (Laird et al. Reference Laird, Eickhoff, Rottschy, Bzdok, Ray and Fox2013; Fox et al. Reference Fox, Lancaster, Laird and Eickhoff2014).
Functional connectivity and co-activation studies. (a) Functional connectivity is usually inferred from the correlation between two brain regions’ activities as registered in a resting-state functional magnetic resonance imaging (fMRI) scanning session. (b) Co-activation approaches infer functional connectivity from the frequency with which the two regions are reported to be active simultaneously during any task. As such, it is similar to traditional resting-state fMRI studies, in that it looks at the similarity in the activity between two regions. It differs in the time-frame used, where resting state looks at different volumes in one session, and co-activation looks at similarities across different published studies. The advantage of a co-activation approach is that one can infer the cognitive characteristics that elicit a functional connection between regions. In the figure shown, both regions were consistently co-activated during working memory tasks (squares), but not during visual tasks (diamond).

Resting-state fMRI is currently the preferred method for functional connectivity analyses because it is safe and relatively quick to acquire sufficient data (Birn et al. Reference Birn, Molloy, Patriat, Parker, Meier, Kirk, Nair, Meyerand and Prabhakaran2013). Resting-state experiments avoid the potential confounder of differential task performance in clinical populations (Greicius, Reference Greicius2008), and provide a whole-brain representation. However, resting-state functional connectivity is a design that by definition excludes controlled behaviour, so it is difficult to relate the network topology derived from resting-state data to cognitive functions. Co-activation networks have emerged to fill this knowledge gap. We can map the anatomical locations of activations (and de-activations) in the primary literature to a cortical parcellation template that corresponds to the nodes of a functional network. If two nodal regions, say left and right insula, are frequently co-activated across the primary literature, we can draw an edge or line between these nodes in a graphical representation of the functional co-activation network. Conversely, pairs of nodes that are not frequently co-activated will not be connected by an edge. Moreover, since the edges represent co-activation under cognitively specified experimental conditions, it is possible to identify edges and other topological features that are more-or-less specifically related to domains of cognitive function.
A seminal example of a meta-analytic study linking cognitive function to networks, pre-dating the recent growth of connectomic studies, identified a set of regions that were consistently deactivated across multiple cognitive tasks (Shulman et al. Reference Shulman, Fiez, Corbetta, Buckner, Miezin, Raichle and Petersen1997) and were later described as the default mode network (Shulman et al. Reference Shulman, Fiez, Corbetta, Buckner, Miezin, Raichle and Petersen1997; Raichle & Snyder, Reference Raichle and Snyder2007). Following a similar line, subsequent methodological work focusing on co-activation patterns has been able to use task-based studies to build whole-brain functional connectivity networks with clear cognitive labels. For example, co-activation analyses have explored the connectivity patterns of brain structures including the anterior cingulate (Koski & Paus, Reference Koski and Paus2000), amygdala (Robinson et al. Reference Robinson, Laird, Glahn, Lovallo and Fox2010), insula (Uddin et al. Reference Uddin, Kinnison, Pessoa and Anderson2014), dorsolateral prefrontal cortex (Cieslik et al. Reference Cieslik, Zilles, Caspers, Roski, Kellermann, Jakobs, Langner, Laird, Fox and Eickhoff2013) and dorsomedial prefrontal cortex (Eickhoff et al. Reference Eickhoff, Laird, Fox, Bzdok and Hensel2014), supplementary motor area (Eickhoff et al. Reference Eickhoff, Bzdok, Laird, Roski, Caspers, Zilles and Fox2011), fusiform gyrus (Caspers et al. Reference Caspers, Zilles, Amunts, Laird, Fox and Eickhoff2014), caudate (Robinson et al. Reference Robinson, Laird, Glahn, Blangero, Sanghera, Pessoa, Fox, Uecker, Friehs, Young, Griffin, Lovallo and Fox2012), nucleus accumbens (Cauda et al. Reference Cauda, Cavanna, D'Agata, Sacco, Duca and Geminiani2011), pulvinar (Barron et al. Reference Barron, Eickhoff, Clos and Fox2015), and the basal ganglia (Postuma & Dagher, Reference Postuma and Dagher2006). Specific predictions from co-activation meta-analytic approaches could then be tested in single-session experiments (Robinson et al. Reference Robinson, Laird, Glahn, Lovallo and Fox2010). Meta-data can thus provide a prior model for the links between network organization and cognition, which can then be tested experimentally by more focused activation paradigms.
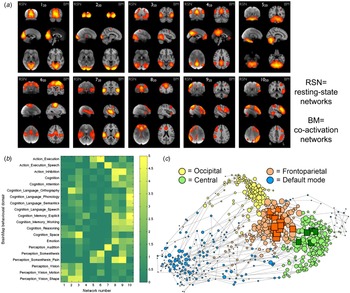
As well as describing cognition-related connectivity patterns of specific brain regions, studies have used co-activation approaches to inform more extensive cognitive networks. For example, meta-data have been used to build specific models of default-mode network function (Laird et al. Reference Laird, Eickhoff, Li, Robin, Glahn and Fox2009); and have provided novel insights about the so-called resting-state networks (RSNs) obtained from independent component analyses (ICA; De Luca et al. Reference De Luca, Beckmann, De Stefano, Matthews and Smith2006). ICA typically finds specific activity patterns each of which is expressed by an anatomically distributed set of regions comprising an RSN. Intriguingly, the organization of a functional network derived from co-activation analysis closely corresponds to the RSNs derived from analysis of resting-state fMRI time series (Fig. 2a ; Smith et al. Reference Smith, Fox, Miller, Glahn, Fox, Mackay, Filippini, Watkins, Toro, Laird and Beckmann2009). In other words, for every RSN, there is an anatomically homologous network identified by meta-analysis of co-activation, which has allowed cognitive labels to be attached to specific RSNs (Fig. 2b ; Smith et al. Reference Smith, Fox, Miller, Glahn, Fox, Mackay, Filippini, Watkins, Toro, Laird and Beckmann2009; Laird et al. Reference Laird, Fox, Eickhoff, Turner, Ray, McKay, Glahn, Beckmann, Smith and Fox2011).
Cognition and the brain's functional network organization. (a) Independent component analysis of co-activation data (right side of each individual panel) defines networks corresponding closely to the RSNs obtained from resting-state functional magnetic resonance imaging (left side of individual panels). (b) Analyses of the cognitive characteristics of the tasks showing co-activation in the above networks allowed characterization of the cognitive aspects of resting-state networks. Color scale shown is representing arbitrary units, in which each row has been normalized so that its mean value is one. ((a) and (b) reproduced from (Smith et al. Reference Smith, Fox, Miller, Glahn, Fox, Mackay, Filippini, Watkins, Toro, Laird and Beckmann2009), with permission). (c) Graph theoretical analysis of functional co-activation data demonstrated a similar organization of cognitively specialized network modules, here depicted in groups with different colours, and in a spatial arrangement such that frequently co-activated nodes are located in close proximity to each other. Connecting these specialized modules is a more domain-general group of central and highly connected regions forming a rich club (nodes marked as squares) (reproduced from Crossley et al. Reference Crossley, Mechelli, Vertes, Winton-Brown, Patel, Ginestet, McGuire and Bullmore2013, with permission).

The RSNs of ICA are conceptually related to the topological modules of graph theory. A module defines a subset of nodes that are densely connected to each other but sparsely connected to nodes in any other module of the network (Bullmore & Sporns, Reference Bullmore and Sporns2009). It has been shown that modules correspond to RSNs defined by ICA (Crossley et al. Reference Crossley, Mechelli, Vertes, Winton-Brown, Patel, Ginestet, McGuire and Bullmore2013). These highly segregated building blocks of the functional brain network are also linked together by a group of highly connected hub regions, forming a so-called rich club (van den Heuvel & Sporns, Reference van den Heuvel and Sporns2011). Co-activation analysis demonstrated that this group of highly connected regions was less cognitively specialized than the more peripheral modules (Crossley et al. Reference Crossley, Mechelli, Vertes, Winton-Brown, Patel, Ginestet, McGuire and Bullmore2013). Echoing Fodor (Fodor, Reference Fodor1983), the brain functional network thus seems to be organized into cognitively specialized modules, which are linked by a domain-general club of highly connected hub regions (Fig. 2c ).
Defining the role of a brain region by its interactions
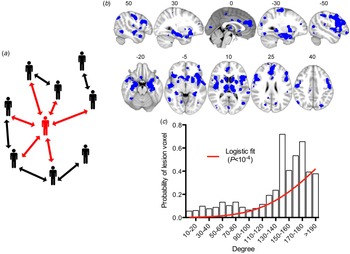
One important idea from network science that has recently translated to neuroscience is that the role of a local node can be quantitatively defined in terms of its topological profile of connections to other nodes in the system (Bullmore & Sporns, Reference Bullmore and Sporns2009). Using graph theory, complex systems are simply rendered as a collection of nodes linked by edges; and the same graphical representation can be used to represent almost anything, from people and their friendship links, to brain regions and their axonal connectivity. From this theoretical framework, network science has provided a simple insight: the web of connections provides or constrains the functional opportunities available to a specific node (Wasserman & Faust, Reference Wasserman and Faust1994). For example, friendship ties in a social network might facilitate exchange of resources between subjects. People who have more friends (or are more ‘central’ in network terms) will be more likely to borrow money from other people than those (more peripheral) people with fewer friends. Similarly, they will be more likely to learn some new information that enters the social system (Fig. 3a ). The translation of this idea into brain sciences was relatively straightforward: one could study how the network position in the brain conditions or constrains the appearance of certain neural processes, such as pathological abnormalities of brain structure or function.
The network position of a node determines its role. (a) Social network analyses quantify the intuition that a central node or person (highlighted in red) with many connections would have more immediate access to many resources in the network, whether this is borrowing money or accessing information. However, if the most central agent loses contact with the rest of the network this can lead to disintegration of the network as a whole and the isolation of more peripheral agents. (b) Meta-analytic pooling of structural MRI studies from 26 different brain disorders demonstrated the existence of certain regions where abnormalities were consistently reported. (c) The probability of a brain region being “lesioned”, on average over all disorders, significantly increased as a logistic function of the degree of the corresponding regional node in the normative connectome. [Panels (b) and (c) from Crossley et al. Reference Crossley, Mechelli, Scott, Carletti, Fox, McGuire and Bullmore2014, with permission.]

Several studies have now shown that the network location of pathological lesions is not trivial. For example, diffusion tensor imaging (DTI) studies in schizophrenia have shown that although abnormalities are widespread in the brain, they are concentrated in the connections of the high degree hub regions in schizophrenia (van den Heuvel et al. Reference van den Heuvel, Sporns, Collin, Scheewe, Mandl, Cahn, Goni, Hulshoff Pol and Kahn2013). The topological role of lesions might have prognostic value, as has been shown for localized brain injuries, where lesions of nodes spanning different modules cause larger network reconfiguration and more severe cognitive impairments (Gratton et al. Reference Gratton, Nomura, Perez and D'Esposito2012; Warren et al. Reference Warren, Power, Bruss, Denburg, Waldron, Sun, Petersen and Tranel2014). The position in the network might also suggest a specific pathophysiological process, as has been proposed for Alzheimer's disease, where the close agreement between disease progression and the connections of the brain network fits well with a trans-synaptic pathogenic mechanism (Raj et al. Reference Raj, Kuceyeski and Weiner2012; Zhou et al. Reference Zhou, Gennatas, Kramer, Miller and Seeley2012).
Meta-analysis has contributed a more general view on brain disorders and how they are related to underlying network organization. The hypothesis that meta-analysis has addressed is whether the brain's network structure modulates to some extent how different diseases affect the brain. This implies that there should be some areas of the brain that, due to the topological position they have in the network, are rendered more vulnerable, more symptomatic, or both; and therefore should be more frequently implicated in brain disorders. Although this hypothesis could be tested using a single scanner and many patients with different diagnoses, the use of meta-data provides advantages in terms of the scale and scope of the disorders included. We recently used meta-data from 392 studies including 9874 patients and 11 502 healthy controls to show that there is an extensive anatomical overlap between structural abnormalities or MRI ‘lesions’ found in 26 brain disorders (Crossley et al. Reference Crossley, Mechelli, Scott, Carletti, Fox, McGuire and Bullmore2014) (Fig. 3b ), with a similar result reported in another study of a subgroup of psychiatric disorders (Goodkind et al. Reference Goodkind, Eickhoff, Oathes, Jiang, Chang, Jones-Hagata, Ortega, Zaiko, Roach, Korgaonkar, Grieve, Galatzer-Levy, Fox and Etkin2015). Furthermore, we showed that these structural abnormalities were concentrated in highly connected brain regions, as theoretically predicted by the brain's network structure and its response to computationally simulated lesions (Fig. 3a , c ). Importantly, different subsets of hubs seem to be affected in different disorders, e.g. frontal lobe hubs were most impacted by schizophrenia and temporal lobe hubs were most impacted by Alzheimer's disease. The specific pathophysiology of a disorder presumably determines which specific hubs or modules are affected (Seeley et al. Reference Seeley, Crawford, Zhou, Miller and Greicius2009), with disorders traditionally classified as neurological displaying a greater similarity in their structural changes than psychiatric disorders (Crossley et al. Reference Crossley, Scott, Ellison-Wright and Mechelli2015b ).
Other studies have explored brain functional data using this kind of network mapping approach. For example, task-related deactivations are local phenomena that frequently accompany task-related activations. By mapping deactivations across 110 contrasts from 67 studies in healthy subjects, we showed that the dyadic pair of an activation in one region accompanied in the same task by deactivation of another region frequently spanned modules and linked rich club to more peripheral nodes (Crossley et al. Reference Crossley, Mechelli, Vertes, Winton-Brown, Patel, Ginestet, McGuire and Bullmore2013). This suggests that deactivations define the boundaries between modules, and between the core and the periphery, in the community structure of human brain functional networks.
We applied a similar approach to study abnormal functional activations. We studied regions that were consistently under-activated (or over-activated) by task performance in patients with schizophrenia compared to controls across 723 different contrasts from 314 primary studies. We found that over-activations were located close to under-activations in topological space, but not in physical space, and both under- and over-activations were concentrated in high degree hub nodes of the normative connectome. This was in line with the compensatory theory of brain functioning, whereby activation of high-degree and cognitively flexible hub regions would be expected to compensate for topologically neighbouring hubs that were pathologically damaged and thus failed to activate normally during task performance (Crossley et al. Reference Crossley, Mechelli, Ginestet, Rubinov, Bullmore and McGuire2015a ).
Microscopic substrates of large-scale networks
Meta-connectomics has also been used to explore the microscopic architecture of specific points in the network. Studying the microscopic characteristics of brain regions and their relationship to the macroscopic organization of the brain has a long tradition in neuroscience (Zilles & Amunts, Reference Zilles and Amunts2010). More recently, studies have directly linked measures of cytoarchitectonics or gene expression to the topological roles of the corresponding node in the connectome.
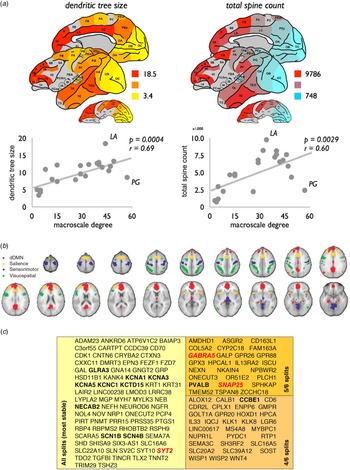
An example of such an analysis was based on viral tract tracing data in the macaque (Scholtens et al. Reference Scholtens, Schmidt, de Reus and van den Heuvel2014). This study used several sources of published data to relate the macroscopic network properties of the macaque brain to histologically defined variations of its brain regions. They showed that regions of the network with high degree (high macroscopic connectivity) had greater dendritic branching of pyramidal neurons in cortical layer III, as well as more dendritic spines: two possible indicators of a greater number of synapses (high microscopic connectivity) in network hubs (Fig. 4a ). The same group has recently used a similar approach to relate macroscopic characteristics of the human brain (as defined by an analysis of the structural network of the Human Connectome Project data; Van Essen et al. Reference Van Essen, Smith, Barch, Behrens, Yacoub and Ugurbil2013), with the microscopic architecture of different regions defined by the work by Von Economo & Koskinas from 1925 (van den Heuvel et al. Reference van den Heuvel, Scholtens, Feldman Barrett, Hilgetag and de Reus2015). It was shown that the size of cortical neurons in layer III (and not in other layers) was positively correlated with the macroscopic connectivity of the region, with hub regions having larger layer III neurons. This association was independent from the number of neurons or the width of the layer. In line with their previous findings in the macaque, the authors argued that the size of layer III neurons is correlated with dendritic branching and synaptic density. As such, both of these studies point towards a more complex cytoarchitectonic structure in highly central regional nodes of the connectome, which would allow for a higher capacity to integrate information. This insight could provide a link between network theories suggesting dysfunctional hubs in schizophrenia (Crossley et al. Reference Crossley, Mechelli, Ginestet, Rubinov, Bullmore and McGuire2015a ) and neuropathological findings showing smaller cortical neuronal size in patients with schizophrenia (Harrison, Reference Harrison1999), particularly in layer III (Rajkowska et al. Reference Rajkowska, Selemon and Goldman-Rakic1998).
Relating cellular and molecular characteristics to macroscopic brain network organization. (a) Complexity of the neurons in layer III of the macaque, measured by the size of the dendritic tree and spine count, was correlated with the degree centrality of corresponding regional nodes of the macroscopic connectome (reproduced from Scholtens et al. Reference Scholtens, Schmidt, de Reus and van den Heuvel2014, with permission). (b) Human brain regions that are functionally connected to form resting state networks in fMRI data also have a high similarity in their transcription profiles. Organized correlated activity across the four networks described in (b) follows closely the transcription of the subset of genes shown in (c). Genes highlighted in bold code ion channels, and those in italic code neurotransmitters. All genes are grouped according to reliability of the data referred to as ‘splits’ in the original manuscript (see Richiardi et al. Reference Richiardi, Altmann, Milazzo, Chang, Chakravarty, Banaschewski, Barker, Bokde, Bromberg, Buchel, Conrod, Fauth-Buhler, Flor, Frouin, Gallinat, Garavan, Gowland, Heinz, Lemaitre, Mann, Martinot, Nees, Paus, Pausova, Rietschel, Robbins, Smolka, Spanagel, Strohle, Schumann, Hawrylycz, Poline and Greicius2015 for details; reproduced with permission).

Alongside cytoarchitectonic correlates of macroscopic level of connectivity (degree or strength), it is also possible to explore the relationship between cytoarchitecture and modular organization (van den Heuvel et al. Reference van den Heuvel, Scholtens, Feldman Barrett, Hilgetag and de Reus2015). As previously described, modules are groups of highly interconnected regions that are also sparsely connected to nodes in other modules. Furthermore, modules are likely specialised in specific cognitive procedures. Van den Heuvel et al. (Reference van den Heuvel, Scholtens, Feldman Barrett, Hilgetag and de Reus2015) showed that regions within the same module had more similar cytoarchitectonic profiles than those from different modules. One could argue that regions involved in a specific cognitive task may share a similar, functionally specific cytoarchitectonic architecture.
Likewise the IMAGEN consortium explored the molecular mechanisms that underpin human fMRI network organization (Richiardi et al. Reference Richiardi, Altmann, Milazzo, Chang, Chakravarty, Banaschewski, Barker, Bokde, Bromberg, Buchel, Conrod, Fauth-Buhler, Flor, Frouin, Gallinat, Garavan, Gowland, Heinz, Lemaitre, Mann, Martinot, Nees, Paus, Pausova, Rietschel, Robbins, Smolka, Spanagel, Strohle, Schumann, Hawrylycz, Poline and Greicius2015), particularly focusing on RSNs. They combined neuroimaging data with data from the Allen Brain Atlas database, which includes detailed transcription profiles of multiple brain regions in the healthy brain (Hawrylycz et al. Reference Hawrylycz, Lein, Guillozet-Bongaarts, Shen, Ng, Miller, van de Lagemaat, Smith, Ebbert, Riley, Abajian, Beckmann, Bernard, Bertagnolli, Boe, Cartagena, Chakravarty, Chapin, Chong, Dalley, Daly, Dang, Datta, Dee, Dolbeare, Faber, Feng, Fowler, Goldy, Gregor, Haradon, Haynor, Hohmann, Horvath, Howard, Jeromin, Jochim, Kinnunen, Lau, Lazarz, Lee, Lemon, Li, Li, Morris, Overly, Parker, Parry, Reding, Royall, Schulkin, Sequeira, Slaughterbeck, Smith, Sodt, Sunkin, Swanson, Vawter, Williams, Wohnoutka, Zielke, Geschwind, Hof, Smith, Koch, Grant and Jones2012). Briefly, samples from different brain regions of six healthy donors were obtained, and microarray data on multiple gene transcription products were analysed. Using this database, Richiardi et al. (Reference Richiardi, Altmann, Milazzo, Chang, Chakravarty, Banaschewski, Barker, Bokde, Bromberg, Buchel, Conrod, Fauth-Buhler, Flor, Frouin, Gallinat, Garavan, Gowland, Heinz, Lemaitre, Mann, Martinot, Nees, Paus, Pausova, Rietschel, Robbins, Smolka, Spanagel, Strohle, Schumann, Hawrylycz, Poline and Greicius2015) found that the transcription profiles of regions within well-known RSNs, namely the default-mode, salience, visual and sensorimotor networks, were more similar than expected by chance (Fig. 4b ). The similarity was particularly driven by a subset of 136 genes enriched for ion channels (displayed in Fig. 4b ). Furthermore, it was shown in independently acquired genetic and imaging data in adolescents, that polymorphisms in this set of genes were also related to network activity.
Future perspectives of meta-connectomics in psychiatry
Traditional meta-analyses have had a big impact in neuroimaging studies and other fields by pooling publicly available data to increase their statistical power. We here discussed how the field of meta-connectomics has taken the use of publicly available data one step beyond, by combining available information with network models of the brain. This ‘meta-analytic pivot’, with a new focus on integration of multi-modal data rather than simply maximising statistical power, is providing robust and novel insights into the brain, with some of the findings having direct relevance to our understanding of psychiatric disorders. As we have illustrated here, meta-connectomics has been used to clarify the cognitive functions associated with specific aspects of network topology, to link the anatomical locations of pathological lesions to their topological roles, and to relate nodal topology to the cellular and genomic profiles of brain regions.
However, we also have to be aware of the limitations of meta-connectomic approaches, and try to control for them. By definition, meta-connectomics works with published data or available datasets. As such, the most important limitation is related to the constraints and quality of the primary data. For example, meta-analysis can suffer from publication bias (Egger et al. Reference Egger, Smith and Sterne2001), where only significant results (or datasets) become available. It is therefore important for the growth and rigor of meta-connectomics that there have been some significant and ongoing efforts to make large primary databases available for this purpose (Mennes et al. Reference Mennes, Biswal, Castellanos and Milham2013; Van Horn & Gazzaniga, Reference Van Horn and Gazzaniga2013). Imaging databases such as the BrainMap database (Fox & Lancaster, Reference Fox and Lancaster2002; Laird et al. Reference Laird, Lancaster and Fox2005), which has been collating primary neuroimaging studies since 1987, continue to grow; new resources such as the Allen Brain Atlas are being developed and freely provide novel and high-quality sources of information on brain connectivity, cytoarchitectonics and gene expression.
As a way of exploiting large existing datasets to achieve a more integrated understanding of the human connectome and its mechanistic substrates, meta-connectomics is likely to prove of increasing value in clarifying the brain network abnormalities associated with a wide range of psychiatric and neurodegenerative disorders.
Acknowledgements
PTF is supported by a National Institute of Health (NIH) award (R01MH074457).
Declaration of Interest
ETB is employed half-time by the University of Cambridge and half-time by GlaxoSmithKline (GSK); he holds stock in GSK.