1 Adequate retirement savings
In many Western countries, pension systems are affected by demographic aging (OECD, 2013) and reforms are needed to keep the system sustainable and adequate. A good pension system protects people against poverty and smoothen people's income over their life-cycle. To achieve these goals countries organize their pension system in very different ways. Considerable effort has been made to compare pension systems across countries and to identify strengths and weaknesses of different systems (Allianz, 2011; EC, 2012; Mercer, 2013; OECD, 2013). In these comparisons the current Dutch pension system compares very favorably with regard to pension adequacy.Footnote 1 This is due to a relatively high flat-rate public pension, but also to a high replacement rate for a fictitious person who earns a median income during his whole career and accumulates a pension for 45 years.Footnote 2 In practice, however, there are few Dutch people who actually accumulate a pension for the full 45 years. The question arises whether adequacy is still that high when we base adequacy on pension rights that people actually accumulate in the current system. This paper therefore examines the public and private pension rights that households have accumulated. We also investigate the role of private savings and housing wealth could play during retirement. This gives us necessary integrated results regarding the available resources to finance retirement.Footnote 3
To be able to evaluate adequacy we need to know how much resources retirees need. A variety of standards can be chosen against which to judge adequacy. The life-cycle hypothesis (LCH) is the main theoretical framework for assessing the adequacy of savings (Banks et al., Reference Banks, Blundell and Tanner1998). In this model, consumption is not determined by current income, but by (expected) lifetime resources. According to the LCH, it is optimal for individuals or households to save (or borrow) to the extent that, after discounting, the marginal utility of consumption is smoothed over the life cycle. However, the model does not provide straightforward predictions on how much people save in various stages of their lives. Households with identical lifetime incomes might choose different levels of savings for a number of reasons – including uncertainty over future incomes and over future needs, different degrees of risk aversion, variations in time preference rates, the possible existence of liquidity constraints and bequest motives. The model is therefore consistent with a substantial degree of inequality in saving.
Several studies have used the life-cycle model to analyze retirement readiness. Bernheim et al. (Reference Bernheim, Skinner and Weinberg2001) found a decline in consumption at retirement that is highly correlated with the household income replacement ratio. Households appear to discover that their resources after retirement are insufficient to maintain their standards of living, and adjust their consumption downward accordingly. In other words, people do not save enough to smooth their consumption. Engen et al. (Reference Engen, Gale, Uccello, Carroll and Laibson1999) argued that smoothing marginal utility of consumption may have a different impact on saving behavior than smoothing consumption as such. They developed a stochastic life-cycle model in which people save both for retirement and for precautionary reasons, including uncertain lifespan. They conclude that savings are adequate for a majority of households. Scholz et al. (Reference Scholz, Seshadri and Khitatrakun2006) developed an extensive stochastic life-cycle model that also incorporates government transfers and taxes, as well as medical expenses. They found that the model provides a good representation of households' savings behavior in the USA. Fewer than 20% of the households save less than their optimal levels, and the extent of undersaving is generally small.
A common element of these approaches is that people should save enough to maintain their living standards after retirement. This does not imply that consumption after retirement should be equal to consumption before retirement. Consumption requirements are likely to fall when people retire (Scholz et al., Reference Scholz, Seshadri and Khitatrakun2006). The most commonly used measure of relative well-being after retirement is the income replacement rate. This is the ratio of some post-retirement income (from pensions, annuitized wealth holdings and so forth) to some pre-retirement income (such as earnings during the years preceding retirement, or average earnings during the career). Replacement rates are an important indicator of pension systems. (OECD, 2013), for example, shows replacement rates for fictitious persons in several countries with median earnings throughout their working life. Boskin and Shoven (Reference Boskin and Shoven1987) argued that a replacement rate of less than unity is consistent with the life-cycle theory. Haveman et al. (Reference Haveman, Holden, Romanov and Wolfe2007) indicated that a widely accepted standard in the literature is having a retirement income equal to or greater than 70% of previous earnings. This is regarded as the income necessary to maintain preretirement consumption. Binswanger and Schunk (Reference Binswanger and Schunk2012) investigated minimum acceptable income replacement rates using surveys in the USA and the Netherlands, and found that these rates range from 95% to 45% across income quintiles in the USA, and from 75% to 60% across income quintiles in the Netherlands. In this study, we also use (expected) replacement rates as a key indicator of savings adequacy and retirement readiness. The standard is set at 70%, but we can also show the results for alternative replacement rates. A second approach is to set a social standard for adequacy. In this approach, retirement income is considered adequate when it is equal to or greater than poverty levels of income (Haveman et al., Reference Haveman, Holden, Romanov and Wolfe2007). There are three ways of setting the poverty line: an absolute standard, a relative standard and a subjective standard (Caminada et al., Reference Caminada, Goudswaard and Koster2012). The US poverty line is based on an absolute standard, which remains fixed over time in real terms. The EU-agreed relative poverty line is set at a fixed percentage of the median income in each country. The at-risk-of-poverty rate is defined as the share of persons with an equivalized disposable income below 60% of the national median equivalized disposable income. In several OECD studies, the poverty line is set at 50% of the median equivalized disposable income. The subjective poverty line is based on respondents' answers to questions regarding what they consider to be an adequate standard of living. Walker (Reference Walker1987) introduced the consensual budget standards method, where members of the public together with some experts reach agreement (consensus) about what people need as a minimum and then draw up budgets to meet those needs. Hoff et al. (Reference Hoff, Van Gaalen, Soede, Luten, Vrooman and Lamers2009) applied this method for the Netherlands and found, for example, that in 2008 a single man of age 75 needed about 800 euro per month. De Bresser and Knoef (Reference De Bresser and Knoef2014), on the other hand, show that half of the respondents in a representative Dutch household panel expect that they would need between 1.095 and 1.825 euros per month to meet their own minimal expenditure needs (in 2008 euros and equivalized to a single person household).
Another issue is that resource adequacy at the time of retirement does not necessarily mean that incomes are adequate throughout a person's remaining lifetime. Resources may increase during retirement – due to additional asset accumulation, bequests and so forth. But resources may also deteriorate during retirement – due to cuts in pension benefits, for example, or bad investments or increasing uncovered health costs. Haveman et al. (Reference Haveman, Holden, Romanov and Wolfe2007) therefore examined the resource adequacy at two points in time: at the time of retirement and 10 years later. VanDerhei and Copeland (Reference VanDerhei and Copeland2010) also measured retirement readiness at several points in time. They argued that replacement rate measures are useful, but that it is difficult to accurately integrate the concepts of longevity risks, post retirement investment risks and uninsured healthcare risks. They follow an approach in which a household is considered to run short of money if its resources are not sufficient to meet minimum retirement expenses plus uncovered expenses from the nursing home and healthcare. Expenses are derived from the Consumer Expenditure Survey, based on actual observed expenditure of the elderly for different family sizes and income levels. This approach has its advantages, but the problem is that observed consumption patterns of retirees are constrained by their resources. If their resources fall short, their observed expenses may not reflect their real needs in retirement. Consequently, the method used by VanDerhei and Copeland cannot provide the (only) benchmark against which to judge the adequacy of resources.
This paper uses a large administrative data set to scrutinize the resources that households of different generations have accumulated to finance retirement. This is in stark contrast with the approach taken in OECD (2013) where a fictitious person is analyzed. To develop a more comprehensive view on pension adequacy not only public and private pensions, but also private savings and housing wealth are taken in to account. Private savings and housing wealth are annuitized, taking into account household age, age differences between household members, and economies of scale. Furthermore, because of the large administrative data set, we can draw credible conclusions for specific vulnerable groups. To investigate the bandwidth of the results, we investigate several scenarios as to what will happen from the time of observation until retirement. This multi-pillar approach is highly applicable to other countries, although the implementation of the approach may be limited by the availability of country-specific data.
When we only consider public and occupational pension income we find a median gross and net replacement rate of 71% and 84%, respectively. Private savings and housing wealth can play a substantial role to increase adequacy, but even when these are taken into account about 31% of the households do not reach a gross replacement rate of 70%. The results are fairly comparable to the results of Crawford and O'Dea (Reference Crawford and O'Dea2012), who perform a comparable type of analysis for the UK. So, although the pension system of the UK achieves a much lower international rank on adequacy than the Dutch pensions system,Footnote 4 the results are fairly comparable when we consider adequacy on the basis of real pension savings. This shows that that we should be cautious in drawing conclusions about the performance of pension systems across countries on the basis of indices that use fictitious replacement rates.
The structure of the paper is as follows. Section 2 describes the Dutch pension system and Section 3 introduces the data. Section 4 shows descriptive statistics of income and wealth in 2008 and Section 5 describes our method. Section 6 predicts financial resources during retirement and replacement rates. Section 7 focuses on several vulnerable groups, such as self-employed households, immigrants and households on social assistance. Section 8 analyzes the sensitivity of the results with regard to assumptions about indexation, real rates of return, housing prices and the depletion of housing wealth. Finally, Section 9 concludes.
2 The Dutch pension system
As in many European countries, the Dutch pension system consists of three pillars. The first is a pay-as-you-go system and involves a flat-rate public pension benefit for all residents as from the statutory retirement age of 65 onwards. The level of the public pension is linked to the net minimum wage and depends on the number of years that a person has resided in the Netherlands. Couples who have lived in the Netherlands between the ages of 15 and 65 each receive 50% of the minimum wage, and single pensioners receive 70% of the minimum wage. For people with a low pension income and almost no wealth, the first pillar is topped up with social assistance to guarantee a social minimum.
Several OECD countries have recently increased their statutory pension age, or will do so in the coming decades (OECD, 2013). In the Netherlands, the statutory retirement age increased by one month as of January 2013, and will gradually increase to 66 in 2019 and 67 in 2023. It has been proposed to increase the statutory retirement age more rapidly: to 66 in 2018 and 67 in 2021.
The Dutch second pillar consists of capital-funded occupational pensions, of which the primary responsibility lies with employers and employees. Occupational pensions in the Netherlands have a mandatory nature, such that 90% of all employees have a pension scheme with their employer. Occupational pensions mainly consist of defined-benefit pension plans. Until the beginning of the 21st century, most pension plans aimed to pay a pension income of 70% of final gross wage from the age of 65 onwards if an employee had worked fulltime for at least 40 years. From 2003 onwards, pension funds have lowered their ambition, and they now aim to pay 70% of the average career salary, instead of 70% of the final gross salary (including public pension benefits). The recent financial crisis has shown that the Dutch pension system is vulnerable to shocks in financial markets. Many pension funds have had difficulties achieving their indexation ambitions, and several funds recently were even compelled to cut nominal pension rights. Also, annual tax-favored pension accruals have been reduced from 2.25% to 2.15% and will be reduced further to 1.875%. This means that the percentage by which pensions are built up each year is reduced and that one has to work more years to achieve the same pension income. Furthermore, the age that forms the basis for the determination of the pension premiums increased from 65 to 67 as of 2014. Early retirement will consequently become financially less attractive, and the pension income of future retirees is likely to become less generous.
The third pillar is formed by private individual pension products (such as life annuities) and other private savings. Until a major tax reform in 2001, everyone could buy life annuities at tax beneficial terms up to a certain limit (e.g. premiums up to 2,808 euro were fiscally attractive in the year 2000). After the tax reform, this limit was reduced in 2002 to 1,069 euro, and only the self-employed and individuals with a gap in their pension entitlements were allowed to buy life annuities at fiscally attractive terms up to higher amounts. Other pillars are housing wealth or an extension of working life on a part-time or fulltime basis. People who have amortized part of their mortgage benefit from lower housing costs during retirement. Although not commonly done by the current generation of elderly, people may move or use reverse mortgages to deplete housing wealth.
3 Data
To estimate the extent of financial resources available to the current labor force upon entering retirement, we combine administrative data with assumptions as to what will happen from the time of observation until the day of retirement. This section describes the data that are used. We combine as many wealth components as possible in evaluating the retirement readiness of the Dutch population: public pension rights (PAYG), occupational pension rights, individual annuity insurances, housing wealth and private savings. The most recent data about occupational pension rights come from 2008. Therefore, a representative sample of households in 2008 forms the basis of all of our data.
To assess the pension rights accumulated in public old-age pensions, we take administrative data from the 2008 ‘Dutch statistics on public pension entitlements’ (in Dutch: Algemene Ouderdomswet aanspraken totaal, AOWA). These data contain information about the public pension entitlements that have been built up by people between the ages of 15 and 64.
Concerning occupational pensions, we use of the 2008 ‘Dutch statistics on occupational pension entitlements’ (PA). These data provide information about the occupational pension entitlements that have been built up by people between the ages of 15 and 64. This information is gathered by Statistics Netherlands from occupational pension funds in the Netherlands. Pension funds deliver data to Statistics Netherlands about the annuity that participants would receive in case they remain employed in their current job with their current wage rate until the statutory retirement age of 65. Not all pension funds have provided data to Statistics Netherlands, but the aggregate amount of pension entitlement in the Netherlands is available from the Dutch Central Bank (DNB), and Statistics Netherlands used this information, together with employment data, to correct the individual pension entitlements (Eenkhoorn and Zijlmans, Reference Eenkhoorn and Zijlmans2010). After a divorce, occupational pension benefits are often partly paid out to the ex-partner.Footnote 5
To assess information about income and other wealth assets, administrative data were taken from the 2008 Dutch Income Panel data (IPO), with wealth information from the tax office, banks and social security administrations. Banks have to deliver data about savings accounts that exceed 500 euro or yield interest of more than 15 euro a year. Checking accounts are not included. Furthermore, the data contain information on stocks, bonds and wealth from an own business. With regard to housing, the data include information about the value of the house and the mortgage, the value of secondary houses and some moveable properties such as houseboats.
Whereas the AOWA and PA data set contain information about the entire Dutch population, IPO contains a representative sample of Dutch households that are followed over time. We therefore merge AOWA and PA to the IPO sample. Major advantages of these administrative data are a very low attrition rate and a high level of representativeness. Attrition takes place only because of immigration or death. Another advantage of administrative data is that the observed variables are measured with a high degree of accuracy. In this progress report, we merged only the 2008 data, since this is the most recent year for which AOWA and PA are available.
The data have some shortcomings. They do not, for example, provide information about assets accumulated in personal defined-contribution pension plans (third pillar). Data are available, however, regarding contributions made to third pillar pension plans as from 1989, which provides information about the wealth accumulated in third pillar pension plans (Caminada, Reference Caminada2000). Furthermore, young generations in the Netherlands often seek to avoid taxes through an endowment mortgage or an investment-based mortgage. This means that the mortgage is not paid off during the term of the mortgage. Instead, money is paid to an insurance company or a bank, such that (part of) the mortgage can be paid off at the end of the term. The money accumulated at the insurance company or at the bank is not observed by the tax office, and is not available in the data.Footnote 6 Also, we do not know which households own an endowment or investment-based mortgage.
4 Descriptive analysis
This section describes current income (Section 4.1) and wealth (Section 4.2) observed for several age groups.
4.1 Income
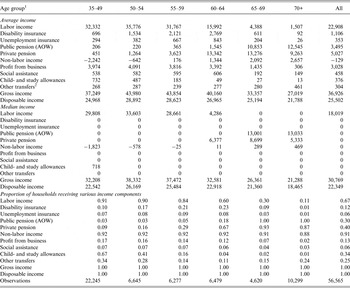
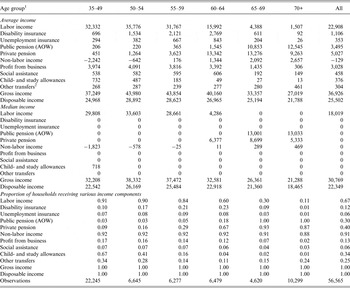
Table 1 describes gross equivalized household income and the proportion of households receiving income from the various income sources in 2008. Income is measured in 2010 euros using the consumer price index. In order to standardize household income to a single-person household, we use the equivalence scale provided by Statistics Netherlands (Siermann et al., Reference Siermann, Van Teeffelen and Urlings2004), which assumes that two adults need 37% more income than a single adult to achieve the same welfare level.Footnote 7 The households' key person, who is randomly drawn from the Dutch population and who is followed over time in the IPO data set, determines the age category of the household.
Household income, 2008
1 Equivalized household income in 2010 euros. The age of the key person in the households determines the age category of the household.
2 Rental house allowance, home owner grant, alimony and study costs allowance.
As expected, labor income is the most important income component and is highest for people between the ages of 50 and 54. Average disability and unemployment benefits increase until the statutory retirement age of 65. This growth is a combination of age, period and cohort effects, which cannot be distinguished. Furthermore, older individuals have longer unemployment durations on average, which lead to higher unemployment benefits per year. Public pension benefits are received as from the age of 65, so before the age of 65 we only observe public pension benefits of household members that are 65 or older (e.g. partners or parents in the same household). In the age group 60–64, early retirement income becomes important and seems to replace labor income at least partly. Non-labor income includes interest received from bank accounts, dividends from stocks, income from bonds, imputed rent, mortgage interest, and income from other property such as second houses. Using imputed rent (as defined in IPO) and mortgage interest, we take into account that those who paid off their mortgage take advantage of low housing expenses. Mortgage interest explains the negative values for non-labor income in the young age groups. Among the 70+ population, total gross income is relatively low, which may be related to cohort effects. Finally, since the income distribution is positively skewed, mean income is higher than median income, which means that higher deciles earn a proportionally larger share of total income.
4.2 Wealth
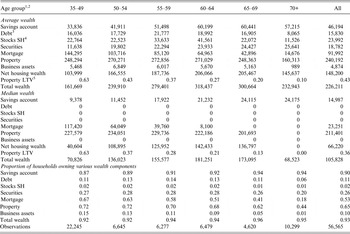
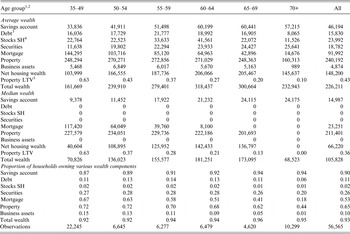
Table 2 presents average household wealth, median household wealth and the proportion of households owning various wealth components in 2008. Wealth is measured in 2010 euros using the consumer price index and is not equivalized to a one-person household.
Household wealth, 2008
1 Household wealth in 2010 euros. The age of the key person in the households determines the age category of the household.
2 7% of the households do not have any wealth according to the IPO data. These households may only own checking accounts (with unlimited amounts of money) and/or savings accounts that do not exceed 500 euro (or yield interest of more than 15 euro).
3 Other than mortgage debt.
4 Substantial shareholder.
5 Loan-to-value.
The results indicate that wealth in savings accounts increases with age, at least until the age of 70. Debts other than mortgage are owned by somewhat more than 10% of the sample and are highest in the 55–59 age category. Stocks from a substantial holding are relatively high, but only owned by not more than 1% of the sample. Securities, however, are owned by more than 25% of the sample, and increase on average from about 11,638 euro in the age category 35–49 to 25,641 euro in the 70+ age category.
Property is owned by 65% of the sample. Most of them (78%) also have a mortgage. The proportion of homeowners with a mortgage is high not only in the 35–49 age category (67/72 = 93%), but also in the 70+ category 41% of the homeowners still have a mortgage. Net housing wealth (property value minus the mortgage) is substantial and varies over age categories: it is lowest in the 35–49 age category and highest in the 60–64 age category, with an average of 206,066 and a median of 142,433 euro. The relatively high levels of net housing wealth among older generations can be explained by amortization of mortgages but also by home price increases before 2008. Between the beginning of the 1990s and 2008 home prices increased substantially, with an increase of about 180% between 1995 and 2008. This was at least partly due to decreasing mortgage interest rates and reduced borrowing constraints (before the 1990s, income from second earners was only taken into account for 5 years, and this became 30 years). The share of homeowners decreases after the age of 65; therefore, also average net property value decreases after the age of 70. A possible explanation for this is that people's health or the death of a partner forces them to move to a nursing home or a smaller house. In addition, cohort effects may play a role (homeownership is relatively low in old cohorts). Owing to fiscally attractive mortgage constructions, described in Section 3, we underestimate housing wealth. Housing wealth is rather illiquid, however, and is therefore often excluded in empirical studies on savings adequacy (Venti and Wise, Reference Venti and Wise1991). People in the Netherlands strongly prefer to stay in their own home as long as possible (De Graaf and Rouwendal, Reference De Graaf and Rouwendal2012). Reverse mortgages could be used to access a portion of home equity, but are still rare in the Netherlands. Nevertheless, housing wealth is very important in saving for retirement. Persons owning a house, given that they have repaid part of the loan on the house, and need less income to finance their necessary expenses than persons who live in a rental house.
5 Method and assumptions
This section explains the method and assumptions that we use to predict financial resources during retirement for future generations of retirees. Households may deplete wealth to finance their retirement. In view of this, we first describe how we annuitize household wealth. Secondly, we describe the assumptions that we make for the pension components.
5.1 Annuitizing household wealth
Whereas pension rights and annuity insurances are observed at the individual level, private savings and housing wealth are observed at the household level. We do not know how the members of a couple divide their wealth over each other. Therefore, to determine pension savings adequacy we assume that couples smooth their wealth over time and over each other. In the annuitization process, we take into account that members of a couple are often of different age and do not have the same life expectancy. Furthermore, we take into account economies of scale to reckon that when one of the partners dies, the remaining widow(er) needs to deplete relatively more wealth to be equally well off as before, since he or she loses economies of scale.
To investigate pension savings adequacy we project financial resources as from the age of 65.Footnote 8 To take both economies of scale and the age difference between members of a couple into account, we distinguish between the period where only the oldest member of the couple is 65 years or older and the period where both members are 65 or older. When the man is older than the woman we compute the annuity as follows:
 $$A = \displaystyle{K \over {\eqalign{&\bigg[ \sum\nolimits_{n \,=\, max(65 - {a_m},1)}^{64 - {a_f}} {\left( {{{(1{ - _n}{\,p_a}_f )}_n}{q_a}_m + 0.5 \cdot E{ \cdot _n}{\,p_a}{{_f} _n}{q_a}_m} \right)} \displaystyle{1 \over {{{(1 + r)}^n}}} \cr & + \sum\nolimits_{n \,=\, 65 - {a_f}}^{T - {a_f}} {\left( {_n {\,p_a}_f (1{ - _n}{\,q_a}_m ) + {{(1{ - _n}{\,p_a}_f )}_n}{q_a}_m + E{ \cdot _n}{\,p_a}{{_f} _n}{q_a}_m} \right)} \displaystyle{1 \over {{{(1 + r)}^n}}} \bigg]}} }$$
where K is the amount of capital needed for annuity A as from the age of 65. a m is the age of the man, a f is the age of the woman, npaf is the probability that a woman of age a is still alive after n years and nqam is the probability that a man of age a is still alive after n years. T is the maximum life expectancy and E reflects the equivalence scale (how much extra income a two-person household needs to be as well-off as a one-person household). We standardize the annuity to a one-person household. The first term of equation (1) reflects the period in which the man already reached the age of 65 and the woman is younger than 65. In case the woman is no longer alive, the man needs an annuity A; in case the woman is still alive, we assume that the man needs 0.5 × E of an annuity, because of the economies of scale. The second term of equation (2) reflects the period in which both the man and the woman are of age 65 or older. In case only the man or only the woman is alive, the household needs annuity A. In case both are alive they need E × A. The other way around, when the woman is older than the man, we use
 $$A = \displaystyle{K \over {\eqalign{&\bigg[ \sum\nolimits_{n \,=\, max(65 - {a_f},1)}^{64 - {a_m}} {\left( {{{(1{ - _n}{\,q_a}_m )}_n}{\,p_a}_f + 0.5 \cdot E{ \cdot _n}{\,p_a}{{_f} _n}{q_a}_m} \right)} \displaystyle{1 \over {{{(1 + r)}^n}}} \cr & + \sum\nolimits_{n \,=\, 65 - {a_m}}^{T - {a_m}} {\left( {_n {\,q_a}_m (1{ - _n}{\,p_a}_f ) + {{(1{ - _n}{\,q_a}_m )}_n}{\,p_a}_f + E{ \cdot _n}{\,p_a}{{_f} _n}{\,q_a}_m} \right)} \displaystyle{1 \over {{{(1 + r)}^n}}} \bigg]}} }$$
When both men and women have the same age we only keep the second term of equation (1) or (2), because there is no period in time where one of the members is 65 or older and the other member has not yet reached the age of 65 in this situation.
5.2 Assumptions
This section describes the assumptions for each pension component. With regard to the first pillar we assume that people stay in the Netherlands as from 2008 until the age of 65. To compute the public pension benefit that households receive we use the full gross public pension benefit level of 2008, measured in 2010 euros (13,033 euro per year for singles and 17,993 euro per year for couples). We include social assistance benefits that are used to guarantee a social minimum (e.g. for immigrants), and we assume that public pension benefits will be indexed. Finally, the public pension eligibility age is higher for future generations of retirees. To be able to compare public pensions across generations, we compute public pension benefits for everyone as if they are received as from the age of 65, using an actuarially neutral reduction rate for young generations that have a public pension eligibility age higher than 65.Footnote 9
Regarding occupational pensions, we use the data of Statistics Netherlands about occupational pension rights, which assume that people remain employed in their current job with their current wage rate until the age of 65. In future research, we will test how robust the results are with respect to this assumption by estimating and simulating wage profiles and labor market transitions, taking into account part-time work and stochastic non-employment spells. For the moment, we have to bear in mind that we do not take into account wage growth for younger workers and that we do not take into account unemployment and early retirement for this group (not all people will be working until the age of 65). In general, occupational pension entitlements in the Netherlands are nominal rights with price indexation conditional on the financial situation of the pension fund. Because of the poor financial situation of most pension funds in the Netherlands in recent years, pension funds have been unable to make inflation corrections. For the future we assume that 50% of the inflation will be corrected and that inflation amounts to 2% per year.Footnote 10 Furthermore, we make the rather optimistic assumption that no pension cuts take place. For 65+ individuals we do not observe second pillar pension entitlements, but we do observe the amount of second and third pillar pension benefits that they receive.
To approximate wealth accumulated in third pillar pension plans, we use the yearly contributions made to third pillar pension products as from 1989 and add a fictitious real return of 1% (after tax) per year. For the future we assume that, until the age of 65, people deposit the same amount into the pension product every year as they did on average during 2006–2010 (in real terms). We assume a future real rate of return of 1% (after tax) per year.Footnote 11
For the annuitization of private savings we use an annual real rate of return of 1% after tax,Footnote 12 and the most recent mortality rates per cohort predicted by Statistics Netherlands (December 17th 2010).Footnote 13 Mortality differences between men and women and between cohorts are taken into account. We do not consider differential mortality by income (Kalwij et al., Reference Kalwij, Alessie and Knoef2013) and we assume that the remaining lifetimes of couples are independent. As for the future, we assume that no additional private savings are being made to finance retirement.
With regard to housing, we assume an average yearly drop in real property prices of 1%. This means that an individual of age 40 in 2008 experiences a drop in the real value of his house of 22% between now and the age of 65. The average drop in housing prices was already 20% (in real terms) between the year 2008 and 2013. So, for this person real house prices should stay more or less constant after 2013 for this assumption to be true. Homeowners who have amortized part of their mortgage have relatively low housing costs. We take this into account by a small percentage (4%) of the net capital accrued in property (imputed rent). With an inflation of 2% we have an imputed rent in real terms of 2% (4%–2%). Until the age of 65, imputed rental income increases net housing wealth (e.g., by amortizing the mortgage). It can be seen as a return on housing wealth.
We assume that no additional private savings and mortgage amortizations will be made between 2008 and the year in which people reach the age of 65 to finance retirement. Thus, for the present we look only at current savings to determine pension savings sufficiency, and we compare current savings with current income. Also, we assume that retirement is the only savings motive for households, although other motives may exist, such as bequests (Van Gilst et al., Reference Van Gilst, Nijboer and Caminada2008). We also assume that children have left the household at the time the key person of the household reaches the age of 65. Furthermore, we allow for widowhood, but assume that couples stay together and singles remain single. To standardize household income we use the equivalence scale provided by Statistics Netherlands (Siermann et al., Reference Siermann, Van Teeffelen and Urlings2004), described above.
6 Results
Section 6.1 shows the results for future retirement income. Next, we compare these with current gross and net income (Sections 6.2 and 6.3), and investigate poverty during retirement as an indicator of how well households are prepared for their retirement (Section 6.4).
6.1 Future retirement income
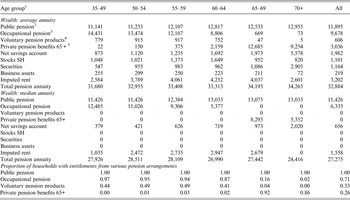
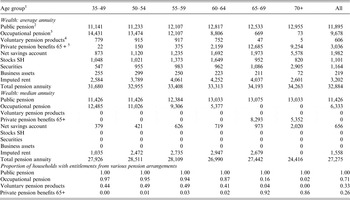
Table 3 shows equivalized pension annuities. We see that – for most households – public pension benefits and occupational pensions are the most important sources of income after retirement. These components together provide 65% of the average total annuitized wealth. Despite the relatively high percentage of households that have voluntary pension products, the holdings in these accounts are small and therefore contribute to the total pension wealth only marginally. Second pillar pension entitlements are highest in the two youngest age categories. There are several reasons for this. First, the pension coverage for young cohorts is higher than for old cohorts (especially among women). Second, we assume that people keep their current job until the age of 65, while older people have had more time to run into a gap, caused by a period of part-time employment or unemployment. Also, they may already have retired early, which decreases the occupational pension they receive as from the age of 65. If we would take into account the possibility that young cohorts will also run into unemployment, disability and/or early retirement, then their occupational pension would also be lower. Finally, a reduction of tax favored pension accruals will especially influence younger cohorts.
Predicted yearly retirement income (annuitized wealth)
1 Equivalized pension annuities in 2010 euros. The age of the key person in the households determines the age category of the household.
2 We assume that persons reside in the Netherlands until the age of 65.
3 For persons younger than 65 we observe the annuity that participants would receive in case they remain employed in their current job with their current income until the age of 65.
4 Pension rights accumulated in the third pillar are approximated using yearly contributions as from 1989.
5 For persons of age 65 and older we do not observe occupational pension rights and the amount of wealth accumulated in voluntary pension products, but we do observe the sum of actual private pension income.
The mean and median occupational pension benefits show that the distribution of occupational pension entitlements is skewed to the right (private pensions are distributed unequally such that high deciles receive a proportionally larger share of total private pensions). The distribution of public pension entitlements, however, is evenly distributed (most people receive a full state pension that consists of a flat rate).
Annuitized wealth from net savings accounts and securities is relatively high among the 70+ population because their remaining life expectancy is relatively low. Note that in this paper we assess whether current savings are adequate. We make no predictions about the extent of resources available to individuals at age 65, but estimate how much they would have in light of their current resources. We have to keep in mind that younger generations have more time to supplement their private savings. Also, private savings are probably higher especially for those persons who have an occupational pension gap.
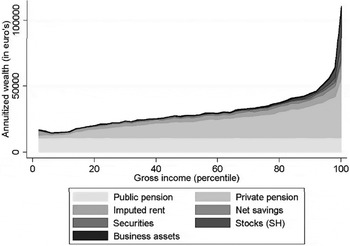
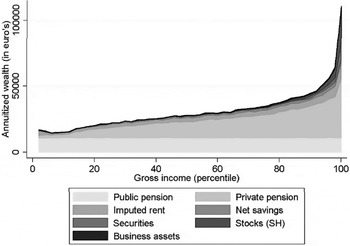
Figure 1 shows the average annuitized wealth components over the income distribution, where households are sorted from low- to high gross income. As expected, public pensions are flat over the entire income distribution. All other wealth components increase with gross income, with a large peak at the higher end of the income distribution. The importance of net savings accounts and securities increases at the higher end of the income distribution.
Composition of pension annuities over the income distribution.
6.2 Gross replacement rates
As a first measure of pension savings adequacy, we divide predicted retirement income by gross current income. This gives a replacement rate for households, using their current income, their current wealth, and the assumption that people keep their current job with their current wage and do not build up more capital (other than first and second pillar entitlements). Basically, we indicate to what extent current savings can replace current income conditional on the current job and wage.
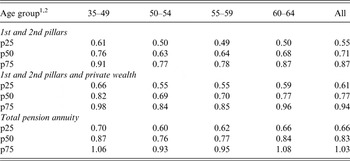
Table 4 shows three different replacement rates. The first replacement rate only takes into account public and occupational pension benefits. The second includes voluntary pension products and other financial wealth, and the third also includes the imputed rental income of net housing wealth. These three replacement rates indicate the importance of different wealth components and provide insight into the replacement rates when households do or do not deplete financial wealth.Footnote 14Table 4 shows that the total median gross replacement rate is 83% (p50). Half of the sample has a total gross replacement rate between 66% and 103% (p25 and p75, respectively). The ratio is relatively high for the youngest age category as well as for the category 60–64. This can partially be explained by the fact that current income is relatively low among these households, as observed in Table 1. If we only take into account wealth in the first and second pension pillars, replacement rates become substantially lower in all age categories. This substantial contribution of non-pension wealth, including housing, to retirement income is also found by Crawford and O'Dea (Reference Crawford and O'Dea2012), who performed a comparable analysis for the UK.
Gross replacement rates, 2008
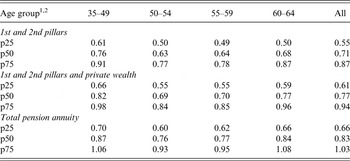
1 The three replacement rates in this table give an impression of the importance of 1st and 2nd pillar pensions, privately saved wealth and property to finance retirement. However, it should be noted that the ratios cannot be compared mutually, because of the rearranging of the quartiles with respect to the wealth components that are taken into account in calculating the replacement rates.
2 The table reports three quartiles (p25, p50 and p75) of the distribution of the replacement rates (replacing current gross income). At the bottom, 25% of the households have a replacement rate below the first quartile (p25). p50 indicates the median replacement rate. At the top, 25% of the households have a replacement rate higher than p75.
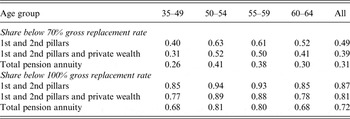
Table 5 shows that when account is taken only of public and occupational pensions, a considerable share of the households (49%) has a gross replacement rate below 70%. When account is taken of the third pillar, private wealth and imputed rental income from net housing, this percentage decreases to 31%. On the other hand, 28% (=100%–72%) of the households can replace at least their current income using the total of their pension annuities.
Share of households below 70% and 100% gross replacement rates, 2008
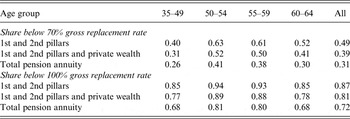
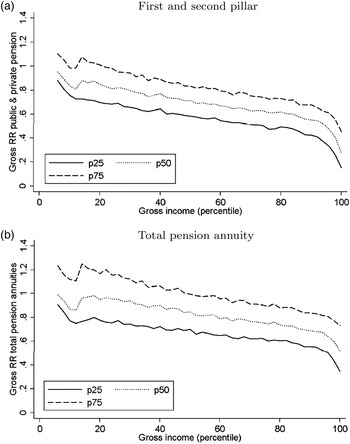
Figure 2 presents the development and variation of the gross replacement rate over the income distribution. Figure 2(a) focuses on the ratio of public and private pensions to gross current income. Here, it should be noted that high replacement rates of about 100% for low gross incomes are institutionally determined with the ‘social minimum’.
Replacement rates over the income distribution.
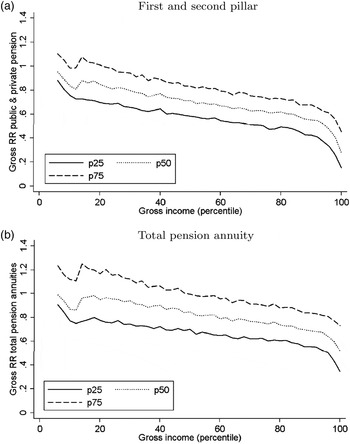
The replacement rate declines over the income distribution from a median replacement rate of 95% at the lower end of the income distribution to a median replacement rate of 34% at the top of the income distribution. Figure 2(b) shows the ratio of the total pension annuity compared to current gross income. Comparison of Figures 2(a) and 2(b) reveals that wealth from voluntary pension products, private savings and property has a substantial positive effect on replacement rates; as from the 25th income percentile, replacement rates are approximately 15%-points higher when taking into account voluntary pension products, private savings and property. The replacement rate even increases by about 25%-points for the top quartile of the replacement rate (the dashed line) because of including private savings and housing wealth. The increase in the replacement rate is less substantial (about 8%) for the bottom quartile (the solid line). Finally, the decline in replacement rates over the income percentiles is lower when we take into account private wealth and housing. As might be expected, the replacement rates that include the total pension annuity show a larger variation than the replacement rates that only take into account first- and second pension pillars.
6.3 Net replacement rates
The analysis thus far has focused on gross income and gross replacement rates, and has not considered the Dutch labor income tax and benefits system. However, net replacement rates that take into account the taxes and benefits system may give a better indication of the extent to which households are adequately prepared for their retirement. Individuals above the statutory retirement age face lower marginal tax rates in the first two brackets of the income tax system and do not pay premiums for social insurance and social security. This means that net replacement rates are in general higher than gross replacement rates.
Total disposable income (the denominator of the net replacement rate) is easily determined by summing primary income minus taxes plus transfers in the IPO database. To compute net pension annuities (the numerator), we compute the average tax burden of 65+ singles and couples in different income deciles. We distinguish homeowners and renters, since mortgage interests are tax deductible. The appendix describes the tax burdens found in IPO, which are reasonably comparable with those found in Microtax (a model that simulates Dutch taxes, CPB (2008)). We apply these tax burdens to the sum of predicted pension annuities in the first, second and third pillar. We do not tax annuities from financial wealth and housing wealth (actually, they were already taxed at the moment they were received as income). Wealth taxation is 1.2% of the financial wealth above the threshold of 20,000 euro per person. We do not take into account wealth taxation explicitly, but implicitly: when we use a real rate of return of 1% we assume that this is net of taxes.
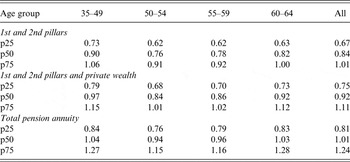
Table 6 shows net replacement rates. Whereas the median replacement rate of first and second pillar pensions was 71% in gross terms (Table 4), this is 84% in net terms, indicating that the majority of households are able to replace 84% of their current disposable income with net public and occupational pension benefits. The median net replacement rate increases to 92% when we take into account voluntary third pillar pensions and private wealth, and to 101% when we also add the imputed rental income of net housing.
Net replacement rates, 2008
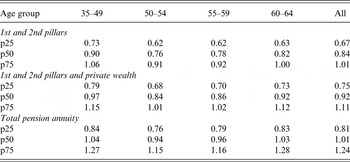
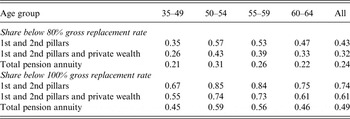
Table 7 shows that only 24% of the households face a net replacement rate that is lower than 80% when all pension annuities are taken into account. When we only take into account first and second pillar pensions, this percentage is substantially higher (43%). Furthermore, Table 7 indicates that 51% of all households are able to fully replace current disposable income with net pension annuities.
Share of households below 80% and 100% net replacement rates, 2008
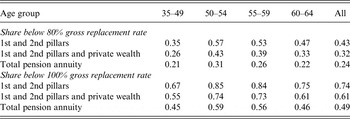
For international comparison, Crawford and O'Dea (Reference Crawford and O'Dea2012) find that 53% of the individuals have a replacement rate below 80% in the UK in 2008, taking into account pension income alone. If the authors take into account all sources of wealth, only 21% of UK individuals fall below a replacement rate of 80%. Based on households, for the Netherlands we find that 43% (first and second pillars) and 24% (total pension annuity) fall below the 80% replacement rate in the Netherlands in 2008. Both calculations are based on a nominal interest rate of 3%.
6.4 Poverty
Whereas Sections 6.2 and 6.3 focused on replacement rates, high replacement rates do not necessarily reflect high incomes during retirement. For example, low-income households may face relatively high replacement rates because public pensions and social security benefits provide almost everyone with a social minimum. On the other hand, relative poverty may be high among them.
Unlike the relative poverty thresholds used by the EU, the Netherlands uses an absolute poverty line as official poverty indicator. The official poverty line in the Netherlands is the absolute social minimum proposed by the Netherlands Institute for Social Research (SCP). The social minimum implies that a single person aged 65 or over is in poverty if the person's income is lower than 928 euro (net, excluding holiday allowance) a month in 2008. Pensioners have a low probability to fall in official poverty, since a full public pension equals the social minimum. An individual who has not lived in the Netherlands all of the years between age 15 and 65 may have an incomplete public pension, but in the event that household income is lower than the social minimum and household wealth is lower than 5,325 euro per person, he is supplemented with social assistance benefits up to the social minimum (homeowners may own an additional amount of wealth of 44,950 euro). Owing to these supplements up to the social minimum there are almost no elderly households living in absolute poverty. Only if someone has not lived in the Netherlands all of the years between the age of 15 and 65 and his income or wealth is above these thresholds, or if someone does not possess the Dutch nationality or if that person is in detention he will not receive social assistance to supplement income to the social minimum. Furthermore, the take-up rate of these social assistance supplements is not 100%. Those who do not take-up the social assistance supplement live in poverty.
Our predictions of retirement income indicate that approximately 4% of all households that are currently in the age group 35–64 will need social assistance when they are retired, in order to top up public pension benefits to the social minimum. Among first-generation immigrant households, about 34% will need social assistance. Those who do not take up social assistance will live in poverty. Furthermore, low-income but wealthy households who do not receive a complete public pension may live in poverty according to the social minimum income definition, because they do not receive a social assistance supplement. Considering their wealth, however, these households may not really be said to live in poverty. Finally, some low-income households with relatively high mortgage rents and low imputed rents may fall into poverty according to the social minimum income definition.
Official poverty lines of the EU are based on 60%, 50% and 40% of median equivalized household income (MEI). For the Netherlands, these EU indicators of poverty imply that households fall into poverty when they have a yearly income lower than 12,003, 10,003 or 8,003 euroFootnote 15 for a poverty line based on 60%, 50% and 40% of MEI, respectively. These EU poverty thresholds are lower than or about the same as the social minimum. This means that only the above-mentioned households who do not take up social assistance, who have a low income but a high wealth level, or those with relatively high mortgage rents, may fall into poverty according to the EU definitions.
7 Vulnerable groups
This section focuses on several potentially vulnerable groups. We study households with self-employment, since self-employed individuals do not have to participate in a pension fund (in contrast to most Dutch paid workers), and the vulnerability of immigrants, single women, renters, and households that faced unemployment or disability for at least 2 years between 1989 and 2008. First-generation immigrants may be vulnerable since they have not fully accumulated public pension entitlements. Furthermore, single women may be potentially vulnerable because of small or non-existent occupational pensions due to part-time work and providing care to their children. Recipients of unemployment insurance or social assistance may be vulnerable, since in general they do not accumulate occupational pension rights. For persons in disability insurance this is different. In nearly all pension funds individuals in disability insurance build up occupational pension rights as if the person still works in his previous job, with a dispensation from paying occupational pension premiums. Finally, renters are in general low-income households and they do not build up housing wealth (relatively tax beneficial).
To construct a robust indicator of a vulnerable group we use not only information of the year 2008, but also the years 1989 to 2007. Year-to-year movements in and out of social insurance, for example, are substantial.Footnote 16
Clearly, there is a large overlap between these groups. For example, 36% of the households with at least one first-generation immigrant and 14% of the single women received social assistance for at least 1 year between 1989 and 2008. This percentage is even higher for households with a single female first-generation immigrant (44%).
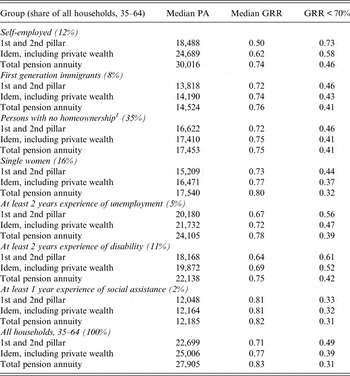
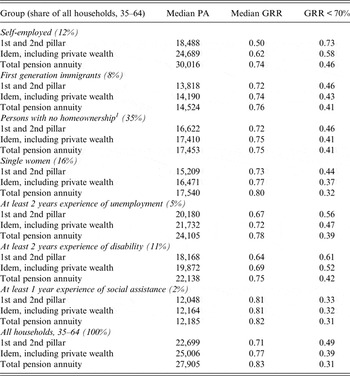
Table 8 presents median pension annuities and gross median replacement rates of the potentially vulnerable groups. The first column of the table indicates that most of the potentially vulnerable groups have a relatively low annuity from pensions, private wealth and housing. The lowest retirement income is observed among households that experienced at least 1 year of social assistance. Among these households, retirement income is generally not much higher than the basic public pension. The table also indicates that second pillar pensions are substantially lower among self-employed households than among all working age households. Renters have a relatively low median pension annuity and this difference is not completely due to the non-existence of housing wealth.
Median pension annuity (PA) and gross replacement rates (GRR) of potentially vulnerable groups, 2008
1 Renters do not receive income from imputed rent; some renters, however, own real estate (holiday homes or a houseboat).
The second column shows median gross replacement rates. We see that all potentially vulnerable groups except the self-employed have a replacement rate that is close to or above 70%, indicating that current income can to a large extent be maintained after retirement. Note, however, that high replacement rates among these groups are caused by relatively low-current income levels, such that receiving a public pension may already be sufficient to replace current income. This seems to be especially the case for households that received at least 1 year of social assistance. By comparing three types of replacement rates we find that first-generation immigrants and households on social assistance have barely accumulated non-pension wealth, while those in unemployment or disability insurance have accumulated non-pension wealth.
The median self-employed household is expected to replace only 50% of current income when taking into account just first and second pillar pensions (this is 71% for all working age households). Adding third pillar pensions, private wealth and imputed rental income from net housing reduces the gap. Adding these components allows the median self-employed household to replace 74% of their current income after retirement (compared with 83% for all working age households). The spread around this median replacement rate is larger for the self-employed than for the general population.
Column 3 shows the percentage of households that fall below a replacement rate of 70%. Assuming that a replacement rate of 70% is sufficient, we observe that about 40% of the households in the potentially vulnerable groups do not reach a sufficient replacement rate. This is about 10%-points more than for all working age households. Single women and households on social assistance perform relatively well. For households on social assistance this is due to a construct of the social insurance system in which social assistance benefits are equal to the state pension. Self-employed households, on the other hand, are more often confronted with a gross replacement rate below 70%. 46% of the self-employed households have a gross replacement rate lower than 70%, when taking into account all wealth components (31% for all working age households). So, the self-employed are less likely to maintain their standard of living. Also, due to extensive tax facilities for the self-employed, the replacement rate will not increase that much when moving from gross to net replacement rates. Note, however, that current income is on average substantially higher among self-employed households than among all working age households.
8 Scenario analyses
This section analyzes the sensitivity of pension savings adequacy to the assumptions made. Section 8.1 presents an optimistic and a pessimistic scenario in which we vary the indexation of occupational pensions, the real rate of return on non-housing wealth, the real return on property, and the retirement age. In the optimistic scenario, all factors are set optimistically. The opposite is the case in the pessimistic scenario. Hence, the two scenarios provide upper- and lower bounds on the resources available at retirement that actual outcomes are likely to fall into.
Section 8.2 uses the parameters of the baseline scenario again and shows the effect of housing wealth depletion after retirement (instead of only taking into account the imputed rental income from net housing).
8.1 Optimistic and pessimistic scenarios
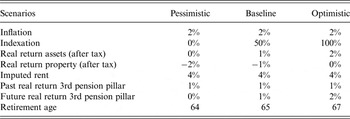
Table 9 shows the parameters of the baseline, pessimistic and optimistic scenarios. Several assumptions remain constant across the scenarios. In all three scenarios, we assume an inflation rate of 2%, a nominal imputed rent of 4% and real return on past third pillar payments of 1% after tax.
Assumptions in the pessimistic, baseline and optimistic scenario
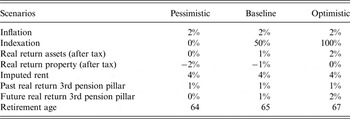
Other assumptions vary by scenario. The pessimistic scenario assumes no indexation of occupational pensions, such that the real value of occupational pension rights declines 2% every year due to inflation. The baseline scenario assumes 50% indexation. Real occupational pension rights are not reduced in the optimistic scenario, where full indexation takes place.
We assume a real rate of return of 0%, 1% and 2% in the pessimistic-, baseline- and optimistic scenarios, respectively. Furthermore, the average real rate of return on property from 2008 until retirement is −2, −1 and 0% in the pessimistic-, baseline- and optimistic scenarios, respectively. This means that in the pessimistic scenario, an individual of age 40 in 2008 experiences a drop in the real value of his house of almost 40% between now and the age of 65; in the optimistic scenario, the drop is 0% (which entails a positive average real rate of return on property as from 2012 until the age of 65, since real housing prices have decreased between 2008 and 2012).
Finally, we assume different retirement ages in the three scenarios. A relatively low retirement age has a negative effect on retirement income and is, therefore, assumed in the pessimistic scenario. On the other hand, a relatively high retirement age has a positive effect on retirement income, and this is assumed in the optimistic scenario. People stop working and start using their pension annuity as from the age of 64 in the pessimistic scenario, 65 in the baseline scenario and 67 in the optimistic scenario. We adjust accumulated pension rights in an actuarially neutral way, using the factors of CPB (2009). This means that we cut occupational pension rights by 8% when the retirement age is 64, and increase occupational pension rights by 2 × 8 = 16 when the retirement age is 67. For public pensions we use an actuarially fair adjustment rate of 6.5% per year, and private savings are annuitized at age 64 in the pessimistic scenario and at age 67 in the optimistic scenario.
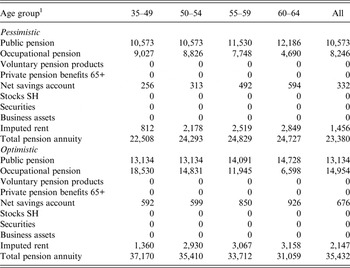
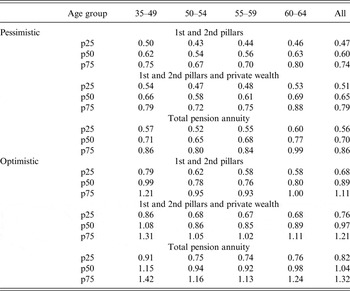
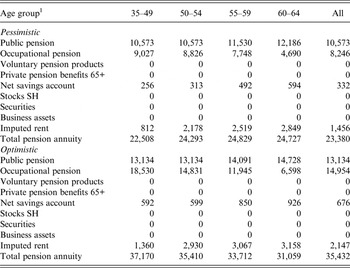
Table 10 shows median pension annuities in the pessimistic and optimistic scenarios. The table shows that the different assumptions have the highest impact on occupational pensions and imputed rent (induced by the indexation assumption, the retirement age and the assumed development of housing prices).
Median pension annuities in the pessimistic- and optimistic scenarios
1 Equivalized household income in 2010 euros.
The pessimistic scenario is most harmful to the young cohorts, since they have a longer period without indexation and with decreasing housing prices until they reach retirement. Older cohorts, who are closer to retirement, are relatively well-off in the pessimistic scenario compared to the households in the 35–49 age category. On the other hand, in the optimistic scenario, young cohorts have a relatively long period until retirement in which they can benefit from returns on investments and housing wealth.
Compared to the baseline scenario presented in Table 3, older cohorts perform relatively well in the pessimistic scenario, young cohorts perform relatively well in the optimistic scenario, while the baseline scenario is slightly in favor of the younger age groups. This relatively good position of the younger age group can primarily be explained by relatively high occupational pensions. We may, however, overestimate the occupational pension accumulation of the young due to the assumption that individuals remain in their current job until the age of 65 (64 or 67 in the other two scenarios). In practice, it is observed that persons tend to reduce working hours as from the age of 50 (women) or 55 (men), and to retire or become unemployed before the age of 65.
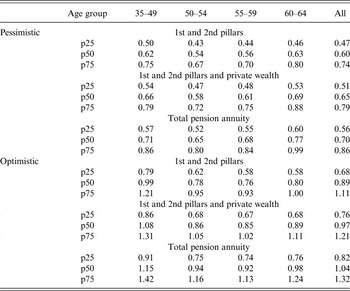
Table 11 presents gross replacement rates in the pessimistic and optimistic scenarios, and shows similar patterns as Table 4. As expected, median replacement rates including all components are lower in the pessimistic scenario (0.70) and higher in the optimistic scenario (1.04) relative to the baseline scenario (0.83) presented in Table 4. Replacement rates are lower for young cohorts compared to the older cohorts in the pessimistic scenario, while the reverse is true for the baseline and optimistic scenarios. All in all, we can conclude that results regarding retirement savings adequacy are sensitive to different future scenarios. Young generations benefit most from an optimistic scenario but also suffer more from a pessimistic scenario, compared to older generations.
Gross replacement rates in the pessimistic- and optimistic scenarios
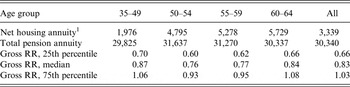
8.2 Depletion of housing wealth
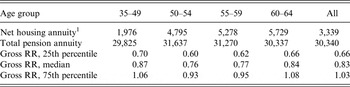
Throughout the paper the assumption has been made that households receive an imputed rental income on net housing wealth, but that households do not deplete housing wealth. So, households neither move to a smaller house or rental house, nor use reverse mortgages to finance retirement with housing wealth. This section assumes that net housing wealth will be depleted after retirement. At the retirement age people buy an annuity from their net housing wealth, in the same way as we assumed for private wealth (explained in Section 5.1). Thus, households still receive an imputed rental income, but also ‘eat up’ their housing wealth. Compared to Table 3, Table 12 shows that the total median pension annuity is substantially higher when net housing wealth will be depleted. This holds especially for older generations, who have a relatively high net housing wealth. For the age category 60–64, the median total pension annuity increases more than 3,000 euro per year.
Median pension annuities and gross replacement rates when housing wealth will be depleted
1 Equivalized household income in 2010 euros.
The higher total pension annuity due to the depletion of housing wealth also translates into higher gross replacement rates. Taking into account the depletion of housing wealth instead of only taking into account the imputed rent increases the median replacement rate from 0.83 to 0.88, indicating that the median household can replace about 90% of current gross income during retirement if one takes into account pensions, private wealth and the depletion of housing wealth. Half of the households have a gross replacement rate between 69% and 112%.
9 Summary and conclusions
The performance of pension systems on adequacy is often evaluated on the basis of fictitious replacement rates for median earners. This study indicates that, although the Dutch pension system is very highly ranked on adequacy, results on adequacy are somewhat less promising when we use microdata to examine the pension that people actually accumulate in the current system. Results on projected replacement rates are fairly comparable to the UK, despite the fact that the UK pension system has a much lower rank on pension savings adequacy. This suggests that we should be careful in evaluating the adequacy of pensions systems on the basis of fictitious replacement rates.
This study examines the extent of the resources people have available for retirement. Our results show that equivalized financial resources during retirement are on average about 33,000 euro per year and have a median of 27,000 euro per year. Young generations own relatively more occupational pension rights, whereas older generations have accumulated more private wealth and housing wealth. Private wealth and housing wealth raise median replacement rates substantially. Whereas the median gross replacement rate from public and private pensions is 71%, this increases to 83% when account is taken of all pension annuities.
The large-scale administrative data used in this study make it possible to focus on several vulnerable groups, such as households with self-employment. Self-employed households have relatively low occupational pension rights, but relatively high voluntary pensions, private savings and net housing wealth. The total pension annuity has a median of about 30,000 euros. This is somewhat higher than the pension annuities in the total population, however, which also includes inactive households. Replacement rates of the self-employed are relatively low, with a median of 74% for all pension components together. Other vulnerable groups include first-generation immigrants, single women and households that have faced unemployment, disability and/or social assistance. Whereas households with first-generation immigrants and households with social assistance rely almost fully on public pensions (and potentially a supplement from social assistance), households with unemployment or disability often own private wealth, which increases their median replacement rate by more than 10% points.
Assumptions about indexation, housing prices and the retirement age influence the results. Occupational pension rights decrease dramatically when no indexation takes place between now and retirement, and developments in housing prices influence the imputed rental value of households' net housing wealth. The median total pension annuity varies from 23,000 euro in our pessimistic scenario to 35,000 euro in our optimistic scenario. Associated median replacement rates vary between 70% and 104%. If people were to deplete net housing wealth, the median pension annuity in the baseline scenario would increase by about 3,000 euro per year, which implies an increase in the median gross replacement rate of about 5% points.
This study represents a first step in the assessment of retirement savings adequacy on the basis of microdata for the Netherlands. There are several important issues to bear in mind when interpreting the results. First, we use the data of Statistics Netherlands about occupational pension rights, which assume that people stay employed in their current job until a fixed retirement age. A natural next step involves taking into account how future wages and labor force participation will evolve. In the current analysis, we are likely to overestimate the occupational pension rights of the young generation since it is questionable whether they will work until the age of 65 and tax favored pension accruals decrease.
Second, we currently assume that no additional private savings will be made. In reality, private savings may increase, especially when households know that the second pillar will become less generous. For example, Alessie et al. (Reference Alessie, Angelini and Van Santen2013) suggested that social security wealth and pension wealth partly displace private savings, and Jia and Zhu (Reference Jia and Zhu2012) found that this displacement is higher among high-income households than among low-income households. So, cuts in occupational pensions will partly be compensated by private savings, especially among high-income households. Structural models can be estimated to explain private saving behavior of Dutch households, and these models can be used in policy simulations.
Third, this study focuses on retirement income at the retirement age. Pension cuts after that age are not taken into account.
Fourth, we do not take into account that life expectancies differ substantially among income classes. Remaining life expectancy at age 65 is on average 2.5 years shorter for a low-income individual compared to a high-income individual (Kalwij et al., Reference Kalwij, Alessie and Knoef2013). This means that on average annuitized private savings will be higher for low-income groups and lower for high-income groups.
Finally, whereas current simulations show deterministic outcomes, they are surrounded by uncertainty. In addition to existing uncertainty in future earnings, uncertainty in second pillar pension benefits will increase because risk of return and increases in life expectancy (macro longevity risk) will be deferred to participants of second pillar pension schemes. This is an interesting track for future research.
Given the pension- and long-term care reforms still to come, we argue that it is important to extend this research to convincingly evaluate the effect of several policy-relevant scenarios on a wide variety of households.
Appendix
Appendix A – Taxes
Table A.1 shows the median tax burden of 65+ singles and couples in different income deciles. We also distinguish homeowners and renters, since mortgage interests are tax deductible. The median tax burden varies between 10% for the lower income deciles and 36% for the highest income decile.
Median tax pressure per income decile for four types of 65+ households, 2008