Introduction
Stigma and discrimination against people with mental illness have substantial public health impact in England, contributing to inequalities (Hatzenbuehler et al., Reference Hatzenbuehler, Phelan and Link2013) including: poor access to mental and physical healthcare (Mai et al., Reference Mai, D'Arcy, Holman, Sanfilippo, Emery and Preen2011); reduced life expectancy (Laursen et al., Reference Laursen, Munk-Olsen, Nordentoft and Mortensen2007); exclusion from higher education and employment (Social Exclusion Unit, 2004); increased risk of contact with criminal justice systems; victimisation (Clement et al., Reference Clement, Brohan, Sayce, Pool and Thornicroft2011); poverty and homelessness.
Typically, research on stigma has focused on the measurement of knowledge and attitudes. It could be argued that these are less important than the actual experiences of stigma however research suggests that there is a link between public stigma and the individual experiences of stigma among people with mental health problems (Evans-Lacko et al., Reference Evans-Lacko, Brohan, Mojtabai and Thornicroft2012). Internationally, public attitude data suggest that there has been little improvement over time where there have been no specific programmes to reduce stigma (Schomerus et al., Reference Schomerus, Schwahn, Holzinger, Corrigan, Grabe, Carta and Angermeyer2012). Indeed, relative to Scotland, which initiated the national anti-stigma initiative ‘See Me’ in 2002, attitudes in England showed relative worsening between 2000 and 2003 (Mehta et al., Reference Mehta, Kassam, Leese, Butler and Thornicroft2009).
In some high-income countries there is growing investment in and evidence for the effectiveness of anti-stigma interventions, both national programmes and those targeted to specific groups (Borschmann et al., Reference Borschmann, Greenberg, Jones and Henderson2014). The National Institute for Health and Clinical Excellence in England emphasises the inclusion of knowledge, attitude and behavioural components when developing and evaluating behaviour change interventions (National Institute for Health Clinical Excellence, 2007). Applying this to anti-stigma interventions requires the evaluation of: lack of knowledge and misinformation such as stereotypes; prejudicial attitudes and emotional reactions such as fear and anger; and discriminatory behaviour (Thornicroft et al., Reference Thornicroft, Rose, Kassam and Sartorius2007).
In England, the current national programme against stigma and discrimination is Time to Change (TTC) (Henderson and Thornicroft, Reference Henderson and Thornicroft2009), delivered by the charities Mind and Rethink Mental Illness. Its first phase ran from 2007 to 2011, including a social marketing campaign launched in January 2009 aimed at adults aged 25–44 in middle income groups, and work with target groups (Henderson et al., Reference Henderson, Williams, Little and Thornicroft2013; Shefer et al., Reference Shefer, Rose, Nellums, Thornicroft, Henderson and Evans-Lacko2013). The second phase of TTC was funded for 2011–2015, with a 1-year extension to 2016. In addition to the social marketing programme aimed at adults (Sampogna et al., Reference Sampogna, Bakolis, Evans-Lacko, Robinson, Thornicroft and Henderson2017), it included a programme for children and young people using interventions in secondary schools in two selected areas. During the second phase, the Department (Ministry) of Health in England applied three outcome measures used for the TTC evaluation to monitor the impact of an objective of its mental health policy, ‘No Health Without Mental Health’, that ‘fewer people will experience stigma and discrimination’ (Department of Health, 2011). Two measures were among those reported here: public attitudes and mental health-related knowledge. The third phase of TTC runs 2016–2021 and includes a children and young people's programme, while the adult campaign is aimed at an income group overlapping but lower than previous phases, and more directly towards men. TTC's targets for each phase included a 5% positive shift in public attitudes towards people with mental illness, assessed using the national Attitudes to Mental Illness survey, which is also the survey we report on here. Since 2009 this has also included measures of stigma-related knowledge, desire for social distance, and reporting contact with someone with a mental illness. Between 2009 and 2015, there were significant improvements in all of stigma-related knowledge, attitudes, desire for social distance and an increase in reporting contact (Henderson et al., Reference Henderson, Robinson, Evans-Lacko, Corker, Rebollo-Mesa, Rose and Thornicroft2016). There was also evidence for a reduction in discrimination as reported by mental health service users across a number of areas of life; particularly in informal relationships, although the proportion reporting no discrimination in any life area did not increase by 5% as per the target (Corker et al., Reference Corker, Hamilton, Robinson, Cotney, Pinfold, Rose, Thornicroft and Henderson2016).
Aims of the study
This study examines longitudinal trends in mental health-related knowledge, attitudes to mental illness, desire for social distance and reporting having contact with people with mental illness among the general public in England over the course of TTC. As stigma is an important cause of health inequalities, it is important that anti-stigma programmes do not result in widening of inequalities among demographic groups with respect to stigma outcomes. Our previous work identified differences in stigma outcomes by age, sex, socioeconomic status and ethnicity and moderation by age group on the relationship between year of the survey and attitudes, suggesting greater improvement in TTC's adult target group aged 25–44 (Henderson et al., Reference Henderson, Robinson, Evans-Lacko, Corker, Rebollo-Mesa, Rose and Thornicroft2016). In addition, the Health Survey for England 2014 showed differences among the nine Government Office Regions of England in attitudes (Ilic et al., Reference Ilic, Henderson, Henderson, Evans-Lacko, Thornicroft, Craig, Fuller and Mindell2014), however, the measure of attitudes was only included once in this survey preventing any examination of change over time. There may have been pre-existing regional differences, even when adjusting for individual factors, for example, as a result of differences in local and regional media coverage of mental health (Corrigan et al., Reference Corrigan, Powell and Michaels2013). Further, we previously found that regional changes in knowledge and attitudes were associated with level of awareness of TTC (Evans-Lacko et al., Reference Evans-Lacko, Corker, Williams, Henderson and Thornicroft2014). Such differences are potentially useful in guiding locally driven anti-stigma work, as is included in phase 3 of TTC. Therefore, we investigate both whether these outcomes have improved since the inception of TTC, and if so, whether these improvements vary by demographic group and by region of England.
Methods
Data source
As a part of the TTC evaluation the Attitudes to Mental Illness survey has been carried out every year since 2008 by the agency Kantar TNS. The outcome measures for public knowledge, desire for social distance and reporting contact were added in 2009; therefore, the baseline for public attitudes is 2008 and for the other outcomes is 2009. There are approximately 1700 respondents for each survey year. A quota sampling frame is used to ensure the survey sample is nationally representative of adult residents in England: census small area statistics and the Postcode Address File define sample points that are randomly selected and stratified by Government Office Region and social status. Sampling errors were calculated on an assumption of a simple random sampling method. Information on the survey methods can be found at: https://www.time-to-change.org.uk/sites/default/files/Attitudes_to_mental_illness_2014_report_final_0.pdf. All survey interviews were carried out in a face-to-face manner in respondents’ homes by fully trained personnel.
Measures
Mental health-related knowledge
Mental health-related public knowledge was measured by the Mental Health Knowledge Schedule (MAKS) (Evans-Lacko et al., Reference Evans-Lacko, Little, Meltzer, Rose, Rhydderch, Henderson and Thornicroft2010), which comprises six items covering stigma-related mental health knowledge areas: help seeking, recognition, support, employment, treatment and recovery; and six items that inquire about classification of various conditions as mental illnesses. The standardised total score of the first six items on stigma-related knowledge was used; where a higher standardised MAKS score indicates greater knowledge. Overall test-retest reliability of the MAKS is 0.71 (Lin's concordance statistic) and the overall internal consistency among items is 0.68 (Cronbach's α).
Mental health-related attitudes
Public attitude towards mental health was measured using the UK Department of Health Attitudes to Mental Illness questionnaire that was developed in 1993. It includes 26 of the 40 items from the Community Attitudes towards the Mentally Ill scale (CAMI) (Taylor and Dear, Reference Taylor and Dear1981), plus one added item on employment-related attitudes. The items cover attitudes about social exclusion, benevolence, tolerance and support for community mental health care and were rated from 1 (strong disagreement) to 5 (strong agreement). Like the MAKS, the standardised total score of the CAMI was used and a higher score indicates less stigmatising attitudes. The overall internal consistency of the CAMI in this dataset is 0.87 (Cronbach's α).
Desire for social distance and reporting contact
These two outcomes were measured using the Reported and Intended Behaviour Scale (RIBS) (Evans-Lacko et al., Reference Evans-Lacko, Rose, Little, Flach, Rhydderch, Henderson and Thornicroft2011), derived from the Star Social Distance Scale (Star, Reference Star1952). For the desire for social distance outcome, i.e. intended behaviour (RIBS IB), four items assess the level of desired future contact with people with mental health problems, in terms of: living with, working with, living nearby and continuing a relationship with someone. For the reporting contact outcome, i.e. reported behaviour (RIBS RB), four items assess past or current contacts in the same four contexts. Both outcomes are scored so that a higher score indicates more positive behaviour: less desire for social distance and more types of contact. The total RIBS IB score was standardised and the RIBS RB score was transformed into a binary outcome (any reported contact v. none). The overall test–retest reliability of total RIBS score is 0.75 (Lin's concordance statistic).
Socio-economic status
Respondent demographics were recorded at the end of the interviews. Socio-economic status (SES) was categorised using the Market Research Society's classification system into four groups (AB, C1, C2 and DE). This was based on the occupation of the household's chief income earner: AB represents professional/managerial occupations, C1 represents other non-manual occupations, C2 represents skilled manual occupations and DE represents semi-/unskilled manual occupations or people dependent on state benefits.
Familiarity with mental health problems
It has been demonstrated previously that knowing someone with a mental health problem or familiarity with mental illness is strongly associated with mental health-related knowledge, attitudes and desire for social distance (Henderson et al., Reference Henderson, Robinson, Evans-Lacko, Corker, Rebollo-Mesa, Rose and Thornicroft2016). To be consistent with previous TTC evaluations, familiarity was measured using the following question: Who is the person closest to you who has or has had some kind of mental illness? The potential responses included: immediate family, partner, other family, friend, acquaintance, work colleague, self, other or no-one known. These were categorised into three groups (self, other and none).
Government Office Region
The lowest level information on participants’ location is the Government offices for the regions (GOR) categories as described by the UK Government's Office for National Statistics (ONS) (http://ons.gov.uk). Participants’ postcodes are excluded from the database, thereby protecting their anonymity, so the nine English regions (North East, North West, Yorkshire and The Humber, East Midlands, West Midlands, East of England, South East, South West and London) were used to test for regional differences.
Statistical analysis
Descriptive statistics for participant demographics and crude outcome scores were calculated and reported by survey year. They were also reported by region to illustrate differences between areas of England. All analyses were weighted by gender, age and ethnicity to reflect population characteristics in England. Survey weights were taken directly from the UK Government's ONS. In order to create analysis models, the quota sample was treated as a probability sample. Three initial multiple linear regression models were used to evaluate patterns of change in: (i) public knowledge (MAKS); (ii) public attitudes (CAMI) and (iii) public desire for social distance (RIBS IB) of mental health problems. All the models used the standardised scores of the measures as the dependent variables; therefore, the outputs were interpreted in s.d. units. Logistic regression was used to evaluate patterns of change in reported contact (RIBS RB), which was a binary outcome.
To evaluate changes over time all the models included a fixed effect for year using a categorical dummy variable. To obtain estimates for the proportion of the population whose outcomes changed between two comparative years (2017 and baseline), the distributional approach was used, which uses the parameters of the normal distribution (Sauzet et al., Reference Sauzet, Breckenkamp, Borde, Brenne, David, Razum and Peacock2016). This method converts results from linear regression models into corresponding proportions, using the area under the standard normal curve. Other covariates were included to control for differences in participant demographics: gender (female v. male), age category (16–24, 25–44, 45–64 and 65+), ethnicity (Asian, Black, other and White), SES (AB, C1, C2 and DE), familiarity with mental health problems (self, other and none) and region (North East, North West, Yorkshire and The Humber, East Midlands, West Midlands, East of England, South East, South West and London). Interactions were tested between survey year and demographic subgroups to see whether patterns of change in the outcomes differed depending on any groups. The interaction terms were added separately to the initial models and evaluated for statistical significance using a Wald test. Exploratory analyses were carried out to test whether interactions were still significant for men and women separately. All analyses were carried out using Stata version 15.0 (StataCorp, TX, USA).
Results
Survey sample characteristics and outcome responses by year
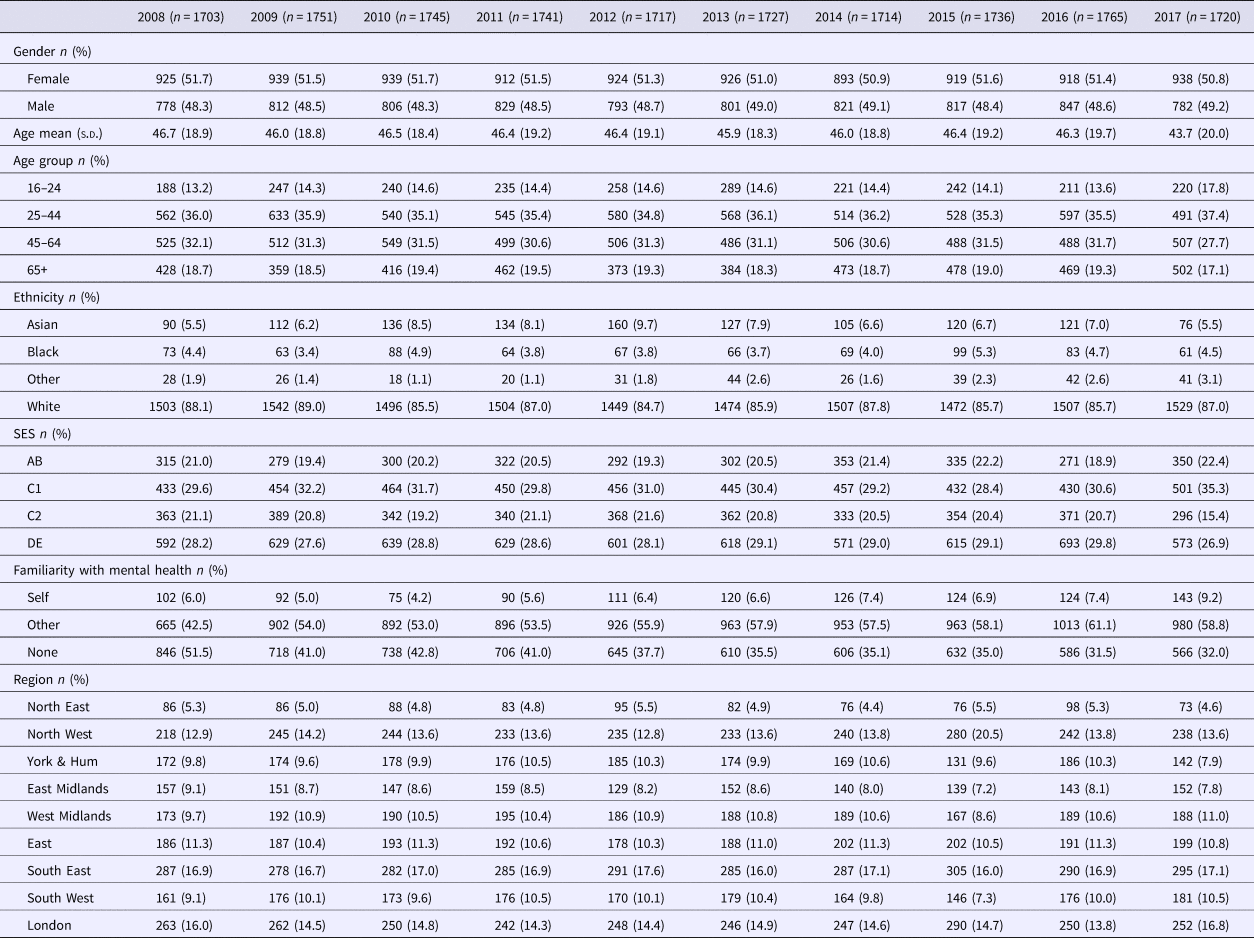
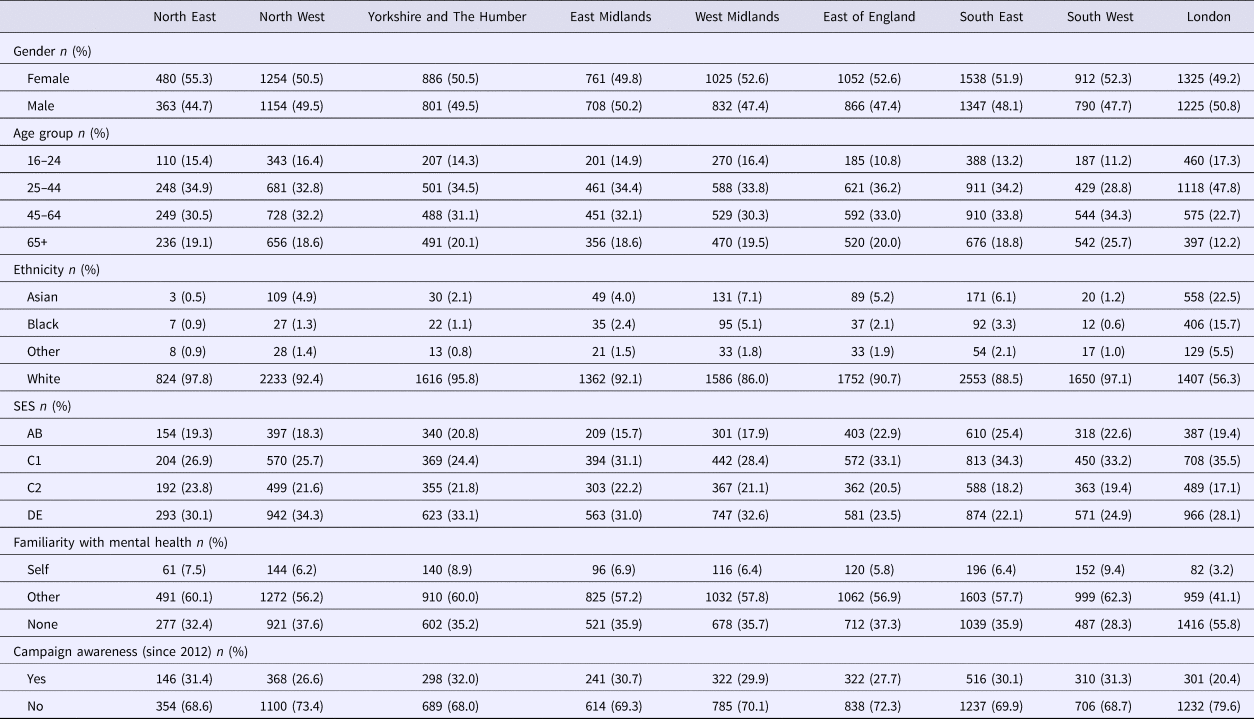
The demographics of participants are reported by survey year in Table 1, which demonstrates the similarities between the samples over time. However, there are noticeable differences illustrated in Table 2, which reports sample characteristics by region, using combined data from all survey years (2008–2017). Specifically, London had the largest proportion of: men (v. women); those in the two youngest age categories (16–44 years); those from non-white ethnic backgrounds (Asian, Black or other); and participants who do not know anyone with a mental health problem. These demographic subgroups have all been shown to be associated with poorer stigma outcomes in previous campaign evaluations (Henderson et al., Reference Henderson, Robinson, Evans-Lacko, Corker, Rebollo-Mesa, Rose and Thornicroft2016) and are controlled for in the regression analyses. London also had the lowest proportion of participants who were aware of the TTC campaign, but campaign awareness is not included in the regression analyses because it has only been included in the survey since 2012 and can be influenced unlike the others. Item level responses from the three outcome scales can be found in the online Supplementary material (Appendixes 1–3).
Participant demographics by survey year, un-weighted frequency and weighted percent

Participant characteristics by government region, un-weighted frequency and weighted percent (2008–2017)

Changes in mental health-related public knowledge
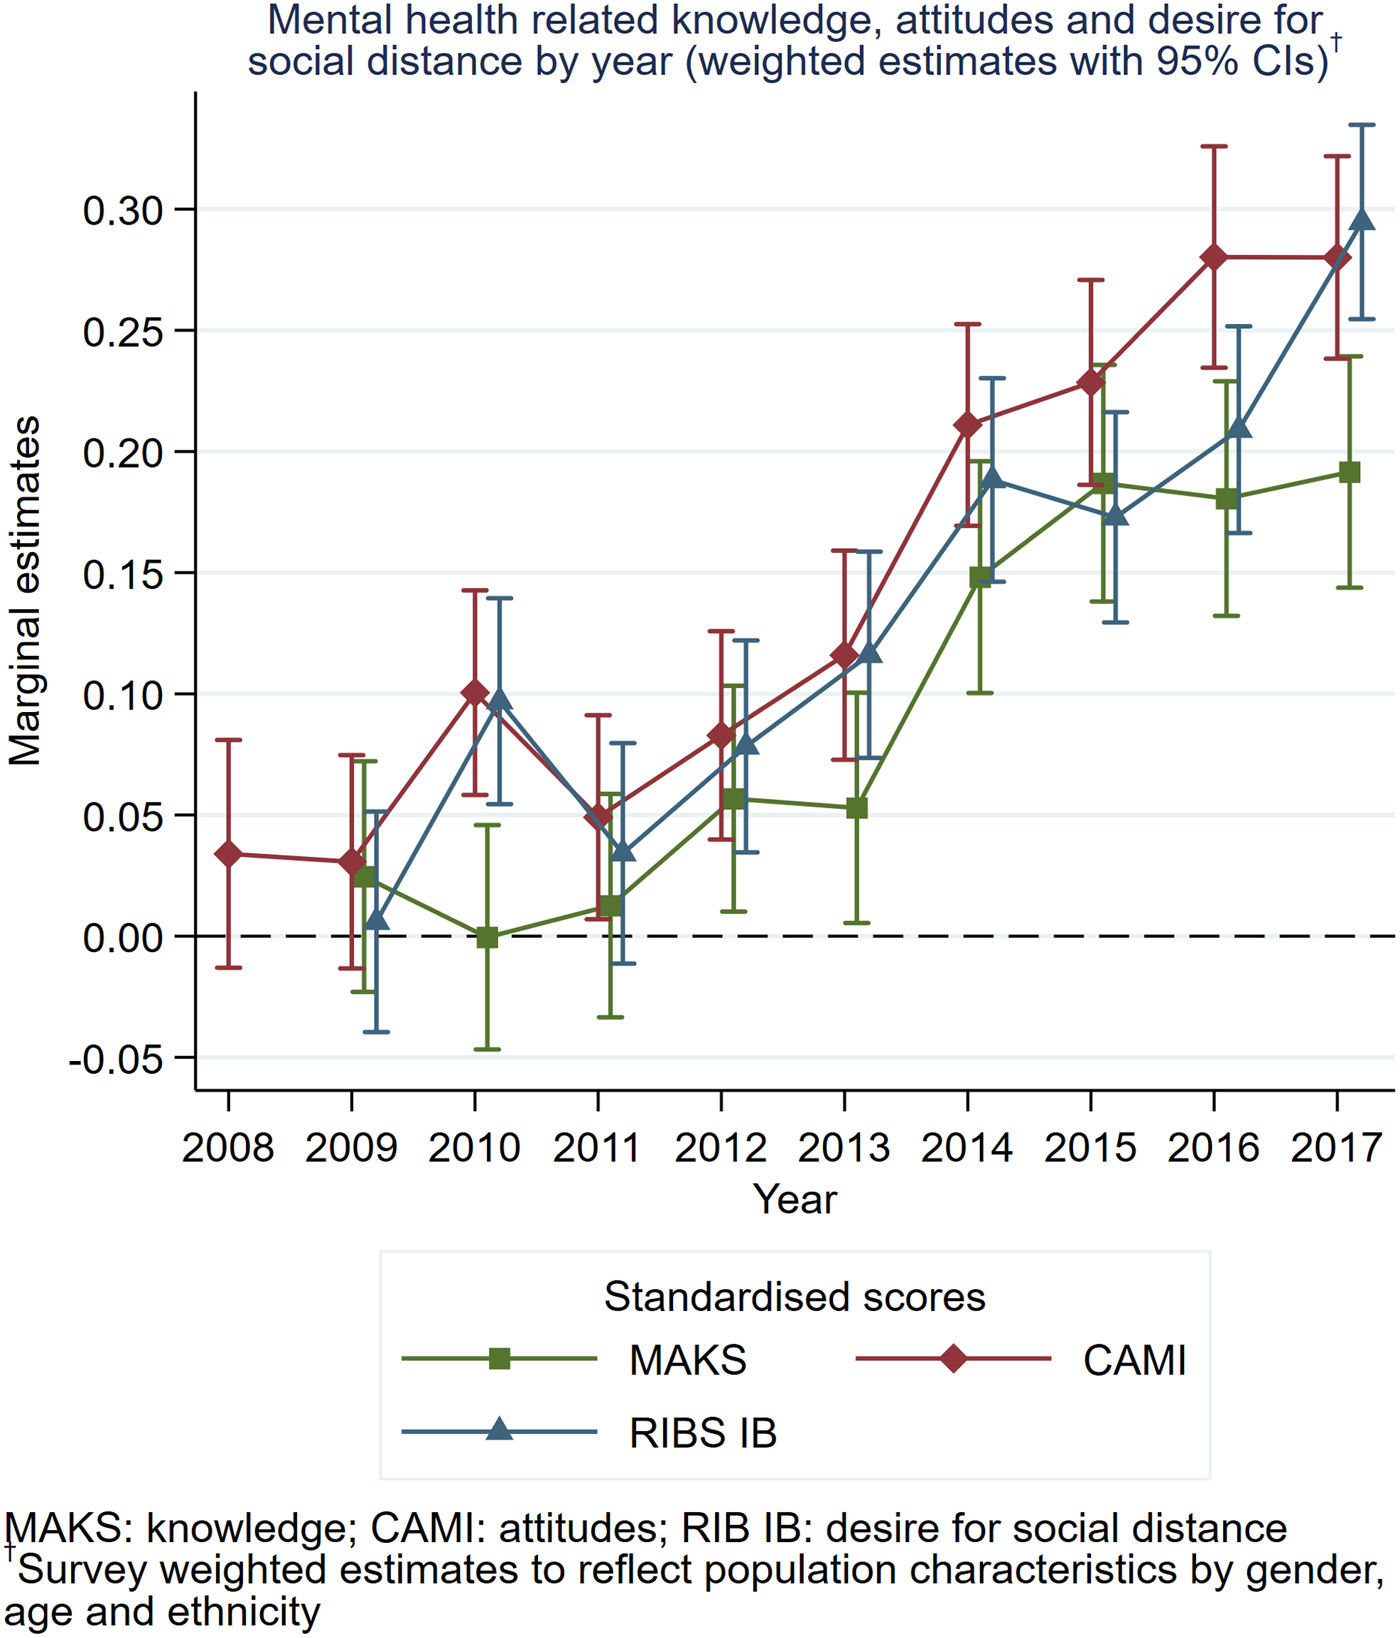
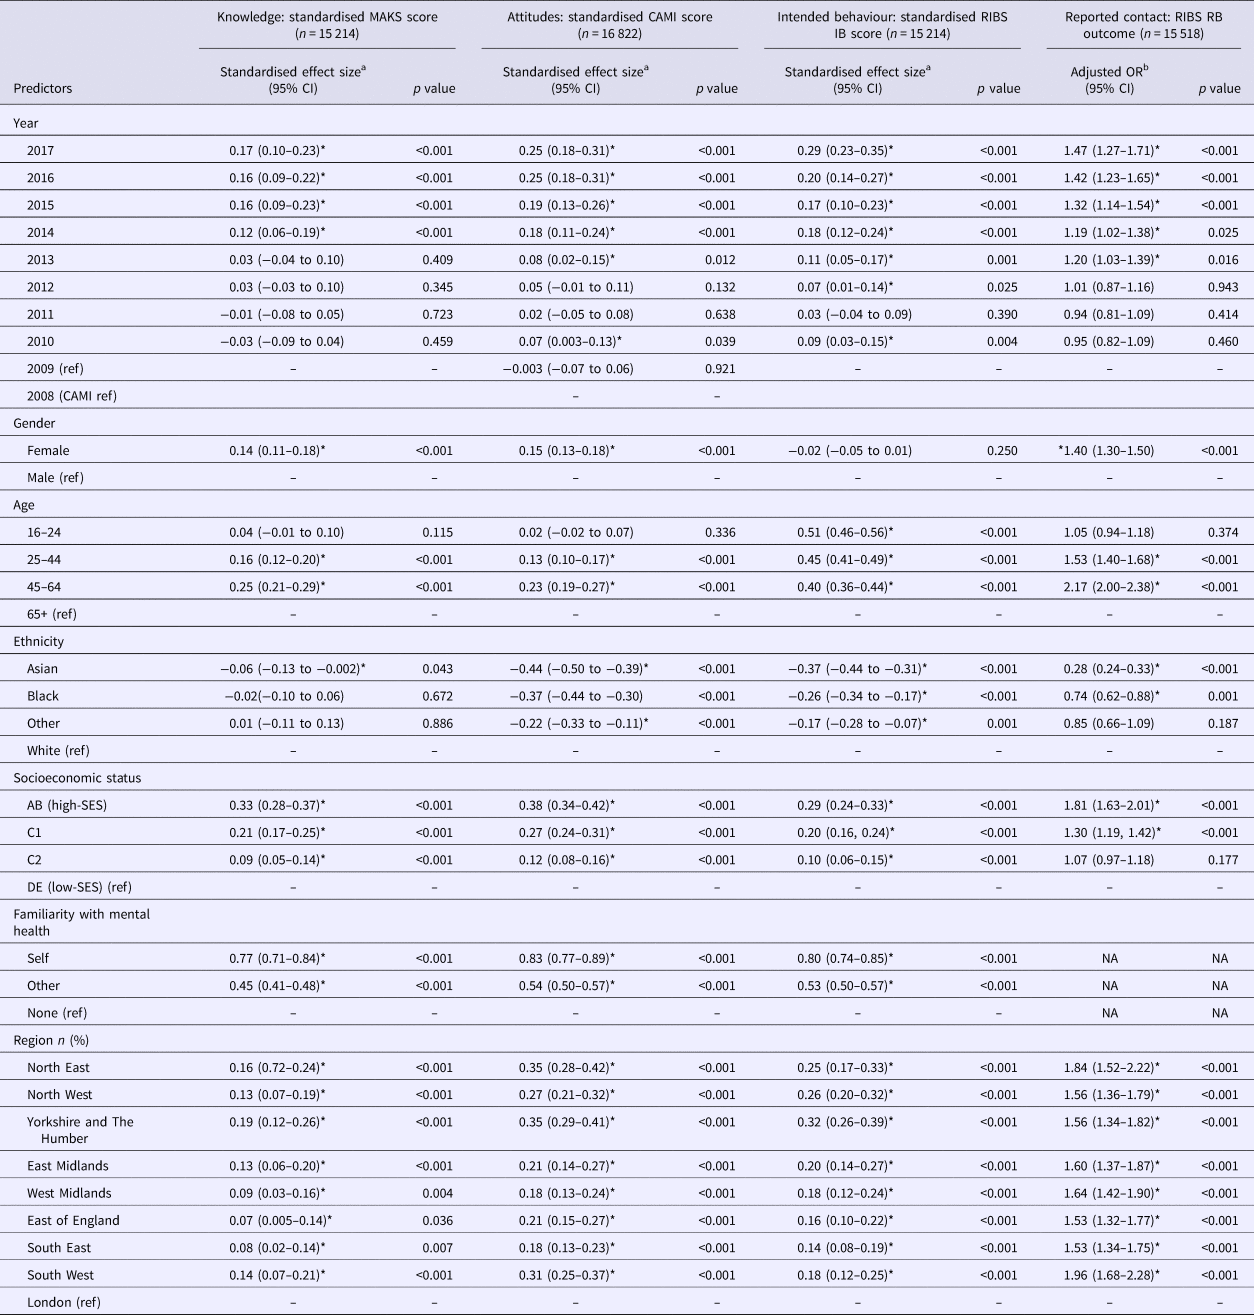
The significant improvements in mental health-related public knowledge that were found previously in 2014 and 2015 in comparison with 2009 (Henderson et al., Reference Henderson, Robinson, Evans-Lacko, Corker, Rebollo-Mesa, Rose and Thornicroft2016) have remained significantly higher than baseline for 2016 and 2017. Participants in 2017 scored 0.17 (0.10–0.23) s.d. units higher on the MAKS scale compared with those sampled and taking part in 2009. Using the distributional approach to calculate comparative proportions (Sauzet et al., Reference Sauzet, Breckenkamp, Borde, Brenne, David, Razum and Peacock2016), this corresponds to an increase in mental health knowledge in around 6.6% of people between 2017 and 2009. Figure 1 illustrates the change over time by plotting the marginal estimates of the standardised MAKS score by year (squares). There were no significant interactions found. This means the improvement in stigma-related knowledge over time has not differed between subgroups of the population.
Marginal estimates of the standardised scores for mental health-related public knowledge (MAKS), attitudes (CAMI) and desire for social distance (RIBS IB) by year to illustrate the changes over time of stigma-related measures.

Changes in mental health-related public attitudes
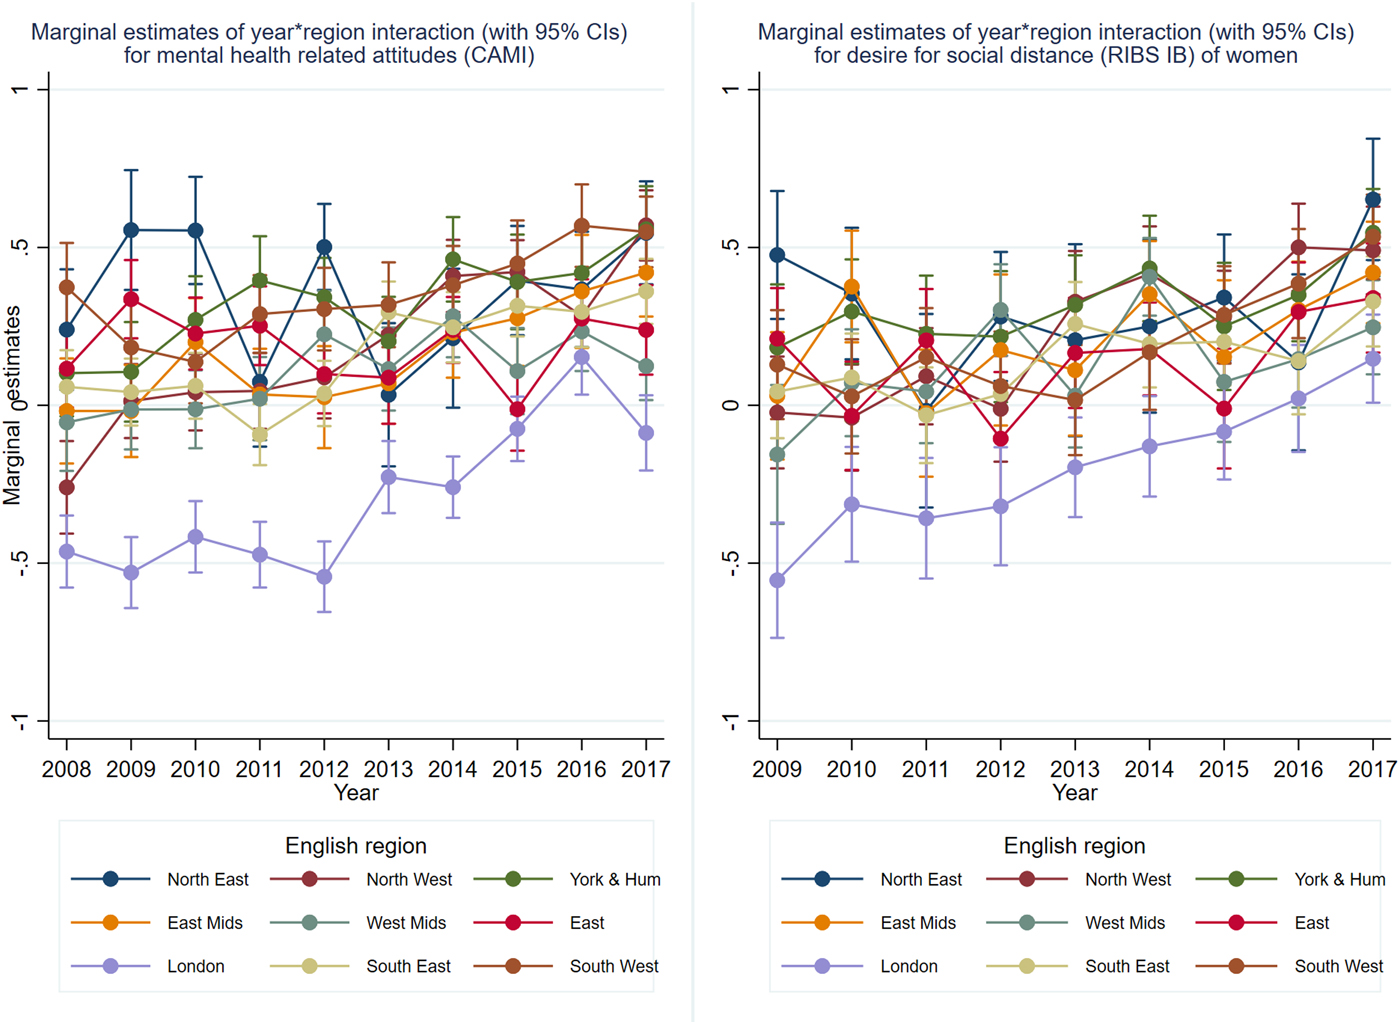
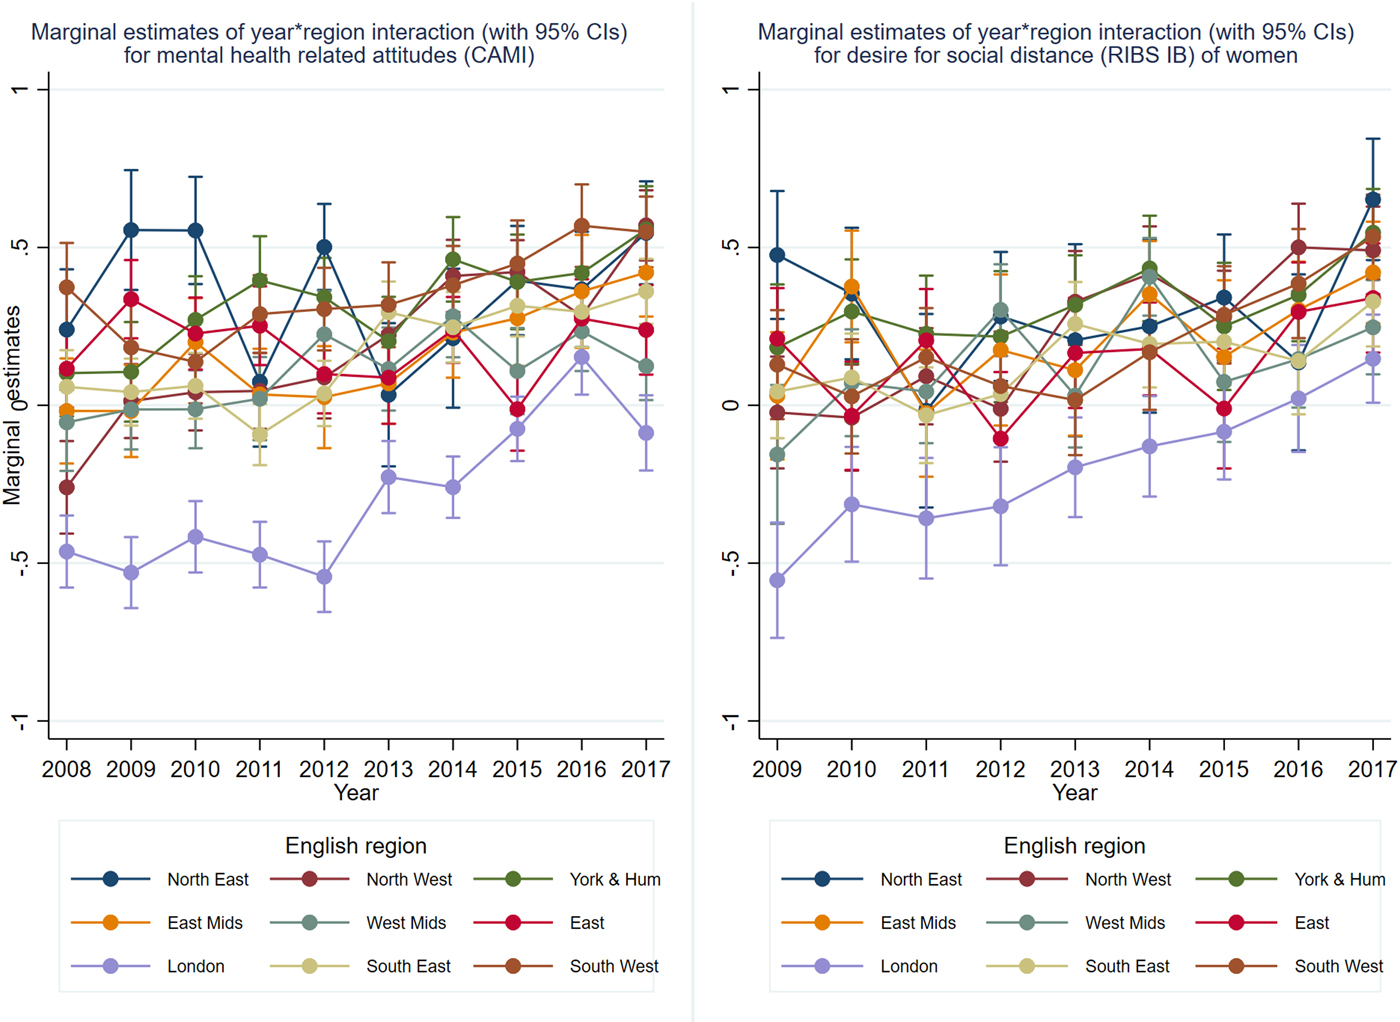
There have been further improvements in mental health-related public attitudes since previous findings. Participants scored 0.25 (0.18–0.31) s.d. units higher on the CAMI scale in 2017 compared with those sampled and partaking in 2008, equivalent to an estimated 9.7% of people's attitudes improving (Fig. 1: diamonds). The interaction found previously between year and age (Henderson et al., Reference Henderson, Robinson, Evans-Lacko, Corker, Rebollo-Mesa, Rose and Thornicroft2016) remained significant (adjusted Wald test p < 0.001) suggesting that the improvement over time differed depending on age-group. An interaction between year and region was also found to be significant (p < 0.001). Figure 2 shows marginal estimates of the standardised CAMI score were significantly lower in London (bottom line) compared with other regions for the early years of TTC. Although they have improved over time, except for last year, participants in London remain the lowest scorers. This interaction remains significant for men and women separately.
Marginal estimates of the interaction between year and region to illustrate how the changes over time differ depending on region: mental health-related public attitudes; and mental health-related public desire for social distance in women.
Changes in public desire for social distance from mental health problems
There have been significant improvements on the RIBS IB scale every year since 2012 compared with 2009, as shown in Fig. 1 (triangle). Participants scored 0.29 (0.23–0.35) s.d. units higher in 2017 compared with those sampled and taking part in 2009, suggesting that the level of desire for social distance has decreased in 11.4% of people since 2009. Furthermore, participants in 2017 scored significantly higher on the RIBS IB scale than in 2015, meaning that this outcome has shown the largest improvement since the last evaluation (Henderson et al., Reference Henderson, Robinson, Evans-Lacko, Corker, Rebollo-Mesa, Rose and Thornicroft2016). There was a significant interaction between year and region (p < 0.001), but this only remained significant when the population was restricted to women and not for men. Figure 2 illustrates the distinctive pattern over time only seen in women in London (bottom line) of a steady increase each year. This suggests there was no longer a difference in women's desire for social distance in 2017 between London and the other regions. No other interactions were significant.
Changes in public reported contact with people with mental health problems
The proportion of participants reporting some contact with people with mental health problems was significantly higher in 2013–2017 compared with 2009, which is illustrated in online Supplementary Appendix 4. For the most recent year, there was a 47.1% (26.5–71.1) higher odds of reporting contact on the RIBS RB scale than in 2009. There was a significant interaction between year and gender (p = 0.029) – found previously also (Henderson et al., Reference Henderson, Robinson, Evans-Lacko, Corker, Rebollo-Mesa, Rose and Thornicroft2016) – which suggests women have had an increasing amount of familiarity with people with mental illness over time. There were also indications of interactions between year and age (p = 0.0179) and year and region (p = 0.0022), but these patterns disappeared when evaluating men and women separately.
Discussion
The findings in this paper provide strong indications that all of the mental health stigma-related outcomes have improved between 2009 and 2017, which is consistent with the most recent evaluation that included data up to 2015 (Henderson et al., Reference Henderson, Robinson, Evans-Lacko, Corker, Rebollo-Mesa, Rose and Thornicroft2016). In particular, there has been a significant improvement on the RIBS IB scale between 2015 and 2017. Self-reported mental health problem(s) remains the strongest positive association with all the outcomes from the regression analyses.
For the six items that create the stigma-related MAKS outcome, all the responses increased in the correct direction over time except for the question regarding medication being an effective treatment. Although it is incorrect to disagree, this response may reflect a generally more positive attitude to nonpharmacological treatments instead. The other MAKS items that ask about which conditions participants consider as mental illnesses have all increased; including stress and grief (which are false). This implies that the public's concept of mental illness is broadening. This could be due to their own experiences of mental illness and its triggers, and again, an incorrect answer may reflect positive and open-minded views; which is consistent with the increases in reporting contact and positive attitudes.
The different patterns and levels of improvement found between age-groups in attitudes and between genders in reporting contact somewhat justifies the changes in campaign tailoring that have been implemented since the last evaluation. For instance, the adult campaign for the third phase of TTC is still aimed at the same target group 25–44, but is now more focused on men as a response to these results.
This study reports for the first time the differences in mental health stigma-related behaviours between London and other regions in England. There is prior evidence from the Health Survey for England (2014) that attitudes to mental illness are more negative in London (Ilic et al., Reference Ilic, Henderson, Henderson, Evans-Lacko, Thornicroft, Craig, Fuller and Mindell2014), but this report is the first to show the regional changes over time. Other previous findings have signified a dose-effect relation between campaign awareness and regional improvement in MAKS and CAMI, but not RIBS (Evans-Lacko et al., Reference Evans-Lacko, Corker, Williams, Henderson and Thornicroft2014) and Table 3 indicates lower awareness in London of the TTC campaign, which may be one contributing factor. Participant characteristics are also different in London compared with the other regions and although the subgroups in Table 3 have been controlled for in the regression analyses, there are likely to be other demographical variables or concepts that have not been measured but may explain some of the variance. For example, using statistics from the 2011 Census (Table CT0562), the proportion of residents born outside of the UK in London (37%) is far greater compared with England and Wales (9%). Further to this, there is a higher prevalence of some mental health problems in London compared with the rest of England (Primary Care Domain NHS Digital, 2015–16), including a higher prevalence of psychoses in particular (Kirkbride et al., Reference Kirkbride, Errazuriz, Croudace, Morgan, Jackson, Boydell, Murray and Jones2012). If the population of London are reporting the least familiarity with mental health problems even though there is the greatest prevalence, then this could be contributing to persistence of negative stereotypes, for example based on exposure to unfamiliar people who are visibly unwell or to local news media.
Regression analyses of predictors of mental health-related knowledge, attitudes and behaviour among the general public

a Multiple linear regression.
b Logistic regression.
*Statistically significant at the p < 0.05 level.
Strengths and limitations of the study
This analysis used a nationally representative dataset from a tailored annual survey for the TTC programme, including specifically targeted baseline measures. However, this was not a controlled study because it is not possible to survey participants in the absence of the TTC programme, therefore we are limited in our ability to attribute changes in the outcomes to the programme. For example, the increased prevalence in anxiety disorders in young women (McManus et al., Reference McManus, Bebbington, Jenkins and Brugha2016) may affect not only reporting having contact but also other outcomes. However, there is research suggesting that mass media interventions on reducing stigma compared with inactivity may have small to medium effects (Schomerus et al., Reference Schomerus, Schwahn, Holzinger, Corrigan, Grabe, Carta and Angermeyer2012) and given that the TTC programme does include a mass media element, our findings may indicate a similar response to such studies. In addition, we have calculated sampling errors even though a quota sample was used. Although this violates some statistical assumptions, treating the data in this way has allowed us to calculate results as if the data were from a probability sample. While probability sampling has been used to measure single aspects of stigma in England (Ilic et al., Reference Ilic, Henderson, Henderson, Evans-Lacko, Thornicroft, Craig, Fuller and Mindell2014; NatCen, 2016), no current epidemiological survey has allowed repeated assessment of multiple aspects over the course of TTC.
Another limitation of our study is that we may have not collected measures that are potential explanatory variables. We have mentioned above that there are likely to be demographic factors we have missed, such as country of birth, but there are other participant characteristics that may have a bearing on the outcomes. The 1903 essay ‘The Metropolis and Mental Life’ by sociologist Georg Simmel introduces the idea that people living in areas of urbanisation have different attitudes to those in more rural areas, which may be connected to the different types of jobs in cities. It has also been shown more recently that urbanicity is associated with the prevalence of psychoses (Heinz et al., Reference Heinz, Deserno and Reininghaus2013). London is the only region in this dataset that is of majority urban, therefore this could be a link that we are missing. We also do not know the differences in regions regarding news coverage of mental illness; research has shown an increase in anti-stigmatising newspaper coverage and a decrease in stigmatising elements (Thornicroft et al., Reference Thornicroft, Goulden, Shefer, Rhydderch, Rose, Williams, Thornicroft and Henderson2013), but it is not clear how this varies by region.
Finally, the survey is not specific in its questions to an area or condition of mental illness; although we know that the public concept of what constitutes a mental illness has widened, we do not know which types of mental health problems the participants have in mind when giving their responses.
Implications
The results reported from this study provide evidence for continued positive changes in stigma outcomes over the course of the TTC programme across demographic subgroups, and supports the notion that inequalities have not widened during the campaign. Instead, inequalities with respect to region of residence and age have narrowed. The third phase of TTC is aimed more at men and at lower socioeconomic groups, to target groups with less positive attitudes. Programmes such as TTC may be further informed by research to improve the understanding of differences in local needs suggested by the differences in stigma-related outcomes and change over time in London compared with other regions. It may be helpful to consider specific communities who are known to have an increased risk of both stigmatisation towards mental illness and higher prevalence, such as black ethnic minorities (Qassem et al., Reference Qassem, Bebbington, Spiers, McManus, Jenkins and Dein2015) and gang members (Coid et al., Reference Coid, Ullrich, Keers, Bebbington, Destavola, Kallis, Yang, Reiss, Jenkins and Donnelly2013). Findings have indicated the importance of considering cultural and religious beliefs when tailoring anti-stigma interventions that may improve engagement (Shefer et al., Reference Shefer, Rose, Nellums, Thornicroft, Henderson and Evans-Lacko2013).
There is a newer campaign targeting the stigma of mental illness in London called ‘Thrive London’ and there could be other campaigns to focus on specific areas of life, such as public transport, which is a significant source of discrimination for mental health service users (Corker et al., Reference Corker, Hamilton, Robinson, Cotney, Pinfold, Rose, Thornicroft and Henderson2016). For example, the Scottish campaign ‘See Me’ had a project aimed at mental health stigma and discrimination on buses, which could be particularly effective in London given the highest rates of people travelling to work by public transport is in the capital, as reported by the ONS 2011 Census Analysis. As these types of tailored campaigning have been tested elsewhere in the UK, this report may suggest ways to maximise the impact of the third phase of the TTC programme in England. However, regional variations in attitudes may be in part driven by variations in structural stigma (Corrigan et al., Reference Corrigan, Markowitz and Watson2004), such as coverage of mental illness in news media, or disparities in funding for physical v. mental health care. Thus, while population attitudes may eventually lead to structural level changes, for example through responses by media organisations to changing market demands, our results suggest that organisations running anti-stigma programmes such as TTC continue to investigate structural level stigma and lobby for changes.
Supplementary material
The supplementary material for this article can be found at https://doi.org/10.1017/S0033291718003677.
Author ORCID
Emily Joanne Robinson, 0000-0002-6692-5415.
Acknowledgements
We are grateful for collaboration on the evaluation by Sue Baker, Paul Farmer and Lisa Muller.
Author contribution
CH conceived the paper, drafted the introduction and edited a full draft of the manuscript. ER conducted the analysis, drafted the methods, results and discussion and finalised the manuscript for submission.
Financial support
The TTC evaluation was funded by the UK Government Department of Health, Comic Relief and Big Lottery Fund. CH was supported by these grants during phases 1–3 of TTC and ER during phases 2–3. The funding source had no involvement in the study design, data or report writing.
Conflict of interest
CH has received consulting fees from Lundbeck and educational speaker fees from Janssen. ER declares no conflict of interest. No authors participated in the planning or execution of TTC.