



Nomenclature
- A c
-
cross-sectional area
- A s
-
surface area
- C p
-
particle specific heat
- d p
-
particle diameter
-
 ${\overline d _{\rm{p}}}$
-
mean particle diameter
- D h
-
channel hydraulic diameter
- e
-
rib height
- f
-
friction factor
- f 0
-
friction factor from modified Blasius correlation
- h
-
heat transfer coefficient
- H
-
height
- k
-
thermal conductivity
- L
-
length
- L c
-
characteristic length
- m
-
mass
-
$\dot m$
-
mass flow rate
- Nu
-
Nusselt number
- Nu 0
-
Nusselt number from Dittus-Boelter correlation
- p
-
rib pitch
- P
-
wetted perimeter of the duct
- P in
-
inlet pressure
- P out
-
outlet pressure
- PEC
-
performance evaluation criterion
- q
-
heat flux
- Q in
-
input heat transfer rate
- Q loss
-
heat loss rate
- Q net
-
net heat transfer rate
- Re
-
Reynolds number
- Stk
-
Stokes number
- T b
-
bulk temperature
- T w
-
wall temperature
- T amb
-
ambient temperature
- u
-
velocity
- W
-
width
- ΔP
-
pressure drop


Greek symbols
-
$\mu$
-
dynamic viscosity
-
$\tau$
∞
-
mainstream characteristic time
-
$\varphi$
p
-
particle volume fraction
-
$\rho$
p
-
particle density
-
$\tau$
p
-
particle relaxation time


Subscripts
- in
-
inlet
- ∞
-
mainstream air
- out
-
outlet
- p
-
particle
- w
-
wall
1.0 Introduction
Particulate pollution, driven by multiple factors including industrial emissions, dust storms and volcanic ash, has intensified globally over recent decades [Reference Guffanti, Casadevall and Budding1, Reference Donkelaar, Martin, Brauer, Kahn, Levy, Verduzco and Villeneuve2]. This trend poses a growing threat to the safe operation and maintenance of various aircraft. As global air traffic increases, flight paths more frequently pass through regions with high concentrations of contaminant particles. During critical phases, such as takeoff, landing, and low-altitude flight, the strong vortices generated by aeroengines can readily ingest fine particles into the intakes [Reference Hamed, Tabakoff and Wenglarz3, Reference Assiri4]. These particles significantly reduce atmospheric visibility, impairing both visual and instrument-based flight operations. Moreover, upon entering the core of an aero-engine, they cause wear and fouling in critical components such as the compressor and the turbine, further leading to performance degradation, increased fuel consumption and a higher risk of unexpected failures. Concurrently, the pursuit of higher efficiency in the next-generation gas turbines demands extremely higher operational parameters, including greater mass flow, temperature rise and pressure ratios. Consequently, the hot turbine component is subjected to increasingly severe thermal and mechanical loads [Reference Wang, Wang, Zhou, Luo, Xie, Liu, Peng and Du5]. This challenging environment drives the evolution of turbine blade design toward higher complexity, more compactness and the integration of multiple functions into a single component. To be more specific, the materials [Reference Tenango-Pirin, Reynoso-Jardón, García, Mariaca, Hernández, Ñeco and Dávalos6, Reference Jude, Jappes and Adamkhan7] and bonding techniques [Reference Luo, Chen, Zhou, Shan, Lu and Zhao8–Reference Latka10] for thermal barrier coatings (TBCs) are continuously improved to ensure structural integrity and durability in high-temperature and high-pressure environments. Meanwhile, film-cooling configurations for external thermal protection are also growing more complex [Reference Wang, Zhang and Zhou11, Reference Zhang, Huang, Zhou, Tian and Liu12]. Internally, cooling channels are meticulously designed to enhance heat transfer under extreme conditions [Reference Courtis, Skamniotis, Cocks and Ireland13–Reference Bunker15].
This drive for sophisticated blade design, however, sharply conflicts with the heightened risk of particulate ingestion. In the turbine’s extremely hot environment, the particles may become partially or fully molten. High-velocity particle-wall impact first causes mechanical damage to the TBCs. Prolonged exposure leads to particle adhesion, infiltration along micro-crack [Reference Ghoshal, Murugan, Walock, Nieto, Barnett, Pepi, Swab, Zhu, Kerner, Rowe, Shiao, Hopkins and Gazonas16, Reference Nieto, Walock, Ghoshal, Zhu, Gamble, Barnett, Murugan, Pepi, Rowe and Pegg17] and high-temperature chemical interaction [Reference Jackson, Zaleski, Poerschke, Hazel, Begley and Levi18], all accelerating coating failure. Simultaneously, film-cooling holes risk clogging due to the build-up of the particles. Sundaram et al. [Reference Sundaram, Barringer and Thole19, Reference Sundaram and Thole20] pointed out that the blockage of just five holes could reduce cooling effectiveness by approximately 30%. Unlike external cooling configurations, the impact of ingested particles on internal cooling channels involves more complex and distinct mechanisms. As the core region for convective heat transfer, the internal channels feature complex flows characterised by separation, reattachment, secondary flows and vortices [Reference Li, Xie and Sunden21–Reference Kong, Ren, Isaev, Liu, Liu and Niu23]. These flow structures dictate particle transport, collision and deposition, while the particle behaviour, in turn, reacts upon the development and evolution of the flow structures, thereby directly governing heat exchange rates. Current research on particle-laden flows in the internal cooling channels has primarily focused on the deposition issues of the particles and their impact on heat transfer performance. In contrast, less attention is paid to how the flow behaviour of the gas-solid two-phase flow itself affects heat transfer characteristics.
Regarding deposition issues, Singh et al. [Reference Singh, Tafti, Reagle, Delimont, Ng and Ekkad24] conducted a large eddy simulation (LES) of particle transport and deposition in a ribbed U-bend cooling channel. Their results indicated that particle impact density was the highest in the first quarter section of the second pass after the 180° turn, and the average particle impact rate in the second pass was globally 28% higher than that in the first pass. Yu et al. [Reference Yu, Liu, Xu, Yao, Hou and Yue25] also studied particle deposition patterns in a ribbed U-bend channel and found that the rib significantly modulates flow features and particle transport. Specifically, in the rib-wall junction regions, lower flow velocities promoted local particle accumulation, making these areas more susceptible to deposition. These studies consistently demonstrate that particle deposition within the internal cooling channels exhibits a pronounced non-uniform distribution. Furthermore, Jain et al. [Reference Jain, Le Moine, Chaussonnet, Flatau, Bravo, Ghoshal, Walock, Murugan and Khare26] noted that particle deposition not only reduced the effective flow area of the cooling channel, thereby decreasing the coolant flow rate, but also formed an additional thermal resistance layer on the wall due to the low thermal conductivity of the deposits. This layer acts similarly to a thermal barrier coating between the blade substrate and the cooling airflow, weakening convective heat transfer and leading to elevated local wall temperatures.
Under realistic aero-engine turbine operating conditions, the temperature of the cooling airflow inside the blades is typically well below the particles’ softening point [Reference Borom, Johnson and Peluso27]. Particles mostly remain in a solid state, forming a gas-solid, two-phase aerosol coolant. In recent years, research on gas-solid two-phase flows has grown substantially, mainly in the fields of gas-solid fluidised beds [Reference Dutta and Basu28–Reference Song, Xiao, Lin, Wang, Tu and Wen30] and industrial waste heat recovery [Reference Li, Zhou, Lu, Yang, Li, Liu and Zhang31–Reference Feng, Dong, Gao, Li and Liu33], however. For example, Dutta et al. [Reference Dutta and Basu28] investigated heat transfer in a circulating fluidised bed boiler using silica-alumina ceramic and sand as the solid phase. They found that the heat transfer coefficient increased with the particle circulation rate but decreased with larger particle sizes. The flow configurations and thermal boundary conditions in these applications differ significantly from those in the turbine blade internal cooling channels due to the presence of complex rib turbulators, highly sheared turbulent flow fields, and spatially confined geometries. Within the research of gas-solid two-phase flows in the turbine blade internal cooling channels, the nano-aerosol coolant concept proposed by Yang et al. [Reference Yang and Feng34, Reference Yang and Feng35] is considered representative. This innovative approach involves dispersing nanoparticles into a liquid carrier to form a colloidal suspension, which is subsequently atomised and injected into a high-temperature air stream. Upon exposure to the elevated temperatures, the liquid carrier vaporises rapidly, while the high-melting-point nanoparticles remain solid, thereby generating a uniformly distributed gas-solid, two-phase mixture. By enhancing turbulence and leveraging phase-change heat absorption, the nano-aerosol coolants significantly augment convective heat transfer performance. Long et al. [Reference Long, Yang and Feng36, Reference Long, Yang and Feng37] numerically investigated the heat transfer characteristics of such nano-aerosols in a turbine blade internal cooling channel. Their results indicated that while the introduction of particles inevitably increased the total pressure drop, the overall thermal performance could be improved by selecting an appropriate particle diameter. More recently, Zhang et al. [Reference Zhang, Long, Hu, Liang, Yang and Feng38] conducted numerical simulations using an in-house computational framework, heat and mass transfer simulations for gas turbine nano-aerosol cooling with phase changes (HMTS-GTNA). They compared the aerodynamics and heat transfer characteristics of nano-aerosols with three conventional coolants, i.e. air, steam and mist/air, in a double-wall-cooled vane. Due to the phase-change-enhanced heat transfer mechanism, the nano-aerosol coolants achieved the highest overall cooling effectiveness. In summary, the current understanding of gas-solid two-phase flows in the turbine blade internal cooling channels relies primarily on numerical simulations, with experimental data and detailed mechanistic interpretations remaining scarce.
To address the gaps in the existing experimental data, this paper used a combined experimental and numerical approach to examine the coupled flow and heat transfer mechanisms of gas-solid two-phase flows under non-phase-change conditions within a typical blade internal cooling channel. The effects of particle sizes and Reynolds numbers (Re) were examined. The findings are expected to deepen the understanding of particle-turbulence-wall interactions and provide a basis for evaluating the impact of particle ingestion on turbine blade cooling performance.
2.0 Experimental methodology
2.1 Experimental facility and test section
The experimental system used to investigate the heat transfer characteristics of aerosols is illustrated in Fig. 1. The facility was run by a crew compressor unit. A bypass air source was used to drive an aerosol generation section to deliver dry copper particles into the airflow. The copper particles were selected for their controllable sizes and morphologies. The particles were spherical, and five distinct mean diameters were used: 0.65, 2, 16, 30 and 100
 $\unicode{x03BC}$
m. They were uniformly mixed with the primary airflow in a Y-shaped converging section, forming a stable gas-solid aerosol coolant. The aerosol coolants then flowed into the experimental section. The experimental section consisted of three parts, with the heat transfer test section positioned between an upstream flow-conditioning section and a downstream contraction section. Then, the aerosol coolants were directed to a particle filtration and recovery container, ensuring uncontaminated discharged exhaust.
Experimental facility for measuring aerosol heat transfer.

Figure 1. Long description
A diagram of an experimental facility for measuring aerosol heat transfer. The diagram includes several sections: Bypass air source, Primary air source, Aerosol generation section, and Experimental section. The Bypass air source section features a reciprocating air compressor and a mass flow controller. The Primary air source section includes a screw air compressor and another mass flow controller. The Aerosol generation section contains a spray controller, valve, powder cup, fluidizing plate, and powder pump, which handles copper particles. The Experimental section includes a Y-shaped converging section, contraction section, test section with ribs and insulating blocks, flow-conditioning section, copper plate, foil heater, and insulating structure. The flow moves from the air compressors through the aerosol generation section and into the experimental section, where heat transfer and flow resistance are measured.
The heat transfer test section consisted of eight identical copper plates serving as heated walls. The ribbed side of each plate was exposed to the coolants, while the backside was heated by parallelly connected polyimide foil heaters. Insulating material was inserted between adjacent copper plates to eliminate lateral heat conduction. All non-heated channel walls and the rib structures were fabricated from acrylic with a low thermal conductivity of approximately 0.19 W
 $\cdot$
m−1
 $\cdot$
K−1. The entire assembly was encapsulated within a rubber-plastic composite insulation layer (thermal conductivity of 0.034 W
 $\cdot$
m−1
 $\cdot$
K−1) to minimise heat losses to the ambient environment. Two blind holes were machined on the back side of each copper plate. T-type thermocouples, secured in these holes with high-thermal-conductivity paste, provided temperature measurements; the average of the two readings represented the local wall temperature. Additional thermocouples were positioned 1 mm away from the heated walls at both the channel inlet and outlet to measure the fluid temperature. Static pressure taps were installed to acquire the pressure drop across the flow passage. When the system reached steady-state conditions under air operation, the corresponding temperature and pressure data were recorded. Copper particles were then introduced uniformly into the flow. Following a stabilisation period of approximately 300 s, the system regained steady states, and the temperature and pressure parameters were recorded again.
A three-dimensional schematic of the heat transfer test section is shown in Fig. 2. The ribbed cooling channel is a straight rectangular duct with a total length of 560 mm (L 1 + L 2 + L 3). The flow direction is defined as the positive x-axis, and the inlet cross-section measures 20 × 10 mm (aspect ratio = 2:1). The heated section has a length of 360 mm (L 2). Eight identical copper plates (40 × 20 × 4 mm) are mounted along the base wall, with 5 mm (L 4) spacing between adjacent plates filled with low-thermal-conductivity silicone rubber inserts. The heated wall is uniformly divided into eight streamwise sections (labelled Parts 1 through 8), with each section corresponding to an individual copper plate. Attached to each copper plate are two turbulence-promoting ribs, designed in a 45° V-shape with a height of e = 2 mm and a pitch of p = 20 mm (p/e = 10).
Geometric configurations of the heat transfer test section.

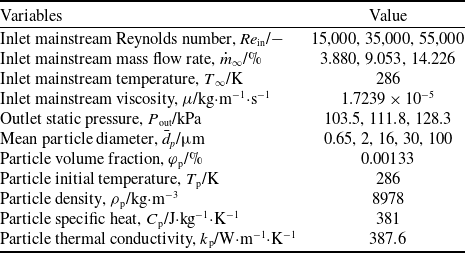
In the present experiments, the heat transfer characteristics of aerosol coolants in the ribbed cooling channel were investigated by varying the inlet mainstream Re and particle diameters. The mainstream flow conditions and particle properties are summarised in Table 1.
Mainstream flow and particle properties

Table 1. Long description
A table summarizing mainstream flow conditions and particle properties. The table has 11 rows and 2 columns. The columns are labeled ’Variables’ and ’Value’. Row 1: Inlet mainstream Re, 15,000, 35,000, 55,000. Row 2: Inlet mainstream mass flow rate, 3.880, 9.053, 14.226. Row 3: Inlet mainstream temperature, 286. Row 4: Inlet mainstream viscosity, 1.7239 x 10^-5. Row 5: Outlet static pressure, 103.5, 111.8, 128.3. Row 6: Mean particle diameter, 0.65, 2, 16, 30, 100. Row 7: Particle volume fraction, 0.00133. Row 8: Particle initial temperature, 286. Row 9: Particle density, 8978. Row 10: Particle specific heat, 381. Row 11: Particle thermal conductivity, 387.6.
2.2 Data reduction
2.2.1 Mass flow rate calculations
For each operating Re, the required mass flow rates of air and copper particles are calculated separately. The Re reported in this study are defined based on the inlet mainstream air. The bulk temperature measured at the channel inlet was approximately 286 K; therefore, the thermophysical properties of air at 101.3 kPa and 286 K were used for the calculations, with the dynamic viscosity (
 $\mu$
) being 1.7239 × 10⁻⁵ kg
 $\cdot$
m−1
 $\cdot$
s−1. The mass flow rate is deduced by
 \begin{align} Re = \frac{{\rho {u_\infty }{D_{\rm{h}}}}}{\mu } = \frac{{\dot m{D_{\rm{h}}}}}{{\mu {A_{\rm{c}}}}}\end{align}
 \begin{align} {D_{\rm{h}}} = \frac{{4{A_{\rm{c}}}}}{P} = \frac{{4{A_{\rm{c}}}}}{{WH}} \end{align}
 \begin{align} \dot m = \frac{{Re\mu WH}}{4} \end{align}
where D h is the hydraulic diameter of the rectangular straight channel, and A c is the cross-sectional area at the channel inlet. P denotes the wetted perimeter of the channel.
Based on these calculations, the mass flow rates of the total inlet mainstream air corresponding to Re of 15,000, 35,000 and 55,000 are 3.880, 9.053 and 14.226 g/s, respectively. Two mass flow regulators (ALICAT, USA) were used in the experiments, one in the primary gas line and another in the bypass gas line, to control the total mass flow rates entering the heat transfer test section to reach the above calculated values. The mass flow ratio of the primary and bypass gases was held at a ratio of 0.85:0.15, ensuring uniform particle release with a volume fraction of 0.00133% relative to the airflow.
2.2.2 Heat loss calibrations
Figure 3 illustrates the heat flux transfer model for a single copper plate. The input heat flux supplied by the heater (Q in,i ) is partially used to heat the copper plate, with a portion dissipated to the ambient via convection and radiation (Q loss,i ). The residual serves as the net input heat flux (Q net,i ), which is removed from the wall by convective heat transfer to the coolants. Given that the eight parallel heaters have identical electrical resistance, the heat flux supplied to each copper plate is equal, corresponding to 1/8 of the total electrical output power. Prior to the actual experiment, a heat loss calibration was performed. The test section was filled with a thermal insulation material to suppress convective heat transfer within the channel, thereby ensuring that the heat supplied by the heaters, with the exception of the portion used to heat the copper plates, was dissipated to the ambient environment.
Schematic of the heat flux transfer model.

Following the steady-state, regionally averaged heat transfer measurement technique proposed by Han et al. [Reference Han and Wright39], the heat losses of the channel were determined through a ‘no-flow’ experiment. Power was supplied to the heaters, with two distinct power settings to generate two sets of wall-temperature data. The two temperature sets were selected such that one fell below the expected wall temperature in the actual experiments (the ‘Low’ calibration), while the other exceeded the expected wall temperature (the ‘High’ calibration). The wall temperature distributions obtained during the actual experiments and the heat loss calibration are presented in Fig. 4. As indicated by the horizontal axis in Fig. 4, the streamwise dimension x is normalised by the channel hydraulic diameter, and the position of each region is defined by the midpoint along the x-axis.
Wall temperature profiles from the actual experiments and the heat loss calibrations.

By establishing the two-temperature range that bracketed the actual wall temperature, the actual heat loss during the heat transfer test was determined via linear interpolation. Since the driving temperature difference for heat loss originated from the temperature difference between the heated walls and the ambient room, the ambient room temperature was accounted for in the heat loss calculation. The room temperature was recorded during each calibration test as well as throughout the experiments. The heat loss, Q loss,i , is calculated by [Reference Han and Wright39]
 \begin{align} {Q_{{\rm{loss}},i}} = \left[ {\frac{{{Q_{{\rm{H}},i}} - {Q_{{\rm{L}},i}}}}{{({T_{{\rm{H,w}}i}} - {T_{{\rm{H,amb}}}}) - ({T_{{\rm{L,w}}i}} - {T_{{\rm{L,amb}}}})}}} \right]\left[ {({T_{{\rm{w}}i}} - {T_{{\rm{amb}}}}) - ({T_{{\rm{L,w}}i}} - {T_{{\rm{L,amb}}}})} \right] + {Q_{{\rm{L}},i}} \end{align}
where Q and T denote heat flux and temperature, respectively; the subscripts H and L denote the ‘High’ and ‘Low’ calibration conditions; w and amb refer to the wall surface and the ambient, respectively; the subscript i indicates the i-th region.
2.2.3 Heat transfer coefficient calculations
The local bulk temperature along the channel (T b,i ) is determined by linear interpolation between the inlet and outlet measurements. The regionally averaged heat transfer coefficient for each plate (h i ) is calculated by
 \begin{align} {h_i} = \frac{{{Q_{{\rm{net}},i}}/{A_{\rm{s}}}}}{{{T_{{\rm{w}},i}} - {T_{{\rm{b}},i}}}}\end{align}
where A s denotes the heat transfer area of each copper plate, determined from its exposed geometric dimensions. The net heat input for region i is defined as the sum of the heat supplied to the corresponding copper plate, minus the heat loss,
 \begin{align} {Q_{{\rm{net}},i}} = {Q_{{\rm{in}},i}} - {Q_{{\rm{loss}},i}}\end{align}
The convective heat transfer coefficient is normalised as the Nusselt number (Nu), defined by Equation (7). Heat transfer enhancement is characterised by the normalised Nu ratio, Nu/Nu 0, where Nu 0 denotes the reference Nu for a smooth pipe under fully turbulent flow conditions, which is approximated by the Dittus-Boelter correlation [Reference Kays, Crawford and Weigand40]. The regionally averaged Nu ratios are calculated according to Equation (8).
 \begin{align} Nu = \frac{{h{D_{\rm{h}}}}}{k} \end{align}
 \begin{align} {\left( {\frac{{Nu}}{{N{u_0}}}} \right)_i} = \frac{{N{u_i}}}{{{{\left( {N{u_0}} \right)}_i}}} = \frac{{{h_i}{D_{\rm{h}}}}}{{0.023R{e^{0.8}}P{r_i}^{0.4}{k_i}}} \end{align}
where k and Pr denote the thermal conductivity and Prandtl number of the air, respectively.
2.2.4 Frictional factor and performance evaluation criterion calculations
The pressure drop (ΔP) across the channel is determined from the measured inlet and outlet pressures and is used to calculate the friction factor of the ribbed channel according to Equation (9). To characterise the additional flow resistance relative to a smooth channel, the measured friction factor is normalised with the correlation-predicted value for a fully developed turbulent flow in a smooth pipe, given in Equation (10), which is applicable for Re in the range of 104
 $\lt$
Re
 $\lt$
106 [Reference Han and Wright39].
 \begin{align} f = \frac{{\Delta P{D_{\rm{h}}}}}{{2\rho {u^2}L}}\end{align}
 \begin{align}{f_{\rm{0}}} = 0.046R{e^{ - 0.2}}\end{align}
Following the criterion of Webb and Eckert [Reference Webb and Eckert41] based on equal pumping power for roughened and smooth surfaces, the performance evaluation criterion (PEC) is employed to evaluate the thermal-hydraulic performance, specifically to assess whether the heat transfer enhancement provided by the aerosols in the ribbed channel outweighs the accompanying pressure loss penalty. The PEC is calculated by
 \begin{align} PEC = \frac{{Nu/N{u_0}}}{{{{\left( {\,f/{f_0}} \right)}^{1/3}}}}\end{align}
Here, PEC
 $\gt$
1 implies that the heat transfer gain exceeds the pressure loss penalty, and PEC
 $\lt$
1 indicates that the heat transfer enhancement does not compensate for the increased flow resistance.
2.2.5 Stokes number calculations
The trajectories of particles within the mainstream airflow are governed by the Stokes number (Stk), which quantifies the ratio of the particle relaxation time (
 $\tau$
p) to the characteristic time scale of the fluid flow (
 $\tau$
∞). Specifically,
 $\tau$
p represents the time required for a particle to respond to changes in the fluid velocity, while
 $\tau$
∞ is the characteristic time of the fluid flow based on the channel characteristic length and the particle velocity. When Stk
 $\lt$
1, the particle closely follows the flow of the fluid and tracks its fluctuations. When Stk
 $\approx$
1, although the particle cannot closely follow individual fluid elements, its trajectory is still influenced by flow unsteadiness. When Stk
 $\gt$
1, the particle no longer responds significantly to flow fluctuations. The Stk is defined by [Reference Longmire and Eaton42]
 \begin{align} Stk = \frac{{{\tau _{\rm{p}}}}}{{{\tau _\infty }}}\end{align}
where
 \begin{align} {\tau _{\rm{p}}} = \frac{{{\rho _{\rm{p}}}{d_{\rm{p}}}^2}}{{18{\mu _\infty }}} \end{align}
 \begin{align} {\tau _\infty } = \frac{{{L_{\rm{c}}}}}{{{u_{\rm{p}}}}} \end{align}
Here,
 $\rho$
p, d
p, and u
p denote the particle density, diameter and velocity, respectively;
 $\mu$
∞ is the fluid viscosity, and L
c is the characteristic length. In this study, the channel hydraulic diameter D
h was taken as the characteristic length. The Stk corresponding to the five particle diameters under different Re are tabulated in Table 2.
Stokes numbers of the particles with different diameters

Table 2. Long description
A table comparing Stokes numbers of particles with different diameters under various Reynolds numbers. The table has five columns and four rows. The column headers are dp = 0.65 um, dp = 2 um, dp = 16 um, dp = 30 um, and dp = 100 um. The row labels are Re = 15,000, Re = 35,000, and Re = 55,000. Row 1: dp = 0.65 um, 0.01; dp = 2 um, 0.14; dp = 16 um, 9.03; dp = 30 um, 31.73; dp = 100 um, 352.60. Row 2: dp = 0.65 um, 0.03; dp = 2 um, 0.33; dp = 16 um, 21.06; dp = 30 um, 74.05; dp = 100 um, 822.76. Row 3: dp = 0.65 um, 0.05; dp = 2 um, 0.52; dp = 16 um, 33.10; dp = 30 um, 116.36; dp = 100 um, 1292.92.
2.3 Uncertainty analysis
The uncertainty analysis follows the experimental uncertainty methodology proposed by Moffat [Reference Moffat43]. The relative error of the instrument used for measuring the mainstream mass flow rate was ±0.60%; the relative error of the pressure-measurement instrument was ±0.05%. The heat fluxes supplied by the heaters were determined based on the applied voltage and current. The relative error of the power-supply voltage was ≤0.01% ±3 mV, and that of the current was ≤ 0.20% ±5 mA. During the tests, the applied voltage ranged from 10 to 17 V and the current from 2.5 to 4.5 A, resulting in a relative uncertainty of ±0.04% for the voltage and ±0.4% for the current. Class-I T-type thermocouples were employed, which had a temperature uncertainty of ±0.5 K. During the experiments, the wall-temperature range was 299 K
 $\lt$
T
w
 $\lt$
307 K, corresponding to a relative uncertainty of ±0.17%. The mainstream temperature range was 285 K
 $\lt$
T
b
 $\lt$
292 K, leading to a relative uncertainty of ±0.18%. For the indirect parameters, the calculated relative errors were ±1.17% for the Re, ±2.95% for the heat transfer coefficient (h), and ±3.29% for the Nu ratio (Nu/Nu
0).
3.0 Numerical setup
To gain deeper insight into the flow and heat transfer mechanisms and to supplement the experimental measurements with detailed flow-field information inside the ribbed channel, numerical simulations were conducted using the ANSYS FLUENT software. For modelling the two-phase aerosol coolants, the Eulerian-Eulerian approach was adopted following the work of Long et al. [Reference Long, Yang and Feng36], in which both the gas and solid phases were treated as interpenetrating continua. The mass, momentum and energy exchange between the two phases are described by solving separate sets of conservation equations for each phase. Elreafay et al. [Reference Elreafay, Salem, Abumandour, Dawood and Al Nuaimi44] also employed this approach to investigate the influence of particle parameters on gas-solid two-phase turbulence, revealing complex phenomena such as particle dispersion, turbulence modulation and pressure drop. Furthermore, the SST k-
 $\omega$
turbulence model was selected for its ability to accurately resolve near-wall flows and flow separation, which is essential for capturing the flow separation and reattachment induced by the rib structures.
As shown in Fig. 5(a), polyhedral unstructured meshes were generated using the FLUENT MESHING software, with local refinement applied to the region near the ribbed walls. To resolve the near-wall flow and heat transfer accurately, high-quality prism boundary-layer grids were applied at the walls. The first grid layer height was set to 5 × 10− 6 m with a growth ratio of 1.15 over 20 layers, ensuring the y + of the first layer is less than 1.
Mesh generation and grid independence tests. (a) Meshes of the computational domain with boundary conditions. (b) Grid independence analysis.

To evaluate the influence of grid density on the numerical results, four different grid sizes were generated, with cell counts of 0.94, 1.65, 3.01 and 5.71 million. Figure 5(b) presents the regional wall temperatures on the ribbed side of the channel obtained for all four grid configurations. The wall temperatures computed with the grids of 3.01 million and 5.71 million cells are almost identical. Therefore, considering the trade-off between computational resources and accuracy, the grid with 3.01 million cells was selected for all subsequent simulations.
The boundary conditions for the numerical simulations were set in consistent with the experiments. Specifically, the inlet was specified as a mass flow inlet and the outlet as a pressure outlet, with detailed values listed in Table 1. The ribbed walls were subjected to a constant heat flux condition, corresponding to 3,790 W
 $\cdot$
m−2 at Re = 15,000, 6,437 W
 $\cdot$
m−2 at Re = 35,000, and 8,831 W
 $\cdot$
m−2 at Re = 55,000. In the ANSYS FLUENT, the pressure-based coupled solver was employed to solve the steady, three-dimensional, compressible Reynolds-averaged Navier Stokes (RANS) equations. The RANS approach was chosen because it provides a practical compromise between computational cost and engineering accuracy for the turbulent flows considered in this study, and it is widely used in similar internal cooling channel investigations [Reference Saha and Acharya45, Reference Gordeev, Arbeiter and Ruck46]. Diffusion terms were discretised using a second-order, central-difference scheme, while a first-order upwind scheme was applied to the convective terms to enhance numerical stability and convergence.
4.0 Results and discussion
4.1 Heat transfer
This section systematically investigates the effects of particle sizes and Re on the heat transfer characteristics of aerosol coolants in the internal cooling channels, at both overall and regional levels. The experimental study encompasses five particle sizes of 0.65, 2, 16, 30 and 100
 $\unicode{x03BC}$
m and three Re of 15,000, 35,000 and 55,000.
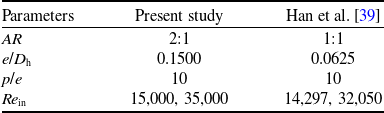
To verify the reliability of the experimental system, the regionally averaged Nu ratios obtained in this study under air-flow conditions were compared with the experimental data reported by Han et al. [Reference Han and Wright39], as plotted in Fig. 6. Although both studies employ a straight channel with 45° ribs, differences in geometric configurations and inlet Re exist, as indicated in Table 3, resulting in discrepancies in heat transfer magnitude. However, the streamwise distribution of the regionally averaged Nu ratios obtained in the present work share a similar tendency with that reported by Han et al., where the ratios peak near the inlet and then decay downstream. Furthermore, with increasing Re, the two datasets exhibit a consistent downward trend in the regionally averaged Nu ratios. Note that the results presented in Fig. 6 for the present study are the average values from five airflow tests, which were conducted prior to the release of particles. As shown in Fig. 8, under the same Re, the streamwise distributions of the regionally averaged Nu ratios exhibit good repeatability in both magnitude and trend. In summary, the experimental system established in this study proves capable of reliably characterising convective heat transfer in ribbed channels and serves as the platform for all subsequent experiments.
Validation of experimental setup reliability based on the Nu ratios.

Comparison of experimental configurations

Table 3. Long description
A table comparing experimental configurations between the present study and Han et al. The table has four rows and five columns, including column headers. The columns are labeled Parameters, Present study, and Han et al. The rows list different parameters: AR, e/Dh, p/e, and Re_in, with their respective values. Row 1: AR, 2:1, 1:1. Row 2: e/Dh, 0.1500, 0.0625. Row 3: p/e, 10, 10. Row 4: Re_in, 15,000, 35,000, 14,297, 32,050.
Figure 7 reveals the overall averaged Nu ratios for the aerosol coolants with different particle sizes on the ribbed walls as a function of Re, along with data from airflow as a baseline. Globally, the Nu ratios for all particle sizes decrease with increasing Re, consistent with the heat transfer performance of airflows. A further analysis reveals that the effect of particle sizes on heat transfer characteristics is closely related to the flow regime. At Re = 15,000, the small particle of 0.65
 $\unicode{x03BC}$
m exhibits superior heat transfer capability, with a Nu ratio of 2.81, whereas the larger particle of 100
 $\unicode{x03BC}$
m yields a lower ratio of 2.75. However, at higher Re, the larger particle of 100
 $\unicode{x03BC}$
m demonstrates better heat transfer efficiency than the smaller ones. For instance, at Re = 55,000, the Nu ratio for the 100
 $\unicode{x03BC}$
m particle reaches 2.16, compared to 2.08 for the 0.65
 $\unicode{x03BC}$
m particle. This phenomenon indicates that the heat transfer efficacy (enhancement or deterioration) of aerosol coolants is governed by the interplay between particle sizes and Re, and the optimal particle size for heat transfer enhancement varies dynamically with the mainstream flow conditions rather than being a fixed parameter. Comparison with the air baselines confirms this observation.
Overall averaged Nu ratios for the aerosol coolants and the airflows.

Figure 7. Long description
A line graph showing the overall averaged Nu ratios for aerosol coolants and airflows at different particle diameters. The horizontal axis represents particle diameter in micrometers (0.65, 2, 16, 30, 100), and the vertical axis represents the Nu ratio (ranging from 1.9 to 2.9). The graph includes four data series: Re equals 15,000 (Aerosol) represented by blue squares, Re equals 35,000 (Aerosol) represented by gray triangles, Re equals 55,000 (Aerosol) represented by orange circles, and Air represented by black circles. The graph shows trends for each data series across different particle diameters. The legend indicates the different data series. Specific maximum and minimum values are annotated on the graph for each data series.
Comparisons of streamwise regionally averaged Nu ratio distributions between aerosols and air under different Re: (a)
 ${\bar d_p}$
= 0.65
 $\unicode{x03BC}$
m, (b)
 ${\bar d_p}$
= 2
 $\unicode{x03BC}$
m, (c)
 ${\bar d_p}$
= 16
 $\unicode{x03BC}$
m, (d)
 ${\bar d_p}$
= 30
 $\unicode{x03BC}$
m, and (e)
 ${\bar d_p}$
= 100
 $\unicode{x03BC}$
m.

To elucidate the streamwise heat transfer characteristics of aerosol coolants in the internal cooling channels, regionally averaged Nu ratios measured for the aerosol coolants are compared with those for airflow at identical Re in Fig. 8, where the normalised streamwise position for each region is defined as the ratio of its centre distance from the inlet to the channel hydraulic diameter (x/D
h). For all the test cases, the regionally averaged Nu ratios exhibit a streamwise trend of an initial rise, followed by a gradual decline. In the inlet region (x/D
h
 $\lt$
5), they increase rapidly and peak around x/D
h = 5 (i.e. Part 2). As the flow fully develops, the thickening thermal boundary layer and weakened secondary flows cause the ratios to decrease progressively downstream. Comparison between aerosol and air cases reveals that the presence of the particles does not alter the streamwise distribution pattern of the Nu ratios, but significantly modulates local heat transfer, particularly within x/D
h = 5–12 (Parts 2–4).
Figure 8(a) presents the effect of the 0.65
 $\unicode{x03BC}$
m small-particle aerosols on heat transfer characteristics at different Re. At Re = 15,000, the addition of the particle significantly enhances heat transfer in the region around x/D
h = 9 (Part 3), while the other regions remain comparable to the air cases. As the Re increases to 35,000, the Nu ratios for the aerosols generally decrease, falling below those of air across most regions except for a slight enhancement still observed at x/D
h = 9. When the Re further rises to 55,000, the 0.65
 $\unicode{x03BC}$
m aerosol exhibits heat transfer deterioration throughout the entire channels. Overall, the small particle enhances local heat transfer at lower Re but impairs overall channel heat transfer at higher Re. Figure 8(e) illustrates the heat transfer characteristics of the 100
 $\unicode{x03BC}$
m large-particle aerosol, which exhibits a distinctly opposite trend to that of the 0.65
 $\unicode{x03BC}$
m aerosol. At Re = 15,000, the large particle causes heat transfer deterioration throughout the entire channels. With increasing Re, their Nu ratios exhibit an upward trend relative to airflows. At Re = 35,000 and 55,000, the large particle enhances heat transfer in the upstream region (x/D
h
 $\lt$
15), while remaining essentially on par with air in the downstream region (x/D
h
 $\gt$
15).
4.2 Friction coefficients and integrated heat transfer PEC
This section focuses on the 0.65
 $\unicode{x03BC}$
m-particle aerosol to assess a relationship between heat transfer enhancement and the resulting pressure drop penalty. The overall thermal performance within the internal cooling channels is evaluated using the PEC.
Figure 9 depicts the temporal evolution of the inlet and outlet static pressures, along with the corresponding pressure drop across the channels at Re = 15,000. Upon the initiation of particle injection (at 50 s), both the inlet and outlet static pressures undergo a step increase, resulting in a commensurate rise in the pressure drop. Throughout the injection period of approximately 300 s, the operating pressures remain stable at levels elevated above those of the air cases. Following the cessation of particle supply, the inlet and outlet pressures, together with the pressure drop, rapidly revert to their baseline pre-injection states. The results demonstrate that the introduction of particles increases the flow resistance within the channels, thereby exerting an adverse effect on the cooling performance.
Pressure variations of the 0.65
 $\unicode{x03BC}$
m aerosol coolant at Re = 15,000.

Friction factor ratios and PEC of the 0.65
 $\unicode{x03BC}$
m aerosol coolant at different Re.

Figure 10 further plots the friction factor ratios (f/f
0) to assess the concomitant changes in flow resistance with increasing Re. Also included are the PEC values evaluating the combined effects of flow resistance and heat transfer changes induced by the particles. The friction factor ratios of the aerosol coolants exhibit a continuous upward trend as the Re increase, reflecting a relative intensification of flow resistance within the channels. The combined effect of lowered heat transfer enhancement and increased flow resistance results in a monotonic decline of the PEC. As the Re rise from 15,000 to 55,000, the PEC value decreases from 1.49 to 1.07, a trend expected to continue with further increases in Re. Once the PEC falls below unity, the pressure loss penalty caused by the ingestion of 0.65
 $\unicode{x03BC}$
m particles into the ribbed channels outweighs the heat transfer gain.
Comparisons of experimental and numerical results for the heat transfer coefficients: (a) Re = 15,000, (b) Re = 35,000, and (c) Re = 55,000.

Figure 11. Long description
Panel A: A line graph compares experimental and numerical results for heat transfer coefficients at a Reynolds number of 15,000. The x-axis is labeled x/Dh and ranges from 0 to 27. The y-axis is labeled h/Wm*K^-1 and ranges from 200 to 280. The graph includes two data series: one for experimental results marked with orange triangles and another for numerical results marked with purple triangles. The experimental data shows a peak around x/Dh of 9, while the numerical data follows a similar trend but with slight deviations. An annotation indicates a 5.67 percent difference. Panel B: A line graph compares experimental and numerical results for heat transfer coefficients at a Reynolds number of 35,000. The x-axis is labeled x/Dh and ranges from 0 to 27. The y-axis is labeled h/Wm*K^-1 and ranges from 330 to 442. The graph includes two data series: one for experimental results marked with blue triangles and another for numerical results marked with red triangles. The experimental data shows a peak around x/Dh of 6, while the numerical data follows a similar trend but with slight deviations. An annotation indicates a 2.90 percent difference. Panel C: A line graph compares experimental and numerical results for heat transfer coefficients at a Reynolds number of 55,000. The x-axis is labeled x/Dh and ranges from 0 to 27. The y-axis is labeled h/Wm*K^-1 and ranges from 426 to 578. The graph includes two data series: one for experimental results marked with green triangles and another for numerical results marked with pink triangles. The experimental data shows a peak around x/Dh of 6, while the numerical data follows a similar trend but with slight deviations. An annotation indicates a 3.53 percent difference.
4.3 Numerical results
In the experiments, discrete temperatures were measured using thermocouples (the average temperature of two thermocouples was used to characterise the surface temperatures in that region), which made it impossible to obtain the full distribution of heat transfer coefficients on the ribbed wall. To acquire further wall heat transfer information, numerically predicted results are presented in this section to complement the experimental study, enabling an analysis of the wall heat transfer coefficient distributions of aerosol coolants across a range of Re and particle sizes. By coupling these distributions with near-wall streamline patterns, the underlying physics governing the spatial heat transfer characteristics are elucidated.
The numerical methodology employed in this study was validated against experimental data for the 0.65
 $\unicode{x03BC}$
m aerosol coolant. Figure 11 provides the streamwise distributions of the convective heat transfer coefficient (h) obtained from numerical simulations and experimental measurements at different Re. Based on the uncertainty analysis detailed in Section 2.3, a relative experimental uncertainty of h is ±2.95%, which is indicated as error bands in the figures. The maximum deviations are 5.67% at Re = 15,000 (occurring in Part 1), 2.90% at Re = 35,000 (in Part 1), and 3.53% at Re = 55,000 (in Part 2). The comparison demonstrates generally good agreement between the numerical predictions and experimental data, validating the present numerical approach’s capability of capturing the heat transfer characteristics of gas-solid aerosol coolants in subsequent numerical analyses.
Figures 12 and 13 display the effects of particle sizes and Re on the wall heat transfer coefficient distribution, respectively. Figure 12 compares the heat transfer coefficient distributions over the entire ribbed wall for air and aerosol coolants with particle sizes of 0.65 and 100
 $\unicode{x03BC}$
m at Re = 15,000. Compared with the air case, the 0.65
 $\unicode{x03BC}$
m-particle aerosol exhibits heat transfer enhancement throughout the channels, whereas the 100
 $\unicode{x03BC}$
m-particle aerosol shows heat transfer deterioration. This discrepancy stems primarily from two mechanisms: the larger specific surface area of the small particles enables more efficient heat exchange, enhancing near-wall convective heat transfer; and the stark contrast in Stk (0.01 vs. 352.60) governs the distinct particle motions, which is analysed later with flow field distributions.
Heat transfer coefficients for air and aerosol coolants with different particle sizes at Re = 15,000.

Heat transfer coefficients of the 0.65
 $\unicode{x03BC}$
m aerosol coolant at different Re.

Figure 13 further presents contour plots of the wall heat transfer coefficient distributions for the 0.65
 $\unicode{x03BC}$
m aerosol coolant, for higher Re. With elevated Re, the coefficients generally increase, while the spatial distribution pattern remains similar. The areas of high heat transfer are consistently concentrated near the rib tips and their immediately downstream vicinity. Along the flow direction, the heat transfer coefficients in the eight regions gradually decrease, indicating a stronger heat transfer capability of the aerosol coolants in the upstream regions than in the downstream regions. In the spanwise direction, influenced by the geometric symmetry of the 45° V-shaped ribs, the wall heat transfer coefficients exhibit a distinct centrosymmetric distribution.
Heat transfer coefficients and streamline patterns of the 0.65
 $\unicode{x03BC}$
m aerosol coolant at different Re.

Heat transfer coefficients and streamline patterns of the 100
 $\unicode{x03BC}$
m aerosol coolant at Re = 15,000.

Figure 15. Long description
A heat map showing heat transfer coefficients and streamline patterns of aerosol coolant at a Reynolds number of 15,000. The heat map is divided into eight parts, each representing different regions of the coolant flow. The color scale ranges from 100 to 600 W/m^2*K, with darker colors indicating lower values and lighter colors indicating higher values. Each part shows distinct patterns of heat transfer coefficients and streamline directions. Part 1 shows higher heat transfer coefficients in the central region, while Part 2 has a similar pattern but with slightly lower values. Part 3 and Part 4 exhibit more uniform heat transfer coefficients with some variations in the streamline patterns. Part 5 and Part 6 show lower heat transfer coefficients overall, with distinct streamline patterns. Part 7 and Part 8 have the lowest heat transfer coefficients, with streamlines indicating different flow behaviors.
To explore the mechanisms underlying the wall heat transfer coefficient distributions, streamlines are superimposed on the heat transfer contour plots of Figs. 12 and 13. The relation between the near-wall streamline distributions and the heat transfer patterns for different Re and particle sizes are analysed, as given in Figs. 14 and 15. Figure 14 displays flow streamlines for the 0.65
 $\unicode{x03BC}$
m aerosol coolant across Parts 1 to 8 at Re = 15,000 and Re = 35,000, where the heat transfer distributions are superimposed for comparisons. The regions of high heat transfer are closely linked to the underlying flow structures. The mainstream flow impinges on the tips and windward sloped surfaces of the V-shaped ribs, forming local stagnation zones that yield elevated heat transfer. The impingement bifurcates the flow along both sides of the rib (as indicated by the red arrows) and generates a primary horseshoe vortex spanning the rib width; the legs of this vortex extend downstream along the rib sides. Simultaneously, smaller and weaker corner vortices form at the rib-sidewall junctions. These vortices constitute relatively enclosed, low-velocity recirculation zones (indicated by black circles), which contribute marginally to local heat transfer enhancement. Furthermore, between adjacent ribs, the fluid forms intense vortex pairs under the pressure gradient, creating a reattachment region characterised by high heat transfer (highlighted by red circles in the figures, corresponding to the delta winglet regions). Owing to the identical geometry of each region, the fluid flow trajectories are essentially similar. With Stk smaller than unity (Stk = 0.01 and 0.03), the 0.65
 $\unicode{x03BC}$
m particles closely follow the fluid motions, exerting minimal disturbance on the main flows and failing to disrupt the near-wall thermal boundary layer effectively. These factors collectively yield a consistent distribution of heat transfer coefficients across all regions. While increasing the Re enhances the overall magnitude of the heat transfer coefficients, the flow structure remains unchanged, causing slight influences on the distribution pattern of the heat transfer coefficients.
Figure 15 illustrates the convective heat transfer and near-wall flow streamline distributions across eight regions for the 100
 $\unicode{x03BC}$
m aerosol at Re = 15,000. In contrast to the results for the 0.65
 $\unicode{x03BC}$
m aerosol depicted in Fig. 14, the difference in particle sizes substantially modifies the near-wall flow states, with direct consequences for heat transfer performance. The 100
 $\unicode{x03BC}$
m particles, characterised by a high Stk (Stk = 352.60), are inertia-driven and fail to follow the curved streamlines. Functioning as ‘momentum dampers’, these high-inertia particles dissipate kinetic energy from small-scale turbulent eddies during acceleration or deceleration, intensifying viscous dissipation of turbulent fluctuations and thereby suppressing the intensity and development of the ‘background’ turbulence. More critically, the inertial motion of large particles disrupts or breaks down the rib-induced vortex structures, which are otherwise central to heat transfer enhancement. Spatially, the influence of the large particles is the most pronounced in the inlet-proximal Part 1, where the flow field undergoes the most substantial modifications, with downstream regions less affected. Within each region, the primary impact is concentrated in the area upstream of the first rib. These differences in flow behaviour not only account for the significantly lower overall cooling effectiveness of the 100
 $\unicode{x03BC}$
m aerosol coolant compared to the 0.65
 $\unicode{x03BC}$
m aerosol coolant at Re = 15,000, but also clarify the underlying mechanisms governing the specific distribution of heat transfer coefficients on different wall regions.
5.0 Conclusions
This study employed an integrated experimental and numerical approach to systematically investigate the heat transfer and flow resistance characteristics of an aerosol coolant in a straight rectangular channel with periodic 45° V-shaped ribs. The effects of five particle sizes (0.65, 2, 16, 30 and 100
 $\unicode{x03BC}$
m) were examined over a Re range of 15,000 to 55,000. Key performance metrics, including heat transfer coefficient (h), Nu ratio (Nu/Nu
0), friction factor ratio (f/f
0), PEC and the distribution of rib-induced flow structures, were presented. The main findings are summarised as follows.
-
1. The effect of particle sizes on heat transfer performance varies significantly with mainstream flow conditions. Under low Re conditions (Re = 15,000), superior heat transfer was observed for small particles, achieving a maximum overall-averaged Nu ratio of approximately 2.85 for the 0.65
$\unicode{x03BC}$
m aerosol. In contrast, at Re = 55,000, the advantage in heat transfer was gained by larger particles, with the 100
$\unicode{x03BC}$
m aerosol exhibiting enhanced heat transfer capability and a maximum overall-averaged Nu ratio of about 2.16. -
2. Along the flow direction, the regionally averaged Nu ratios for the aerosol coolants and air exhibited a similar trend: increasing to a peak and then gradually declining downstream. Although the addition of particles did not alter the underlying trend, it significantly modulated local heat transfer performance, with the effect concentrated within the foremost parts of the channel.
-
3. Introducing particles increased the pressure drop across the channels, thereby impairing cooling performance. As the Re increased from 15,000 to 55,000, the overall-averaged Nu ratios for the 0.65
$\unicode{x03BC}$
m aerosol progressively decreased, while the friction factor ratios steadily rose. The combined effect of lowered heat transfer and increased flow resistance led to a monotonic decline in the overall thermal performance. -
4. At Re = 15,000, the Stk for the 0.65 and 100
$\unicode{x03BC}$
m particles differed significantly (0.01 and 352.60, respectively), leading to markedly different transport characteristics. The small particles exhibited excellent flow-following capability, largely preserving the flow field structure within the channels. In contrast, due to their high inertia, the 100
$\unicode{x03BC}$
m particles not only dissipated turbulent fluctuations but also disrupted and broke down the rib-induced vortex structures that are beneficial for heat transfer. A comparison of the wall heat transfer coefficient distributions revealed that the 100
$\unicode{x03BC}$
m aerosol yielded lower values across all regions than the 0.65
$\unicode{x03BC}$
m aerosol.


Acknowledgements
The experimental and computational data presented in the current paper were obtained through the support of the National Natural Science Foundation of China under Grant No. 52276035.
Competing interests
The authors declare none.









 d¯p
 μ
 d¯p
 μ
 d¯p
 μ
 d¯p
 μ
 d¯p
 μ

 μ

 μ


 μ

 μ

 μ


