

INTRODUCTION
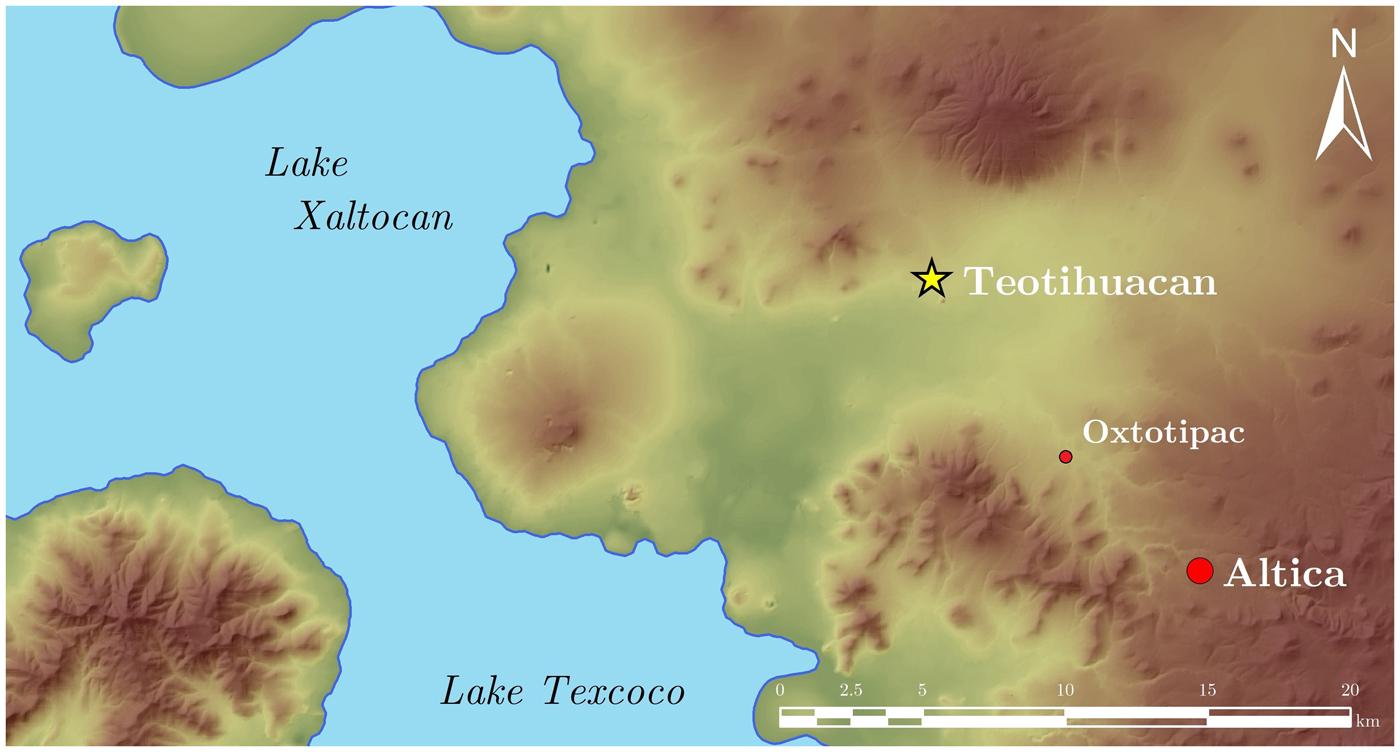
The Formative-period site of Altica (Figure 1) presents a wide array of challenges when designing and executing an archaeological excavation. Like most other Formative-period sites, Altica had little formal architecture making it difficult to place targeted excavations using data from most traditional survey techniques. Thousands of years of sheet erosion have eroded most soils and pre-Hispanic contexts above the local bedrock (tepetate, a type of compacted volcanic tuff). Complicating the matter further, to plant their crops modern farmers must break apart the tepetate as deeply as 30 cm using large tractors and plows—a process known as chisel plowing. This has the effect of producing arable soils but exacerbates sheet erosion (Quantin et al. Reference Quantin, Prat, Zebrowski, Harper and Brown1998) and destroys any remaining archaeological vestiges that may be above the level of the volcanic tuff.
Location of Altica in the Basin of Mexico, relative to Early Classic period Teotihuacan, and the modern settlement of Oxtotipac (Figure 2). Topographic data courtesy of INEGI Reference Instituto Nacional de Estadística y Geografía (INEGI)2012.

Geophysical prospection permits a targeted excavation approach, significantly reducing time and effort while increasing project efficiency. This is especially important at sites such as Altica that present difficult working conditions. Given the site's taphonomic history, any field strategy has to be focused on the identification and excavation of subsurface pits characteristic of Formative-period sites in the Mexican highlands (Darras and Faugère Reference Darras and Faugère2010; Plunket and Uruñuela Reference Plunket and Uruñuela2012), as surface-level contexts have been mostly destroyed.
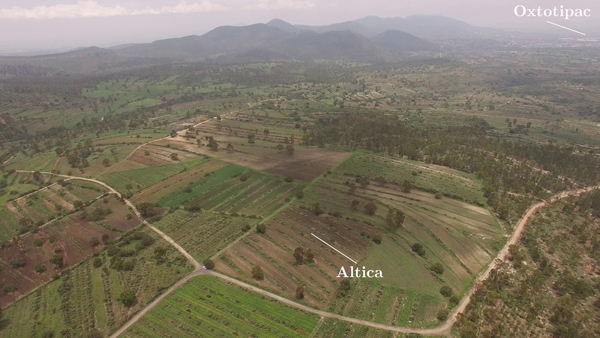
Terracing efforts (Figure 2) have resulted in poor drainage conditions, complicating geophysical survey. A short rainfall can turn terraces into pools of mud or standing water for weeks on end, significantly hindering excavation and prospection efforts. Ordinarily, the most adequate forms of geophysical prospection would be either electric resistance or ground penetrating radar survey, exploiting any differential moisture content and material composition of pit features. In this case, electric resistance fails because soil resistance approaches zero at virtually all locations due to the high conductivity of water-saturated soils. Ground penetrating radar fails because the air-water surface interface reflects the bulk of the emitted radio pulse that allows the radar to detect buried constructions. In either case, the result is that these forms of prospection cannot resolve subsurface features under saturated conditions such as the ones present during the rainy season at Altica.
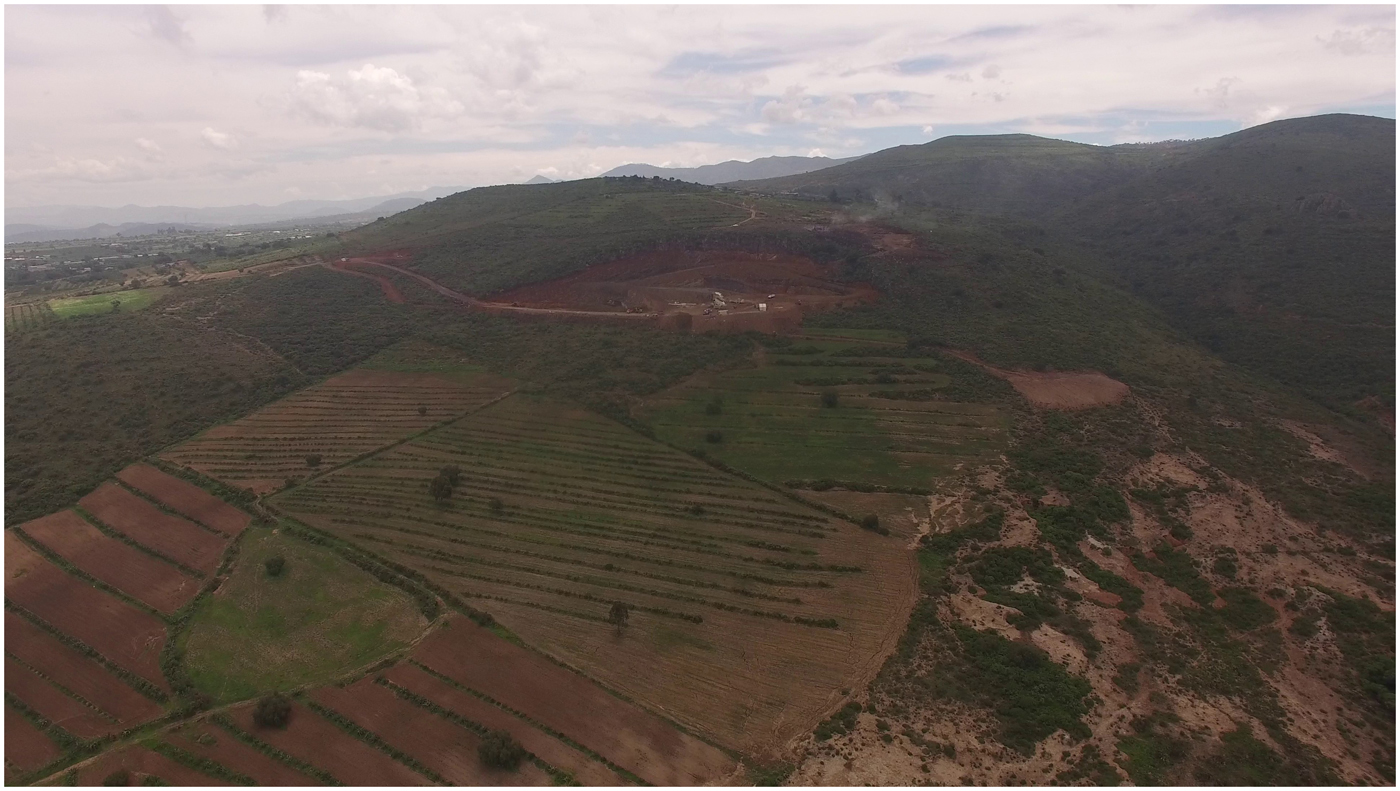
Aerial image of Altica and its surrounding environment, looking southwest towards the Patlachique Range on a hazy midsummer day. Photograph by Mejía Ramón.

While under ideal environmental conditions magnetic gradiometry might not be the first tool archaeologists would use to identify buried bedrock-incised pits, the geophysical phenomena at play are not impacted by the hypersaturated conditions that make other forms of geophysical prospection impractical at Altica. Initial placement of excavation units relied on maps of surface density scatter, but only a handful (15 percent) of excavation units placed before the production of the magnetic maps produced results with intact Formative-period contexts. Based on the success rate of features being found in placed units, the magnetic gradiometer increased the project efficiency rate by a factor of 3.5. Nevertheless, we remained constrained by landowner permission to excavate. This paper describes our use of magnetic gradient, explaining the geophysical anomalies using data from excavation and aerial multispectral remote sensing. We also discuss the applicability of these methods to other small sites with limited architectural remains in heavily eroded environments.
MAGNETIC GRADIENT SURVEY
Magnetic gradient survey has been one of the most common geophysical prospection techniques employed in the central Mexican highlands mainly due to the region's geology. Here, most rocks are volcanic in origin and are therefore magnetized. Since stones were a common building material in pre-Hispanic central Mexico, magnetic gradient can be used to map buried structures by identifying places with high concentrations of magnetic dipoles. Certain types of extrusive volcanic rocks, such as andesites and basalts, are much more strongly magnetized than others and produce higher magnitude values than other materials such as silt and tepetate (volcanic tuff usually produced after consolidation of hot mud flows). Under typical conditions in central Mexico, a majority of detected magnetic features are due to magnetized stones used for wall foundations (Hesse et al. Reference Hesse, Barba, Link and Ortiz1997).
Magnets and other magnetized materials such as those used (and removed) in the construction of Altica produce a local magnetic field. A magnetic field describes the strength and direction of the magnetic force at any point. The magnetic field is strongest near the poles of the material, and rapidly decays as distance increases. The magnetic gradient describes the rate of this decay and can be used to detect the location of magnetized materials—the faster the magnetic field intensity changes, the closer the source of the field must be.
Altica's long history of erosion and chisel plowing have long destroyed a large proportion of pre-Hispanic contexts at the site. The taphonomic effects are compounded because Formative sites are the most difficult kind of archaeological sites to survey in central Mexico given that formal surviving architectural remains were built. The very low impact of the insubstantial (i.e., thatch and earthen) constructions are rather difficult to detect by geophysical techniques. Thus, barring large, isolated rocks visible on the surface, high magnetic values must be due to other phenomena.
The background magnetization of the subsoil is typically not visible in magnetic gradiometry survey imagery since it underlies every location on the site. Thus its effect is canceled when calibrating the instrument before use. Cavities, however, produce a magnetic field that is opposite to the magnetic field produced by the subsoil. In other words, while the subsoil may be uniformly magnetized and therefore will not be detected by the gradiometer, an unmagnetized empty cavity may be detected as an anomaly, although it would be difficult to perceive under conditions of low contrast between magnetic properties. Anomalies could also be caused by a cavity refilled with top soil with higher magnetic susceptibility, or if a material was heated to a temperature above its Curie point (usually by fire; thermoremanent magnetization), or exposed to an extremely strong current (induced magnetization) such as lightning.
SURVEY
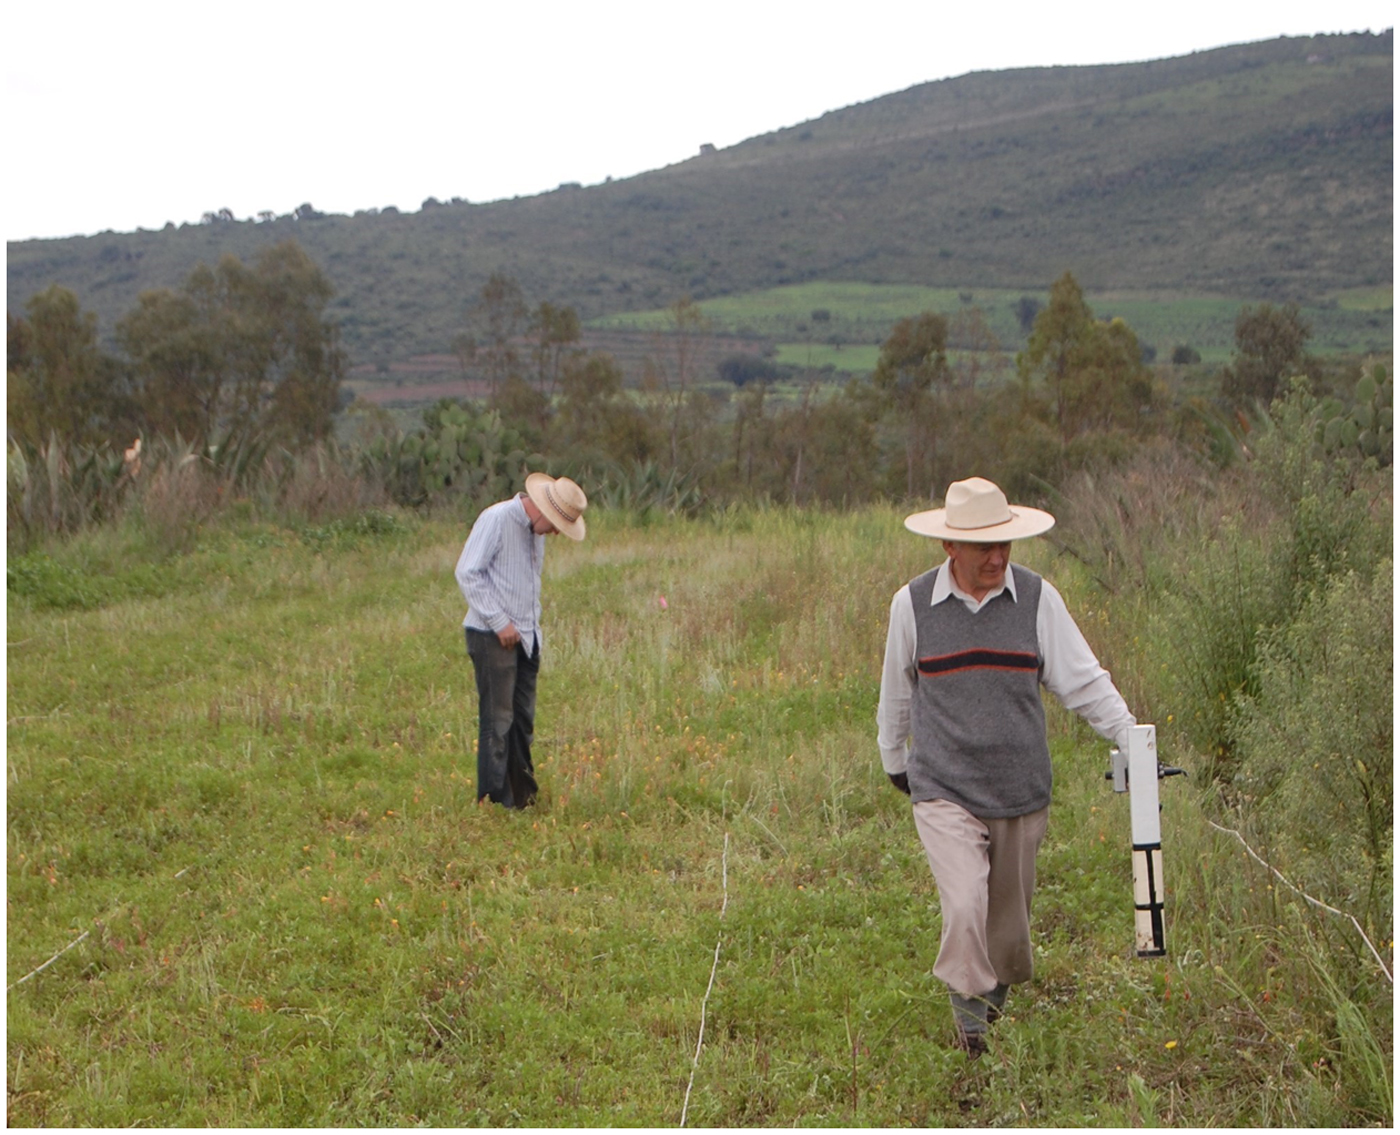
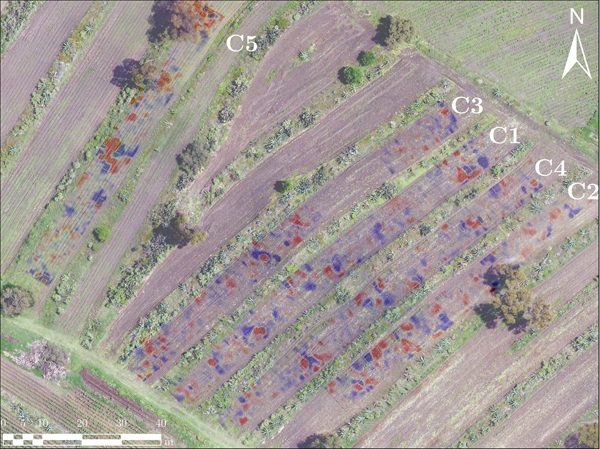
To conduct the magnetic gradient survey, we placed 10-m-wide grids atop five of the least-flooded terraces with high concentrations of surface remains within the site encountered during ground survey (Stoner and Nichols Reference Stoner and Nichols2019). The length of the grids varied depending on the size of the terrace and the amount of walkable surface. Transect lines were placed 2 m apart, and were conducted in 20-m modules. We used a Geoscan FM36 gradiometer, accumulating data at a rate of four readings per meter with 1-m line intervals (Figure 3). In total, we acquired 18,000 readings covering an area of 4,500 m2 in five days. The gradiometer data were processed using a Geoplot software. Data processing included despike, destagger, low-pass filter, and zero-mean grid and were then interpolated and represented by pseudo-color maps using Surfer 2010 (Figure 4).
Magnetic gradient prospection with a Geoscan FM36 at Altica. Photograph by Wesley Stoner.

Maps of the magnetic gradient survey of Altica. Map by the authors.

The resulting maps were then visually interpreted to identify possible patterns and strong variations in the expected magnetic field that may indicate buried Formative-period tepetate-incised pits. We attempted to excavate 21 of the possible features suggested by the magnetic gradient imagery. Unfortunately, we were able to excavate only 16, as the stakes that we left to precisely indicate the locations of the features disappeared early in the season. Excavations at a further two anomalies were initiated, but flooding prevented us from reaching tepetate level.
MULTISPECTRAL REMOTE SENSING
To characterize the distribution of the different types of surface sediments across Altica, we utilized high-resolution multispectral imagery before and after excavation. Multispectral imagery differs from traditional RGB (red/green/blue) imagery in that it is finely calibrated to known, specific wavelengths of light. The amount of light an object reflects at different wavelengths is a property of its physical and chemical composition, and can therefore be used to characterize land cover.
Multispectral imagery was acquired on December 20, 2017 using a Parrot Sequoia multispectral camera equipped on a Zeta FX-61 unmanned aerial vehicle flying at a 120 m, taking one picture every two seconds. The camera is sensitive to four well-defined spectral bands (green, 550 nm; red, 660 nm; red edge, 735 nm; and infrared, 790 nm). Orthomosaics were produced with Agisoft Photoscan Professional and achieved a ground resolution of 10.6 cm. Color imagery was acquired on July 20, 2017 using a Phantom 3 Professional and was processed in a similar manner. The color images, however, were used only as base maps for making the figures included in this paper and not the presented quantitative analyses.
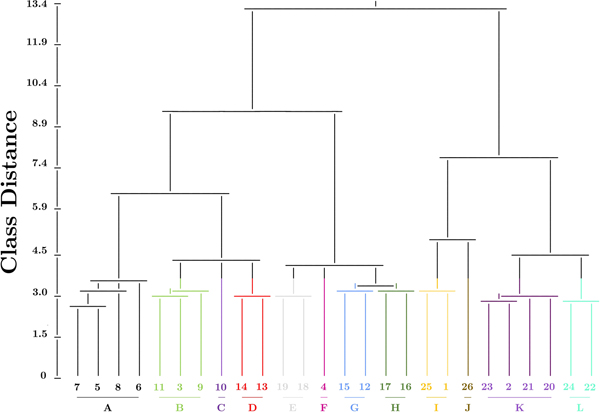
The multispectral imagery was processed using ArcPy 10.5.2 using hierarchical unsupervised iso-cluster classification, first manually separating classes into “vegetation” and “not vegetation,” then algorithmically separating “not vegetation” into 26 subclasses based on differences in the reflectance of light at the four wavelengths. The resulting classes were then reduced to 12, combining all classes that were within 3.5 class-distance units from each other according to the spectral relationship dendrogram. To investigate the spatial structure of soil composition, the fractional abundance of each class was calculated within a 5-m radius of each pixel, allowing us to observe differences in clustering patterns and homogeneity between the individual classes. The Global Moran's I autocorrelation statistic was calculated on the resulting abundance rasters at three different radii (r = five, 10, and 15 m) to obtain a quantitative metric of the relative degrees of clusteredness within individual classes. Autocorrelation values are artificially inflated because the abundance calculations transform a categorical data product with hard breaks into a series of smoothed real-number quantitative products. Nevertheless, relative trends between the classes should hold under identical processing schemes and for reasonable spatial weight distances.
RESULTS
Magnetometry
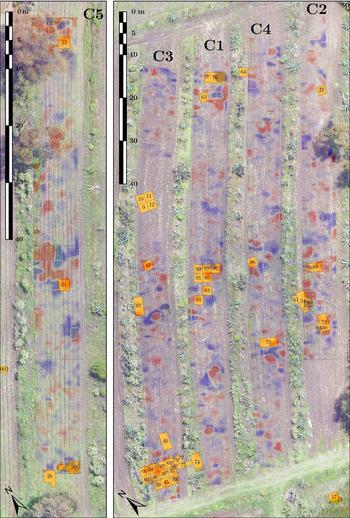
The magnetic gradient maps by terrace are shown in Figure 5, with excavated units shown in orange. In this section, we report the concordance between the interpretation of the magnetic gradient maps and the results observed from excavation, starting at the north end of each terrace and working our way south. Units lacking excavated features are not discussed but are shown in the figures and included in all calculations.
Magnetic gradient survey of Altica, and correspondence with excavated units in square boxes. Image by the authors.

The amount of noise and the distribution of high-amplitude anomalies is relatively similar across the five studied terraces, with a particularly strong, wide linear alignment running east-west approximately through the middle of each studied area. The area with the highest number of medium-to-strong intensity anomalies is to the southwest of the survey area, where excavations encountered a high concentration of features. This location likely corresponds to the center of the site according to surface scatter.
Terrace C1
Arguably the most interesting initial finding was an apparent monopole located towards the far northern end of the terrace. Upon excavation, Unit 76 encountered a particularly unusual amorphous cut that burrowed under the tepetate (Feature 26, 20–45 cm deep, approximately two meters long outside the tepetate, more than one meter long under the tepetate)—the only feature encountered at the site cutting the tepetate at an oblique angle. All other features were cut perpendicular to the surface. The feature likely is magnetized at a different angle to the other Formative pits, resulting in a dipole oriented such that the positive pole is obscured. Despite this curious find, the feature was unlikely cultural and is probably erosional in nature.
Near the center of the terrace was a dipole in the shape of a yin-yang symbol, where Units 85, 89, 90, 91, and 92 revealed a very intricate system of carvings in the tepetate (Features 32–34). Relatively shallow when compared to other features at Altica (25 cm at its deepest), this complex of features consisted of a carefully crafted system of small shallow basins, channels, rock formations, and flow controls like a small-scale model of experiments in water management and distribution, with a fill dense in ceramics. Its broad spatial extent conforms to the large apparent size of the dipole in the magnetic gradiometry imagery. Lastly, an apparent cut in the tepetate was present in the southernmost unit of the terrace beneath Unit 74, but this was not visible on the magnetic gradient maps. This feature proved not to be anthropogenic given the few cultural remains, and is likely erosional in nature.
Terrace C2
The northernmost unit was opened to investigate a series of dipoles that appeared to be radiating out from a common center located near a felled tree. Although only one of the weaker dipoles was investigated, the excavation of Unit 21 revealed a partly carbonized root belonging to the felled tree. Local informants told us that the tree had recently been struck by lightning. Such an event would have caused a very large current to flow through the tree. The current—seeking the path of least resistance—would likely have flowed through the roots, partly carbonizing them. The extremely strong current produced a strong magnetic field, permanently magnetizing the surrounding soil and tepetate. This explains the three other long dipoles radiating from a common center in the area. Despite this curiosity, no cultural features were found here.
Unit 88 was placed to investigate a large positive pole towards the southern end of the terrace located directly between the bancales (mounded lips of the terraces). Feature 35 was discovered along the western edge of the unit and consisted of a 40-cm-deep, 120-cm diameter pit with a burial. The feature does not explain the magnetic anomaly we originally intended to study, but it can be associated with an adjacent one located directly west of the original 2 × 3-m unit.
To the south, Units 24, 41, and 43 were excavated on the northern of two very large, strong, adjacent dipoles. These excavations revealed a series of relatively shallow circular pits (Features 10–13; from 5–30 cm deep, 35–60 cm in diameter) cut into the tepetate, similar in nature but smaller in scale than the feature complex on the southern end of Terrace 3. These pits had a fill with a very high ceramic density.
The southernmost two units—72 and 80—were excavated atop a complex series of poles at the southern end of the terrace. These anomalies were caused by two features dug into the tepetate—one of them square and one of them circular. The square Feature 23 was quite large (3.5–4 meters per side, 50 cm deep), and contained a poorly preserved elite burial. Feature 24 was a circular feature in plan view, but unfortunately, was left unexcavated due to time constraints.
Terrace C3
Due to flooding conditions and the presence of incomplete excavations at the time (Units 9–12), we were forced to divide Terrace C3 into two discontinuous sections. Nevertheless, due to the continued muddy conditions we were never able to investigate any anomalies in the northern section.
Although initially there were no plans to investigate the anomaly under Unit 87, flooding and swampy conditions throughout the site made it the strongest unexplored accessible dipole at the moment of excavation. Its presence near a large, highly magnetic basaltic rock (the bright dipole indicated by the black arrow) made anomalies within this area suspect. Unsurprisingly, no features were found at the level of the tepetate.
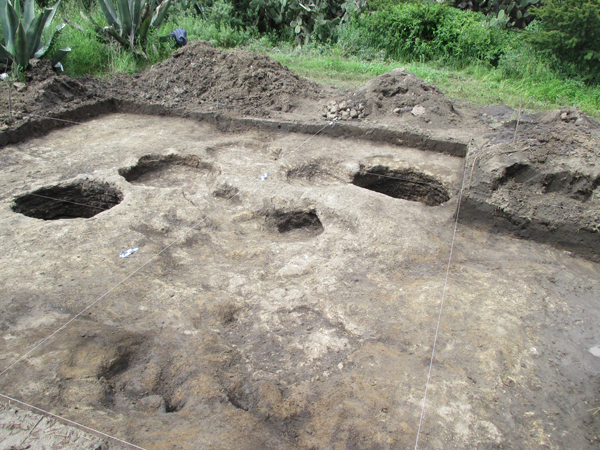
The southern complex of units was placed to investigate a large concentration of complex magnetic anomalies at the southern end of the terrace. The eastern half of this unit revealed a hearth, resulting in thermoremanent magnetization detected at this location (Feature 6). Adjacent features proved to be seven cylindrical pits of depths ranging from 10–100 cm in depth and 70–120 cm in diameter (Figure 6), the largest and deepest of which contained a very well-preserved burial (Burial 2; Storey et al. Reference Storey, Buckley and Kennett2019).
Complex of pit features found at the southern end of Terrace C3, with the hearth visible in the foreground. Photograph courtesy of Proyecto Altica.

Terrace C4
Three different units were opened within Terrace 4 with the intent to verify some of the magnetic anomalies visible on the magnetic gradient map. Of these units, none revealed any modification of the tepetate. Furthermore, no metal or basaltic rock was found that could also explain these anomalies.
Terrace C5
Of the three units opened within the bounds of the magnetic gradient survey in Terrace C5, only the southern two—30 and 31—contained any alteration of the tepetate. Unit 31 contained anthropogenic cut of an undetermined antiquity with burned rocks, sherds, and tepetate (Feature 5).
Multispectral Remote Sensing
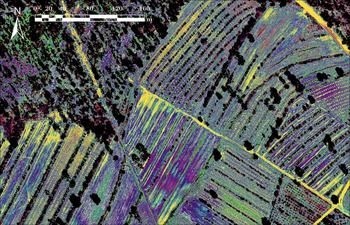
The resulting classified multispectral image is shown in Figure 7, with arbitrary colors assigned to each highest probability class. These 12 classes were generated based on the spectral relations dendrogram presented in Figure 8. A majority of the excavated cultural (i.e., neither tree root nor horizontal hollow) features are located in the southwest quadrant of the area surveyed with magnetic gradient, an area that upon visual inspection contains a locally disproportionately high concentration of Class F (magenta). Although the sampling strategy is suboptimal, the units placed within this heavily eroded section suggest that soils are deeper here than more towards the north, where lighter-colored soils are visible in the color orthoimage.
Classified multispectral image, showing the 12 highest-probability classes. Black patches indicate trees, shadows, and vegetation filtered out before the statistics were calculated. Image by the authors.

Classification dendrogram, showing the spectral relationship between the originally calculated 26 spectral classes and the condensed 12 included in this analysis. Image by the authors.

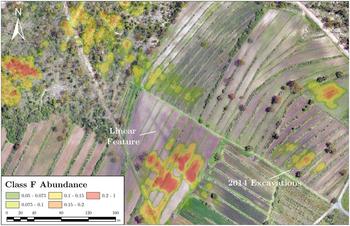
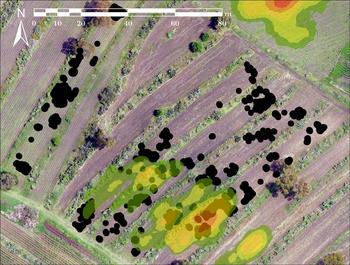
Save for two, the distribution of abundance patterns for each class followed one of three patterns—a roughly homogenous distribution of across the landscape; intermediate heterogeneity associated with exposed tepetate/tepetate-colored soils in fields; or strong heterogeneity defined by partly-forested areas or low-lying in drainages and the ridge on which Altica stands. Of the remaining two classes, Class J was particularly sensitive to exposed tepetate, specifically atop roads and pathways. Class F was heterogeneously distributed through the landscape, with clear patches of high abundance interspersed between areas where the class is completely or almost completely absent. Consistent with visual observations, one of Class F's clusters overlaps the area where excavation revealed a high concentration of tepetate pits (Figure 9). Furthermore, Class F clusters with other known modifications of the tepetate in the study area, such as the linear feature in Figure 10. Unfortunately, we were unable to obtain permission to excavate the linear feature during the 2014 excavations.
Association between the highest-intensity magnetic anomalies in black, and the abundance of Class F within the 2014 excavation area. Image by the authors.

Areas in and around Altica with high concentrations of Class F (greater than five percent) within a 5-m radius. Areas of known subsurface anthropogenic activity are indicated. Image by the authors.

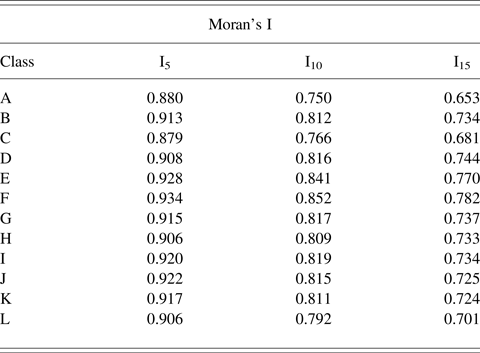
The Moran's I statistics (Table 1) show that Class F is by far the most spatially autocorrelated and therefore most highly clustered class, with this rank stationary across the three analyzed radii. Furthermore, inspection of the spectral relationship dendrogram shows that Class F also one of the most spectrally unique of the 26 originally identified classes, separated from the next-most similar class by 4.18 spectral-distance units. The two more spectrally unique classes are more easily explained, with Class C associated with forested areas and fallen wooden material, and Class J being restricted to roads with exposed tepetate. Only Class J approaches Class F's degree of clusteredness according to the Moran's I statistic, but this is explained by how Class J is limited to roads.
Moran's I statistic for the global spatial autocorrelation of class abundances with spatial distance weights calculated at three radii (five, 10, and 15 m).

According to the RGB and false-color multispectral orthoimagery, Class F is a soil slightly darker than average in the area immediately atop the excavated portion of Altica, and a light tepetate-colored soil elsewhere. Its spectral separability is difficult to explain from simple visual analysis. While logically, the next-most similar classes according to the dendrogram (E, G, and H) are of a similar color in the RGB and false-color multispectral orthomosaics, their distribution in the landscape is either much more homogenous as evidenced by lower Moran's I values, or limited to modern roads and exposed tepetate.
DISCUSSION
Magnetic gradient survey was very successful at Altica as the most effective, feasible way of finding Formative-period pits dug into the indurated volcanic tuff bedrock. Only three Formative-period pits were identified without the aid of the gradiometer even though 20 units had been placed prior (15 percent success). The gradiometer, meanwhile had a 53 percent success rate in identifying pits dug into the tepetate, even if not all of them can clearly be dated to the Formative. False positives were typically due to surface concentrations of volcanic stones and may also be due to periodic burning such as that witnessed in several units through the presence of carbon in the plow zone.
Despite the extremely high resolution of the Parrot Sequoia Winter 2017 imagery (10.6 cm), it was not possible to resolve any features that may be bedrock-incised pits in the multispectral imagery. Nevertheless, the utility of the multispectral imagery is that it provides an additional line of evidence in prioritizing which magnetic anomalies to investigate first. Since most of the high-magnitude magnetic anomalies are in the center of the terraces, they can be ascribed to changes in the components of the surface soil matrix. The unexplored anomalies in the southernmost expanses of Terraces C1 and C2 have yet to be explained in geophysical terms and are therefore the most likely candidates for any future potential survey and excavations. Along with the complex in the south of C3 (and the explored section of C2), both areas are clusters of large numbers of highly localized magnetic anomalies that cannot be explained by a macroscale stratigraphic transition above the tepetate bedrock.
There are several possible explanations for the colors of the soils and the spatial distribution of spectral classes from the aerial imagery. First, historic chisel plowing clearly left its mark in the landscape. Many of the lighter-colored soils are indicative of this pulverized tepetate churned up into the soil matrix. For example, in the double linear feature visible in Figures 2 and 10, soils are darker atop the possible cut because there was no tepetate present to chisel. The darker areas likely represent deeper areas or areas with recent soil formation. This does not explain, however, the differences in the spatial distribution between most classes including Class F. While these methods are not capable of determining the physical or chemical cause behind differences in spectral properties without further ground-truthing, previous research at another Formative village in Tlaxcala using very high-resolution multispectral satellite imagery suggests that human activity leaves a measurable, but yet unexplained and difficult-to-qualify effect on localized reflectance patterns (Blancas et al. Reference Blancas, Barba, Ortiz and Carballo2015).
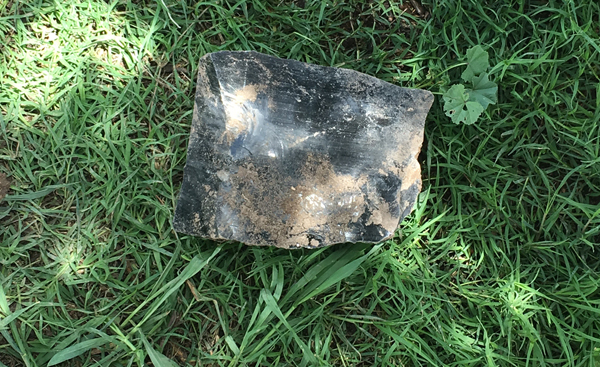
Given the very high resolution of the aerial multispectral imagery employed here, subtle changes in soil composition or fairly small objects a few centimeters across can have measurable effects on the average spectral response of each 10.6 × 10.6-cm pixel. Thus, one possible explanation for Class F's spatial structure may be the surface scatter of artifacts associated with the Formative-period site. With a glassy atomic structure and a dark black color that strongly contrasts with the surrounding soil, the particularly high surface obsidian concentrations at Altica might be partly causal to Class F. Obsidian concentrations were high in the excavated zone, while plowing and terrace-building in the Spring of 2017 atop the linear feature churned up many artifacts including the large obsidian nodule visible in Figure 11. With dimensions of 20 × 16 × 10 cm, this nodule would occupy at least one entire pixel. While it is an abnormally large specimen, it shows how surface artifacts exist at a size that must be accounted for at this scale of research. Similarly, the presence of surface ceramics may be associated with Class F, although these may be difficult to distinguish from rocks and hardened or compacted soils (at least in the case of the Sequoia sensor). In more general terms, scattered archaeological material on the surface might be at least partially responsible for changes in the spectral response.
Obsidian nodule found on the surface atop the linear feature in Figure 7 (20 cm wide, 16 cm tall, 10 cm deep) approximately one month after plowing. Photograph by Mejía Ramón.

A second possible explanation of the differential spectral response may be more closely linked to the magnetic properties of the site rather than simple association with human presence. In observing the linear pattern of dipolar anomalies that passes across in four of the terraces (C1 to C4) about the center of the magnetic gradient grids (Figure 4), one can imagine that, many centuries before the present terraces were built, this site was a continuous slope where the Formative settlement was located. In the same figure, we can see that are several linear patterns of magnetic anomalies, suggesting that the ancient inhabitants built their houses and modified the tuff, producing aligned holes, cuts, and trenches long before the construction of the roads and terraces visible today. Excavation revealed that soils in the north of the terraces were shallower than in the south where tepetate pits were identified, and that the tepetate pits were filled in a single depositional event.
Here the contrast in magnetic properties increases because in tuffs the iron particles produces almost non-magnetic homogeneous responses. Meanwhile in soils—especially with those associated with human settlements—magnetic susceptibility increases with fresh iron particles (Fassbinder and Stanjek Reference Fassbinder and Stanjek1993). Thus, as the magnetically replenished anthropogenic soil fills pits and cavities in the tepetate, net magnetization increases. The mineral composition of filled soils determines the maximum possible magnitude of the magnetic dipole, whereas the taphonomic processes leading to infill dampen the signal and determine the direction of the effect. As a result, pits became important in determining the spectral and geophysical properties of the site, given the tuff material removed and mixed with soil, and the impact of the human activity atop them.
Under this scenario, the east-west magnetic alignment may be caused by a change in the depth of the soil, and therefore a change in the amount of magnetized material leading to changes in the local magnetic field increasing the gradient. This would explain the close association between the spectral and magnetic responses in a more proximal manner than surface artifact scatter. Nevertheless, both processes likely contribute in some proportion to the characteristics of Class F, and its close association to magnetic features and anthropogenic processes.
Interestingly, the shape, orientation, and location of some of the anomalies in a magnetic gradient map may not align with the actual cavities unless the magnetization of the clay fill is either non-uniform, or perpendicular to the Earth's surface. This is because the direction of magnetization controls the orientation of the dipole, and is not necessarily perpendicular to the surface of the earth. The greater the z component of the magnetization, the stronger the effect. The existence of the effect at Altica is suggested by the northernmost feature of Terrace C1, appearing on the magnetic gradient map idiosyncratically as the sole monopole in the maps. As a horizontal hollow that goes under the tepetate, this feature is the only one cut in a direction that is not perpendicular to the surface, and probably runs in the direction of its own magnetization. The processes of soil deposition leading to the fill of the hollow may have given it its unique orientation. Thus, the south pole of the cavity is exposed and apparent as a monopole, when in actuality the cavity is oriented such that the other pole is obscured from view.
Despite not being the most obvious choice, a combination of magnetic gradient prospection and multispectral remote sensing has been extremely useful when trying to excavate a highly disturbed, heavily eroded piedmont site with no surface architecture and under difficult field work conditions. The experience and results suggest that this may be a good way of approaching such a site. Magnetic gradient prospection resulted in near-instantaneous results, and increased project efficiency by a factor of 3.5 when considering the rate of pit identification. Future excavations can proceed in an even more targeted manner with the assistance of very high-resolution multispectral imagery, ruling out magnetic anomalies that are not due to bedrock-incised pits and identifying clusters of spectral classes that may be indicative of anthropogenic activity. Electric resistance or ground-penetrating radar during the dry season may also provide additional data to better interpret the magnetic gradient results, although the labor involved in taking and processing the latter's data would negate any reaped efficiency benefits.
The importance of being able to rapidly survey these types of sites cannot be understated due to the rapid urbanization of the Basin of Mexico. Altica survived into the twenty-first century in large part because of its relative remoteness to Mexico City. Piedmont sites such as these are exceedingly rare, and are in great danger of disappearing due to increased erosion and changing land use (Gómez Chávez Reference Gómez Chávez2015; Mejía Ramón and Johnson Reference Mejía Ramón and Johnson2019). While this study has documented the degree of sheet erosion over the last five years on Altica's specific ridge, larger dangers to the integrity of the landscape presently exist. Since 2016, a large number of mines have been opened in and around the Teotihuacan Valley, mining construction material for Mexico City's new airport. As of December 2017, extraction activities include one quarry that has consumed most of the mountainside visible in the background of Figure 1 (see Figure 12, taken five months prior). Because the Teotihuacan Valley historically contained some of the highest population densities in pre-Hispanic Mesoamerica (Sanders et al. Reference Sanders, Parsons and Santley1979), resource extraction of such a scale endangers many archaeological sites. If archaeologists are to study these vulnerable areas before they are forever lost, modern tools such as magnetic gradiometry and multispectral remote sensing will prove pivotal in ensuring that important elements of history can be salvaged.
Aerial image from Altica of the nearby mine in July 2017, approximately four months after its opening. Total areal extent had approximately quintupled in size by December 2017. Photograph by Mejía Ramón.

RESUMEN
El sitio formativo de Altica en la Sierra del Patlachique presenta muchos problemas al diseñar una estrategia de excavaciones. Tres milenios de erosión, y arado intenso al tepetate durante el vigésimo siglo mas esfuerzos de reforestación han destruido mayoría de la arquitectura superficial por encima del nivel local del tepetate. Por lo tanto, en las primeras etapas del Proyecto Altica el enfoque principal fue detectar e identificar elementos por debajo de la superficie, especialmente pozos profundos, como los tronco-cónicos presentes en otros sitios del periodo formativo. Aunque Altica queda encima de una cresta baja y plana, intensas lluvias localizadas frecuentemente inundan las terrazas de interés por muchos días. Dichas condiciones hiper-saturadas no permiten el uso de las formas más comunes y lógicas de prospección geofísica (georadar y resistencia eléctrica). Debido a estas limitaciones prácticas y taponómicos, tuvimos que apoyarnos sobe prospección de gradiente magnético. Esta técnica no se había aplicado previamente a un poblado temprano en la Cuenca de México. Este articulo presenta los métodos que usamos, discute las varias dificultades que se presentaron durante prospección, e interpreta los resultados del estudio del gradiente magnético usando resultados de excavación y teledetección multiespectral aérea. El estudio magnético incrementó la eficiencia de las excavaciones por un factor de tres y medio, permitiendo que las excavaciones procedan de una manera enfocada y metodológica. Las anomalías magnéticas antropogénicas principales se pueden correlar con la presencia de una clase espectral en imágenes multiespectrales aéreas de alta calidad, sugiriendo una relación directa entre actividad humana y la respuesta espectral de suelos. Discutimos cómo se pueden usar estos métodos en otros sitios similares para detectar remotamente indicadores de actividad antropogénica, incluyendo elementos por debajo de la superficie.
ACKNOWLEDGMENTS
Funding for the magnetic gradient prospection and excavation was made possible by the National Science Foundation (1424132-Stoner [Arkansas] and 1424184-Nichols [Dartmouth]) the National Geographic Society (Stoner and Nichols 9432-14), the Claire Garber Goodman Fund (Dartmouth), the Rockefeller Center for Social Sciences Urban Studies Grant (Dartmouth), the Dickey Center for International Understanding (Dartmouth), the Neukom Center for Computational Sciences (Dartmouth), and the William J. Bryant 1925 Professor of Anthropology (Dartmouth), while the aerial remote survey was a product of the National Aeronautical and Space Administration and Pennsylvania Space Grant Consortium's Space Grant Fellowship to the first author and a generous grant from the Stamps Family Charitable Foundation. We would also like to thank Deborah Nichols, Wesley Stoner for the opportunity to participate in the project and thoughtful comments to drafts of this paper, Christian John for assistance in the production of the multispectral dataset, an anonymous reviewer for their thoughtful and valuable feedback, and the people of San Francisco Tlaltica. Finally, we are grateful to the Consejo de Arqueología of the Instituto Nacional de Antropología e Historia and CINAH Estado de Mexico for permission to excavate at Altica (Stoner and Nichols) and carry out the multispectral remote sensing (Mejía Ramón #401.1S.3-2017/1360). Artifacts from the Altica excavations and survey are curated at the ASU Teotihuacan Research Laboratory. The multispectral dataset used here is available for free download via The Pennsylvania State University's ScholarSphere (https://doi.org/10.18113/S1HD22). The authors declare no conflicts of interest.