In the large intestine, a diverse community of bacteria engages in fermentation processes that collectively constitute the gut microbiota. These fermentations rely on carbohydrates and utilise dietary fibres such as high-amylose maize starch (HAMS) and inulin, which are well known to support host health by promoting butyrate production and increasing the abundance of Bifidobacterium spp(Reference Regmi, Metzler-Zebeli and Ganzle1,Reference Cheng and Zhou2) . However, unusual patterns of colonic fermentation have been reported when large amounts of a single, refined fibre, antibiotics or polyethylene glycol are consumed, likely due to differences in the colonic microbiota composition(Reference Morita, Hino and Ito3–Reference Ferreyra, Wu and Hryckowian5). We have previously shown that rats fed high doses of HAMS, fructo-oligosaccharides or inulin accumulate high concentrations of succinate in the caecum(Reference Umeda, Yamada and Kawase6,Reference Tamura, Mita and Shigematsu7) . Although such findings are uncommon, similar succinate accumulation in response to non-digestible saccharides has been reported in other studies(Reference Aprikian, Duclos and Guyot8–Reference Komura, Fukuta and Genda10). We believe that these discrepancies reflect differences in the microbiota of experimental animals sourced from different suppliers. It is well established that the colonic microbiota of laboratory rodents varies depending on the supplier(Reference McAdams, Busi and Gustafson11), and such differences may render some animals more susceptible to succinate accumulation when exposed to non-digestible saccharides. Succinate is primarily produced via the vitamin B12 (VB12)-dependent succinate pathway, which is one of the major propionate-producing pathways utilised by colonic bacteria(Reference Reichardt, Duncan and Young12).
Although mammals ingest trace amounts of VB12 through their diet, only a small fraction reaches the large intestine due to efficient absorption in the upper gastrointestinal tract. The VB12 content of the widely used AIN-93G semi-purified rodent diet is 25 µg/kg(Reference Reeves, Nielsen and Fahey13), approximately half the level recommended by the National Research Council(14) and that found in standard laboratory chow. In our previous work, we demonstrated that high-dose HAMS feeding reduced caecal VB12 concentrations and led to succinate accumulation, which was resolved when higher amounts of dietary VB12 were provided(Reference Umeda, Yamada and Kawase6). These findings suggest that VB12 may act as a rate-limiting factor in the succinate pathway when large amounts of non-digestible carbohydrates such as HAMS are fed in the context of a microbiota predisposed to succinate accumulation. However, the colonic VB12 concentrations and dietary intake levels required to prevent such accumulation remain undefined.
Although studies have investigated VB12 intake in humans(Reference Yoshino, Inagawa and Oshima15,Reference Xu, Wang and Gao16) , typical intake levels are likely comparable to those provided by the AIN-93G diet. The average dietary VB12 intake in Japanese adults is 6·3 µg/d(17), which is considered sufficient for host physiology but corresponds to only about 16 μg/kg diet – comparable to or lower than the 25 μg/kg in the AIN-93G diet. Current reference values are based on host requirements and do not consider microbial demand in the large intestine. Thus, even if increasing dietary VB12 could suppress succinate accumulation, achieving the necessary intake through habitual diet alone is unrealistic. Colonic bacteria are known to synthesise VB12 and its analogues(Reference Allen and Stabler18), suggesting that enhancing microbial biosynthesis of VB12 and its analogues may help maintain a colonic environment resistant to succinate accumulation – even when the succinate pathway is activated by non-digestible saccharides. As both VB12 and its analogues incorporate cobalt (Co) as a central component, adequate Co availability is essential. In ruminants, Co deficiency has been shown to reduce plasma VB12 concentrations, increase ruminal succinate accumulation in the rumen and decrease propionate production(Reference Kennedy, Young and McCaughey19). These findings indicate that Co is essential for microbial VB12 synthesis and appears to play a key role in maintaining fermentation balance in the rumen. Similarly, in hindgut fermenters such as humans and rats, Co may play a stabilising role in colonic fermentation. However, very few studies have examined the effect of dietary Co supplementation in these studies.
Therefore, using rats susceptible to succinate accumulation in response to non-digestible saccharides, the present study aimed to (i) determine the minimum colonic VB12 concentration required to prevent succinate accumulation under high-dose non-digestible saccharide feeding and (ii) identify the colonic Co concentration necessary to support microbial synthesis of VB12 and its analogues, thereby preventing succinate accumulation in the colon.
Materials and methods
Samples
HAMS (Class 7, 70 % amylose content, 41 % resistant starch content and 52 % digestibility in rat small intestine(Reference Nishimura, Tanabe and Yamamoto20)) and fucose were supplied by Nihon Shokuhin Kako Co., Ltd. Cyanocobalamin and Co carbonate basic were purchased from FUJIFILM Wako Pure Chemical Co., Ltd.
Animals and diets
Male Sprague-Dawley rats (5-week-old; body weight range: 130–150 g) were purchased from Japan SLC. Eighty-four rats were used for the experiments. Rats were housed in individual cages with screen bottoms made of stainless steel and kept in a room maintained at 23 ± 2°C, with 50–70 % humidity, and under 12-h light (0700 to 1900) and 12-h darkness conditions. For all experiments, rats were first acclimatised to the experimental settings for 7 d and given either a 25 % casein diet containing 25 μg/kg VB12 (25VB12C diet; Experiment 1) or a 25 % casein diet containing no VB12 (Reference Komuro, Kondo and Hino21,Reference Nishimura, Tanabe and Sasaki22) (VB12-free C diet; Experiments 2 and 3) (Supplemental Table 1), which was a diet in accordance with the AIN-93G diet, and water ad libitum. In Experiments 2 and 3, rats were fed VB12-deficient diets; however, based on prior findings, no symptoms of deficiency were expected or observed. No interventions to reduce pain or distress were required. Humane endpoints, including body weight loss, were predefined, but no animals exhibited signs requiring early termination. All animals completed the study and were included in the final analysis.
The present study was approved by the Shizuoka University Animal Use Committee (approval numbers: 2020A-15 and 2021A-5). Animals were kept and cared for as per the Guidelines for the Care and Use of Laboratory Animals, issued by Shizuoka University.
Experiment 1
To determine the caecal VB12 concentration required to suppress the accumulation of caecal succinate in rats fed a high level of HAMS, the relationship between caecal VB12 and succinate concentrations was examined in rats given varying doses of VB12. Following the acclimatisation period, thirty rats with comparable body weights were randomly assigned to five groups (n 6 each). The groups received either a control diet containing 25 μg/kg VB12 (25VB12C) or a diet containing 20 % HAMS with 25, 50, 100 and 200 μg/kg VB12 (25VB12H, 50B12H, 100B12H and 200B12H, respectively) for 14 d. Based on previous studies showing that the gut microbiota in humans and rodents stabilises within several days to 1 week after dietary changes(Reference Carmody, Gerber and Luevano23–Reference Nishimura, Tanabe and Komori25), the experimental feeding period was set to 14 d to ensure that microbial adaptation to each diet had reached a stable state. HAMS supplementation was achieved by replacement of an equal weight of maize starch in the diets.
Experiment 2
To determine whether Co supplementation to the large intestine could stimulate VB12 synthesis by colonic bacteria and suppress succinate accumulation in rats fed high level of HAMS, caecal concentrations of VB12, succinate and propionate concentrations were examined in HAMS-fed rats given varying doses of Co. Following the acclimatisation period, thirty rats with comparable body weights were randomly assigned to five groups (n 6 each). The groups received either a VB12-free control diet (C) or a diet containing 20 % HAMS with Co carbonate to provide 0, 4, 20 and 200 μg/kg Co (H, 4CoH, 20CoH and 200CoH, respectively) for 14 d. HAMS supplementation was achieved by replacement of an equal weight of maize starch in the diets.
Experiment 3
To determine the effect of Co supplementation to the large intestine on the colonic microbiota, changes in the caecal microbiota were examined in rats in which Co supplementation to the large intestine resulted in an increased caecal concentration of VB12 equivalents. Following the acclimatisation period, twenty-four rats with comparable body weights were randomly assigned to four groups (n 6 each). The groups received either a VB12-free control diet or a diet containing 20 % HAMS, with or without 200 μg/kg Co (H, CoC and CoH, respectively), for 14 d.
HAMS and Co supplementations were achieved by replacing an equal weight of maize starch in the diets.
Sampling
At the end of the experimental period, all rats were fasted for 2 h and anesthetised via inhalation of 2 % isoflurane prior to laparotomy. Under anaesthesia, a longitudinal abdominal incision was made. The rats were then killed by exsanguination via the abdominal aorta. The caecum was excised and weighed, and its contents were collected. Aliquots of the caecal content were immediately used for the analysis of organic acids and pH. The remaining contents were stored in airtight tubes at –80°C until further analysis. The caecal tissue was rinsed with ice-cold saline, blotted and weighed.
Determination of caecal cobalt content and diets
Caecal contents (0·3 g) and diets (1 g) were wet ashed and then diluted to constant volume. Co content in the resulting solution was analysed using an inductively coupled plasma optical emission spectrometer (iCAP 7400 ICP-OES, Thermo Fisher Science). Emission intensity was measured at a wavelength of 228·616 nm. A standard curve was generated a series of Co standard solutions (1·56, 3·13, 6·25, 12·5, 25, 50 and 100 μg/L) and used to calculate the Co content of caecal samples.
Determination of caecal pH
Aliquots (0·3 g) of caecal content were mixed with an equal amount of distilled water, and the pH was measured using a pH meter (LAQUAtwin, Horiba Ltd).
Determination of caecal organic acid
A 150 mg sample of caecal content was homogenised in 0·35 mL ice-cold water and 0·5 mL of 10 mmol/L NaOH containing 0·3 g/L crotonic acid (internal standard), followed by centrifugation at 15 000×g at 4°C for 15 min. The supernatant was deproteinised with an equal volume of chloroform and subjected to HPLC analysis. Organic acids (acetate, propionate, n-butyrate and succinate) were measured using an HPLC system (LC-10A, Shimadzu) equipped with a Shim-pack SCR-102H column (8 mm i.d. × 30 cm; Shimadzu) and an electro-conductivity detector, as previously described(Reference Hoshi, Sakata and Mikuni26).
Determination of caecal vitamin B12 concentration
by LC-MS/MS
VB12 was extracted and purified from caecal contents using a modified method of Zironi et al.(Reference Zironi, Gazzotti and Barbarossa27). A 150 mg sample of caecal content was homogenised in 2 mL of 200 mmol/L sodium acetate buffer (pH 4·0), with 20 μL of 10 μg/mL dicyanocobinamide (internal standard)(Reference Perez-Fernandez, Gentili and Martinelli28) and 20 μL of 1 % sodium cyanide. The mixture was boiled for 30 min and kept overnight at 4°C in dark. After centrifugation at 1700×g for 15 min, 1·8 mL of the supernatant was applied to an Oasis HLB cartridge (6 mL, 500 mg; Waters) and pre-conditioned with 3 mL of methanol and 3 mL of water(Reference Yin, Fountain and Diehl29). The column was washed with 4 mL of 5 % methanol, and the VB12 fraction was eluted with 4 mL of methanol. The eluent was evaporated under vacuum and reconstituted in ultrapure water for LC-MS/MS analysis. The resulting eluents were analysed by a ultra-performance liquid chromatography coupled to tandem mass spectrometry system consisting of an ACQUITY ultra-performance liquid chromatography I-Class (Waters) coupled to a triple quadrupole mass spectrometer (Waters) equipped with an electrospray ionisation source operating in positive ion mode. Chromatographic separation of cyanocobalamin was achieved using an ACQUITY ultra-performance liquid chromatography HSS T3 column (2·1 × 150 mm, 1·8 μm; Waters) maintained at 40°C. The mobile phase consisted of (A) 10 mmol/L ammonium formate in Milli-Q water containing 0·1 % formate and (B) 10 mmol/L ammonium formate in methanol containing 0·1 % formate. A gradient elution was performed at a flow rate of 0·45 mL/min as follows: 0–3·0 min, 1 % B; 3·0–3·1 min, 1–5 % B; 3·1–5·1 min, 5–20 % B; 5·1–7·1 min, 20–99 %; 7·1–12·0 min, 99 % B; 12·0–12·1 min, 99–100 % B, 12·1–16·0 min, 100 % N, followed by re-equilibration. The injection volume was 10 µL.
A matrix-matched quantification method was employed, using extracts from caecal contents of rats fed the VB12- and Co-free control diet as the matrix for preparation of calibration curves. These extracts were prepared as described above and spiked with a range of VB12 (1, 5, 10, 50, 100, 500 and 1000 nmol/L) and dicyanocobinamide concentrations. Calibration curves were constructed by plotting peak areas against the spiked concentrations and were freshly prepared for each analysis. The limits of detection and quantification of VB12 were estimated from the analysis of diluted samples and corresponded to concentrations at which six data points could be reliably detected in a peak. The limits of detection and quantification were 1·5 and 5 nmol/L, respectively. The recovery of VB12 ranged from 80 to 90 %, calculated by comparing peak areas of VB12 spiked before and after solid-phase extraction using an Oasis HLB cartridge.
Determination of caecal vitamin B12-equivalent concentration by microbiological assay
Caecal VB12 equivalents were measured by microbiological assay using the same VB12 extracts as described above for the LC-MS/MS analysis. The assay was performed using a commercial kit (VitaFast Vitamin B12, R-Biopharm AG) according to the manufacturer’s protocol.
Determination of caecal ammonia
Caecal ammonia concentrations were measured by the method of McCullough(Reference McCullough30).
Total bacterial counts by quantitative PCR
Bacterial DNA was extracted from frozen caecal contents using a DNA extraction kit (ISOFECAL for Beads Beating kit, Nippon Gene) according to the manufacturer’s protocol, except for the disruption step of bacteria. Frozen caecal contents (200 mg) were disrupted at 2700 rpm for 90 s using a Multi-Beads shocker (MB601U, Yasui Kikai). The extracted DNA was dissolved in DNase-free TRIS-EDTA buffer (pH 8·0; 10 mmol/L TRIS-HCl, 1 mmol/L EDTA) and stored at –30°C until quantitative PCR (qPCR) analysis.
PCR was performed in a total volume of 20 μL using TB Green Premix Ex Taq II (Takara Bio Inc.), with 200 nmol/L of each primer and 5–5·5 ng of DNA per reaction. Total bacteria counts were quantified using primers targeting 16S rRNA gene sequences, as listed in Supplemental Table 2 (Reference Guo, Xia and Tang31). Amplification and detection were performed using an Mx3000P real-time PCR system (Agilent Technologies). For quantification, ten-fold serial dilutions of a TA cloning vector (pCR2.1-TOPO, Life Technologies) containing 16S rDNA insert from Lactobacillus acidophilus (JCM1132) were used to generate standard curves. Absolute rDNA abundance was calculated based on the standard curves. A qPCR assay was conducted in duplicate in the same analysis run.
Library preparation and DNA sequencing
Libraries for 16S rRNA gene amplicon sequencing were prepared according to the method of Inoue et al.(Reference Inoue, Sakaue and Sawai32). Sequencing was performed on a MiSeq platform (Illumina) using the MiSeq Reagent Kit v3 (600 cycles, paired-end), and libraries were loaded according to the manufacturer’s protocol. Sequence data were processed using QIIME 2 (version 2021·4)(Reference Bolyen, Rideout and Dillon33). Briefly, sequences were denoised and trimmed (seventeen bases from the 5’ end and nineteen bases from the 3’ end) using the DADA2 plugin to generate amplicon sequence variants. Chimeras were removed, and sequences were taxonomically classified using BLAST (e-value < 1e−10) against a local installation of the National Center for Biotechnology Information taxonomy database (16S rRNA gene sequences; version dated 17 February 2025). Rarefaction curves (α-diversity) and principal coordinate analysis plots based on weighted UniFrac distances (β-diversity) were also generated using QIIME 2.
Statistical analysis
To determine the appropriate sample size for detecting significant differences in caecal succinate concentrations due to caecal delivery of VB12 and Co, an a priori power analysis for ANOVA was carried out. The calculation assumed an α level of 0·05, a power of 0·80 and an effect size (f) of 0·4 based on our previous study(Reference Umeda, Yamada and Kawase6). This analysis indicated that a sample size of six rats per group was required. Data were tested for homogeneity of variances using Bartlett’s test. For comparisons between the control and HAMS groups receiving the 25 μg/kg VB12 diet (Experiment 1), and between the Co-free control and HAMS groups (Experiment 2), Welch’s t test was applied. For comparisons among multiple HAMS groups, data with unequal variances were stabilised using the Box–Cox transformation, followed by one-way ANOVA (Experiments 1 and 2) if variance homogeneity was confirmed. In such cases, a Tukey–Kramer post hoc test was used for multiple comparisons. If variances remained unequal after transformation, the Games–Howell test was employed. In Experiment 3, two-way ANOVA (factors: resistant starch, Co and their interaction) was used, followed by a Tukey–Kramer post hoc test when a significant interaction was detected (P < 0·05). For α-diversity analysis of caecal microbiota, a mixed-design repeated-measures ANOVA was conducted to assess the effects of HAMS, Co and sequencing depth on the Chao1 index. A Tukey–Kramer post hoc test was applied following a significant three-way interaction (HAMS × Co × sequencing depth). For β-diversity analysis of caecal microbiota, PERMANOVA was performed. All statistical analyses were performed using JMP Pro software (version 18.0.2; SAS Institute). Data are presented as means and standard errors, and differences were considered statistically significant at P < 0·05.
Results
Experiment 1
Body weight gain, food intake and food efficiency did not significantly differ among the experimental groups (Supplemental Table 2). In contrast, VB12 intake increased significantly in a dose-dependent manner. The weights of caecal tissue and contents were significantly greater in the 25VB12H group than in the 25VB12C group (Table 1), whereas no such differences were observed among the HAMS-fed groups receiving different amounts of VB12. Caecal pH was significantly lower in the 25VB12H group compared with the 25VB12C group, with no difference among the HAMS-fed groups. Caecal cobalamin concentrations increased dose-dependently with VB12 and reached statistical significance in the 200VB12H group compared with the 25VB12H group (Figure 1). Compared with the 25VB12C group, caecal propionate concentrations were significantly lower and succinate concentrations were significantly higher in the 25VB12H group. In HAMS-fed rats, increasing the dietary VB12 dose led to a further increase in propionate concentrations in the 100VB12H and 250VB12H groups, while succinate concentrations decreased accordingly. In HAMS-fed rats, caecal succinate concentration was inversely correlated with caecal VB12 concentration, following a power-law relationship (Figure 2). Compared with the 25VB12C group, both caecal propionate and succinate pools were significantly higher in the 25VB12H group, as a result of caecal enlargement induced by HAMS intake. In contrast, caecal propionate pools remained unchanged among the HAMS-fed groups, whereas succinate pools decreased in a dose-dependent manner with increasing VB12 levels. Caecal acetate and n-butyrate concentrations also increased in a dose-dependent manner, with no significant differences among the HAMS-fed groups receiving different levels of VB12 (Table 1). Compared with the 25VB12C group, caecal tissue and content weights, as well as acetate and n-butyrate pools, were significantly higher in the 25VB12H group, and caecal pH was significantly lower. Among the HAMS-fed groups, however, no significant differences were observed in these parameters. Caecal acetate and n-butyrate concentrations increased in a dose-dependent manner with diets containing more than 100 μg/kg of VB12. Caecal ammonia concentrations and total bacterial counts did not differ among the groups.
Caecal tissue and content weight, caecal acetate and n-butyrate concentration, and total bacterial counts in rats given the 20 % high-amylose maize starch (HAMS) diet supplemented with different dose of vitamin B12 (VB12) for 14 d (n 6) (Mean values with their standard errors)

25VB12C, the groups given the control diet supplemented with 25 μg/kg VB12; 25VB12H, 50VB12H, 100VB12H and 200VB12H, the groups given the 20 % HAMS diet supplemented with 25, 50, 100 and 200 μg/kg VB12, respectively.
a,b,c Values in a column not sharing a common superscript letter are significantly different (P < 0.05). Data were analysed by one-way ANOVA followed by the Tukey–Kramer post hoc test.
*,*** Mean values are significantly different between the 25VB12C and 25VB12H groups (P < 0.05 and P < 0.001, respectively). Data were analysed by Welch’s t test.
Dose-dependent effects of dietary vitamin B12 (VB12) on caecal cobalamin concentrations and caecal succinate and propionate concentrations and pools in rats fed either a control diet containing 25 μg/kg cyanocobalamin (VB12) (25VB12C) diet or a 20 % high-amylose maize starch (HAMS) diet supplemented with 25, 50, 100 or 200 μg/kg VB12 for 14 d. (a) Caecal cobalamin concentrations, (b) caecal succinate and propionate concentrations and (c) caecal succinate and propionate pools. Values are means with their standard errors represented by vertical bars (n 6). (a) Circles represent individual rat values. (b) and (c) Open circles represent propionate and closed circles represent succinate. *,† Mean values are significantly different between the 25VB12C and 25VB12H groups (P < 0·05). a,b Mean values of caecal cobalamin and succinate not sharing a common letter differ significantly (P < 0·05). α,β Mean values of caecal propionate not sharing a common Greek letter differ significantly (P < 0·05). Data were analysed by one-way ANOVA followed by the Tukey–Kramer post hoc test.

Correlation between caecal cobalamin (VB12) and succinate concentrations in rats fed 20 % high-amylose maize starch (HAMS) diets supplemented with 25, 50, 100 or 200 μg/kg VB12. Circles represent individual values for each rat fed HAMS. A negative correlation was observed between caecal succinate and VB12 concentrations, following a power-law relationship. The dashed line indicates the fitted regression: Y = –0·4025X + 2·355 (r 2 0·340, P = 0·003, n 24), where Y and X represent the logarithmic values of caecal succinate and VB12 concentrations, respectively.

Experiment 2
Body weight gain, food intake and food efficiency did not significantly differ among the experimental groups (Supplemental Table 3). In contrast, Co intake increased significantly in a dose-dependent manner.
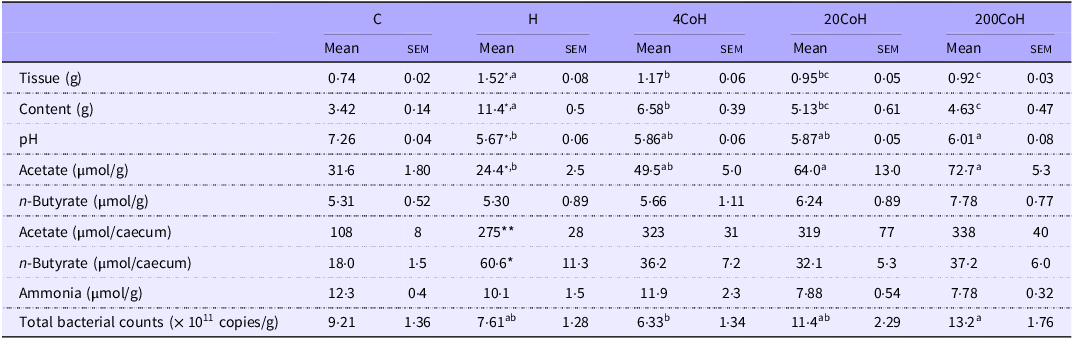
Caecal tissue and content weights were significantly greater in the H group (HAMS-fed) than in the C group (no HAMS) (Table 2), whereas these weights decreased dose-dependently with Co carbonate. Caecal pH increased dose-dependently with Co carbonate. Caecal cobalamin and VB12-equivalent concentrations were significantly lower and tended to be lower, respectively, in the H group compared with the C group (Figure 3). Among the HAMS-fed groups, caecal cobalamin concentrations measured by UPLC-MS/MS did not differ significantly despite Co carbonate supplementation; however, VB12-equivalent concentrations measured by microbiological assay increased in a dose-dependent manner. ΔVB12-equivalent concentration, representing the increase due to Co supplementation, showed a strong positive correlation with dietary Co intake (n 18, r 0·747, P < 0·001). Due to the small sample volume, samples were pooled and analysed to assess the presence of VB12 analogues based on the peak areas in the UPLC-MS/MS mass spectra, as authentic standards for analogues were not available (Supplemental Table 4). Several VB12 analogues such as 5-methoxybenzimidazolyl cobamide, 5-hydroxybenzimidazolyl cobamide and 2-methyladenocyl cobamide were detected in the caecal contents of HAMS rats administered Co carbonate, and these levels increased dose-dependently. Caecal propionate concentrations did not differ between the C and H groups, whereas succinate concentrations were significantly higher in the H group (Figure 3). Among the HAMS-fed groups, caecal propionate concentrations remained unchanged, while succinate concentrations decreased in a dose-dependent manner with Co carbonate. Caecal propionate and succinate pools tended to be higher and were significantly higher, respectively, in the H group compared with the C group. Among the HAMS-fed groups, caecal propionate pools did not differ, whereas succinate pools decreased in a dose-dependent manner with Co carbonate.
Caecal tissue and content weight, caecal acetate and n-butyrate concentration, and total bacterial counts of rats given either the cobalt-free, 20 % high-amylose maize starch (HAMS) diets supplemented with 4, 20 or 200 μg/kg Co (n 6) (Mean values with their standard errors)

C, group given the Co-free, control diet; H, group given the Co-free, 20 % HAMS diet; 4CoH, 20CoH and 200CoH, groups given the 20 % HAMS diet supplemented with 4, 20 and 200 μg/kg Co, respectively. Cobalt carbonate was used as the cobalt source.
a,b,c Values in a column not sharing a common superscript letter are significantly different (P < 0.05). Data were analysed by one-way ANOVA followed by the Tukey–Kramer post hoc test, or by the Games–Howell test when variance homogeneity was not confirmed.
*,** Mean values are significantly different between the C and H groups (P < 0.05 and P < 0.01, respectively). Data were analysed by Welch’s t test.
Dose-dependent effects of dietary cobalt (Co) on caecal cobalamin concentrations and caecal succinate and propionate concentrations and pools in rats fed either a Co- and cyanocobalamin (VB12)-free control (C) diet or a VB12-free diet containing 20 % high-amylose maize starch (HAMS) diet supplemented with 0, 4, 20 or 200 μg/kg Co for 14 d. (a) Caecal cobalamin concentrations, (b) caecal succinate and propionate concentrations and (c) caecal succinate and propionate pools. Values are means with their standard errors represented by vertical bars (n 6). (a) Circles represent individual rat values. (b) and (c) Open circles represent propionate and closed circles represent succinate. *,** Mean values are significantly different between the C and HAMS groups not supplemented with cobalt (P < 0·05). a,b Mean values of caecal cobalamin and succinate not sharing a common letter differ significantly (P < 0·05 and P < 0·01, respectively). Data were analysed by one-way ANOVA followed by the Tukey–Kramer post hoc test.

Experiment 3
Body weight gain and food intake did not significantly differ among the experimental groups (Supplemental Table 5). In contrast, Co intake was quantifiable only in the groups fed diets supplemented with Co carbonate. Food efficiency was significantly higher in the H group than in the C group.
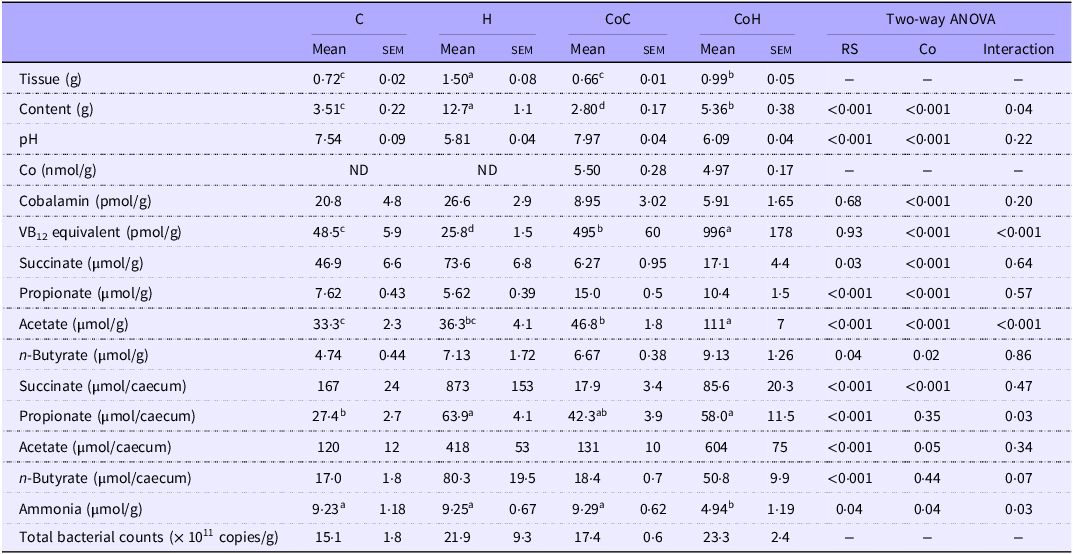
Caecal tissue and content weights were significantly increased by HAMS feeding; however, the effect was significantly attenuated by Co supplementation (Table 3). Caecal pH was significantly decreased by HAMS feeding and increased by Co supplementation. Co was detected only in the caecal contents of groups fed Co carbonate. HAMS feeding had no effect on caecal cobalamin concentrations, whereas Co supplementation significantly reduced these concentrations. In contrast, as in Experiment 2, caecal VB12-equivalent concentrations were significantly higher in the Co supplementation groups than in the non-supplemented groups, with this concentration in the CoC group being 1000% of that in the C group and in the CoH group being 3900% of that in the H group. VB12-equivalent concentrations in the H group were significantly lower than in the C group, whereas concentrations in the CoH group were significantly higher than those in the CoC group. Caecal succinate concentrations were significantly increased by HAMS feeding and decreased by Co supplementation, whereas caecal propionate concentrations showed the opposite pattern – decreasing with HAMS and increasing with Co. Caecal acetate concentrations were significantly higher in the CoC and CoH groups than in their respective counterparts. An increase in acetate concentration by HAMS feeding was observed only in Co-supplemented rats. Caecal succinate pools were significantly increased by HAMS feeding and decreased by Co supplementation. In contrast, caecal propionate pools were significantly higher in the H group than in the C group, but no significant effect of HAMS feeding was observed in Co-supplemented rats. Caecal acetate and n-butyrate pools were significantly increased by HAMS feeding, with no effect of Co supplementation. Caecal ammonia concentrations were significantly higher in the CoH group compared with the other three groups. Total caecal bacterial counts did not differ significantly among the groups. α-Diversity, as measured by the Chao1 index (an indicator of bacterial species richness), was significantly lower in the HAMS-fed groups compared with the non-HAMS (Supplemental Figure 1). Significant differences in β-diversity were observed among the groups (PERMANOVA, weighted UniFrac, P = 0·01). The relative abundance of the genus Bifidobacterium was significantly increased by HAMS feeding in rats not receiving Co supplementation and showed a tendency to increase in Co-supplemented rats (P = 0·092, Supplemental Table 6). Although Bacteroides remained above 20% in HAMS-fed rats without Co supplementation, its abundance in Co-supplemented rats remained low at approximately 2%, similar to levels observed in non-HAMS-fed groups without Co supplementation. Phocaeicola, recently reclassified from Bacteroides, showed lower abundance in HAMS-fed groups compared with non-HAMS-fed groups, regardless of Co supplementation. In contrast, Akkermansia exhibited a marked reduction to below 1 % in HAMS-fed rats without Co supplementation; however, in Co-supplemented rats, this reduction was not observed, and the abundance remained above 10%.
Caecal tissue and content weight, caecal acetate and n-butyrate concentration and total bacterial counts of rats given either the control (C) or 20 % high-amylose maize starch (HAMS) diets, with or without 200 μg/kg Co supplementation (n 6) (Mean values with their standard errors)

C, group given the Co-free, control diet; H, group given the Co-free, 20 % HAMS diet; 0.004CoH, 0.02CoH and 0.2CoH, groups given the 20 % HAMS diet supplemented with 4, 20 and 200 μg/kg Co, respectively; RS, resistant starch. Cobalt carbonate was used as the cobalt source. Co, cobalt; RS, resistant starch.
a,b,c Values in a column not sharing a common superscript letter are significantly different (P < 0.05). Data were analysed by two-way ANOVA followed by the Tukey–Kramer post hoc test, or by the Games–Howell test when variance homogeneity was not confirmed.
Discussion
In line with our previous study(Reference Umeda, Yamada and Kawase6), the present study confirmed that diets containing 20 % HAMS induced succinate accumulation in the caecum of rats, and that increasing dietary VB12 returned succinate levels to near baseline (i.e. the levels observed in the non-HAMS group), effectively reversing the HAMS-associated accumulation. We further investigated the dose-dependent effects of low levels of VB12 on succinate concentrations in HAMS-fed rats and found that caecal succinate concentrations were negatively correlated with cobalamin concentrations, following a power-law relationship. Based on this functional equation, the estimated caecal cyanocobalamin concentration required to maintain succinate levels at 40 µmol/g – the level observed in rats not fed HAMS – was 74 pmol/g. This estimate closely matched the measured concentration of VB12 (59 pmol/g) in rats fed a HAMS diet supplemented with 100 µg/kg of VB12. In other words, feeding four times the amount of VB12 found in the AIN-93G diet suppressed the succinate accumulation induced by HAMS in the large intestine. Although this finding may seem unexpected, given that few studies have reported marked succinate accumulation in the caecum following HAMS or inulin consumption, we have consistently observed this response in our rat model(Reference Umeda, Yamada and Kawase6,Reference Tamura, Mita and Shigematsu7) . Notably, rats sourced from our supplier exhibit reproducible succinate accumulation in the caecum in response to a variety of non-digestible saccharides, not limited to HAMS. Since succinate is increasingly recognised as a pro-inflammatory mediator, particularly in the context of inflammatory bowel disease(Reference Connors, Dawe and Van Limbergen34), its accumulation in the large intestine may have pathophysiological relevance. In the present study, however, succinate accumulation was not accompanied by any apparent colonic injury or dysfunction, suggesting that succinate itself does not directly induce inflammation under physiological conditions. Nevertheless, luminal succinate has been reported to exacerbate inflammation under mucosal damage or dysbiosis(Reference Connors, Dawe and Van Limbergen34,Reference Fremder, Kim and Khamaysi35) . Therefore, the succinate accumulation observed here may represent a reversible metabolic imbalance rather than pathology, and maintaining its homoeostasis could be important for preventing inflammatory exacerbation under disturbed intestinal conditions.
When Co – an essential component of VB12 and its analogues – was administered to HAMS-fed rats, caecal cobalamin concentrations remained unchanged (4–14 pmol/g), whereas VB12-equivalent concentrations measured by microbiological assay increased markedly in a Co dose-dependent manner, reaching 67–915 pmol/g. This finding suggests that Co supplementation promotes microbial synthesis of VB12 analogues rather than cobalamin itself, thereby contributing to the suppression of succinate accumulation in the colon. This result is consistent with a human study reporting that VB12 analogues account for more than 98 % of total VB12-related compounds in faeces(Reference Allen and Stabler18). Approximately 80 % of bacteria in the large intestine require VB12, yet only a limited number of species possess the capacity for its biosynthesis(Reference Degnan, Barry and Mok36). Most intestinal bacteria instead rely on VB12 and its analogues produced by other microbial species(Reference Degnan, Barry and Mok36,Reference Kundra, Greppi and Duppenthaler37) . In the present study, Co supplementation eliminated HAMS-induced succinate accumulation in a manner comparable to direct VB12 administration, presumably because the microbial synthesis of VB12-related compounds allowed the succinate pathway to proceed without restriction. However, at the lowest Co dose (4 µg/kg), caecal succinate concentrations did not fully return to baseline, likely because the VB12-equivalent concentration (67 pmol/g) did not reach the threshold (74 pmol/g) estimated to suppress succinate accumulation. Considering that typical human dietary Co intake ranges from 5 to 45 µg/d globally and 11 to 28 µg/d in Japan(Reference Elinder, Friberg and Nordberg38–Reference Neve40), primarily in the form of VB12, these levels correspond to approximately 12·5–125 µg/kg dietary Co, suggesting that normal human Co intake may be sufficient to support microbial VB12 synthesis in the colon.
In the present study, due to the limited volume of caecum content per rat, samples from rats within the same group were pooled for the analysis of VB12 analogues by UPLC-MS/MS. Peak area values were used as a proxy for relative abundance, and among the detected analogues, 2-methyladeninyl cobamide exhibited the largest peak area, which increased significantly with Co supplementation. High concentrations of this analogue have also been reported in human faeces(Reference Allen and Stabler18), suggesting that a similar pattern may occur in the rat large intestine. Furthermore, Co administration in cattle has been shown to increase 2-methyladeninyl cobamide concentrations in rumen contents(Reference Stemme, Lebzien and Flachowsky41,Reference Girard, Santschi and Stabler42) . Notably, even when VB12 itself is administered, it is reportedly converted to various analogues, including 2-methyladeninyl cobamide(Reference Girard, Santschi and Stabler42). These findings suggest that both human and rat colonic bacteria, as well as rumen microbiota, are likely to preferentially utilise VB12 analogues containing 2-methyladenine as the lower ligand instead of the canonical 5,6-dimethylbenzimidazole. It should be noted, however, that the peak areas do not necessarily reflect equimolar concentrations across all analogues due to potential differences in ionisation efficiency or detector response. Thus, further quantitative analysis is warranted to determine the absolute concentrations of each VB12 analogue under Co supplementation conditions. Because authentic standards were unavailable, the LC-MS/MS analysis in this study aimed only to confirm the presence and Co-dependent increase of VB12 analogues rather than to quantify their absolute levels. In humans, VB12 absorption in the terminal ileum is limited, and unabsorbed dietary and biliary VB12 can reach the large intestine, where it may serve as a substrate for microbial metabolism(Reference Allen and Stabler18). Although faecal VB12 and its analogues were not examined in this study, future work should address their behaviour to better understand microbial VB12 metabolism in the colon. Moreover, the functional activity of these analogues in the enterobacterial succinate pathway remains to be clarified.
The difference in SCFA profiles between VB12 and Co supplementation (Tables 1 and 2) is unlikely to result from a direct activation of the butyrate synthesis pathway by a specific cobalamin molecule, because the known enzymatic steps of butyrate formation do not involve any VB12-dependent reactions. Instead, the divergence between VB12 and Co supplementation may reflect differences in the composition of the microbiota and in the corrinoid species available to them. In the VB12-supplemented rats, an increased supply of authentic cobalamin may have preferentially supported butyrate-producing bacteria that possess high-affinity VB12 transporters, leading to elevated butyrate concentrations. In contrast, in the Co-supplemented rats, the colonic VB12 pool appeared to contain a higher proportion of VB12 analogues relative to cobalamin, and these analogues might not equally support the metabolic activity of butyrate producers. Moreover, the Co-induced production of various VB12 analogues could have altered competitive interactions among corrinoid-utilising bacteria, thereby modifying the balance between propionate- and butyrate-producing populations. Gut bacteria are known to possess multiple VB12 transporters with distinct corrinoid preferences(Reference Degnan, Barry and Mok36), and recent work has shown that different corrinoids can differentially support propionate-producing species(Reference Kundra, Greppi and Duppenthaler37). Such corrinoid-driven community re-sorting may help explain the observed difference in butyrate responses between VB12 and Co supplementation.
Recently, Bacteroides thetaiotaomicron and Akkermansia muciniphila in human faeces, both of which utilise the succinate pathway to produce propionate from hexoses, have been shown in vitro to convert succinate to propionate using VB12 and its analogues as coenzymes. In the present study, supplementation with VB12 and Co may have contributed to the suppression of succinate accumulation by facilitating metabolism through the succinate pathway. B. thetaiotaomicron possesses multiple VB12 transporters, suggesting a high capacity for preferential VB12 uptake compared with other bacteria(Reference Degnan, Barry and Mok36). In contrast, Akkermansia has also been reported to possess the capacity to take up VB12 or its analogues, although this ability appears to be limited(Reference Kirmiz, Galindo and Cross43). This difference may explain the microbial composition observed in this study: rats fed large amounts of HAMS without sufficient VB12 supply to the large intestine, due to the absence of dietary Co, exhibited a higher relative abundance of Bacteroides (24 %) and a significantly lower abundance of Akkermansia (0·7 %). However, when sufficient amounts of VB12 and its analogues were supplied to the colon of HAMS-fed rats via Co supplementation, the relative abundances of both Bacteroides and Akkermansia remained comparable to those in non-HAMS-fed rats. These findings suggest that the availability of VB12 and its analogues in the large intestine can influence the compositional dynamics of the colonic microbiota. Further studies are warranted to clarify how VB12 and its analogues modulate the colonic microbial community in the context of Co supplementation. Considering that the gut microbiota can be influenced by various environmental and metabolic factors beyond VB12 or Co supplementation, the compositional changes observed in this study should be interpreted with caution, taking into account the potential contributions of cross-feeding interactions, substrate competition and other multifactorial influences within the microbial community.
In conclusion, the results suggest that when the colonic microbiota promotes succinate accumulation in response to the ingestion of large amounts of non-digestible carbohydrates such as HAMS, maintaining the colonic VB12 concentration above 74 pmol/g prevents such accumulation. Furthermore, as both VB12 and its analogues require Co as a structural component, the findings indicate that the appropriate Co supplementation to the large intestine may help stimulate the production of VB12, especially its analogues, and help establish a colonic environment in which succinate does not accumulate. Although these findings provide novel insight into Co-dependent microbial VB12 metabolism and its impact on colonic fermentation, several limitations should be acknowledged. First, this study was conducted in rats under controlled dietary conditions, and the physiological and microbial characteristics of the rat intestine differ from those of humans. In addition, the 20 % HAMS diet used here exceeds typical human intake levels of resistant starch and was employed to clearly induce succinate accumulation as an experimental model. Therefore, the quantitative aspects of the present results should not be directly extrapolated to humans. Second, changes in microbial fermentation and community structure are likely influenced by multiple factors rather than by VB12 or Co alone. Further studies are warranted to delineate these complex interactions and to verify whether similar mechanisms operate in the human colon.
Supplementary material
To view supplementary material for this article, please visit https://doi.org/10.1017/S0007114525106156
Acknowledgements
The author used Paperpal and ChatGPT to assist with improving the English grammar and readability of the manuscript. After using these tools, the content was reviewed and edited by the authors. All authors take full responsibility for the final content of the publication.
This research was supported in part by a Grant-in-Aid for Scientific Research (C) and (B) (Japan Society for the Promotion of Science; grant number 20K11576 and 24K02879, respectively) from the Japan Society for the Promotion of Science, Japan.
N.N. designed the research; C.Y. and T.U. conducted the research; C.Y., T.K., T.T and C.K. measured VB12 concentration by LC-MS/MS method; R.I., Y.K. and S.H. analysed colonic microbiota; C.Y, H.T and T.I conducted a cobalt assay in the diet and caecal contents; C.Y., T.U., C.K., S.H. and N.N. analysed the data; and N.N. wrote the manuscript and was the primary responsible for the final content. All authors were involved in designing the study, reviewing and interpreting the results and drafting the manuscript. In addition, all authors read and approved the final document.
The authors declare that there are no conflicts of interest.