Labov (Reference Labov1972b:99) discusses five subtypes of linguists by analogy to their domains of research: “the library, the bush, the closet, the laboratory, … the street.” The types of researcher described (in some cases pejoratively) are, respectively, the historical linguist, the anthropological linguist, the theoretical linguist, the psycholinguist, and the sociolinguist (Schilling-Estes, Reference Schilling-Estes, Chambers, Trudgill and Schilling-Estes2002:17). Rather than point out the deficiencies of one type in an effort to boost the merits of others, however, we should objectively consider the explanatory power of these different types and their associated frameworks.
It is the goal of this study to explore that power by investigating one specific manifestation of a common lenition process, the regular weakening of consonants in FlorentineFootnote 1 (and other Tuscan varieties of) Italian known as Gorgia Toscana (“Tuscan throat”). Florentine provides the linguist with a rich and interesting set of data on three levels. First, its lenition patterns have not been the subject of much close phonetic analysis. Previous studies either do not incorporate acoustic data at all (Bafile, Reference Bafile and AA.1997; Cravens, Reference Cravens1984, Reference Cravens2000; Izzo, Reference Izzo1972; Kirchner, Reference Kirchner1998, Reference Kirchner and Lombardi2001, Reference Kirchner, Hayes, Kirchner and Steriade2004; Nespor & Vogel, Reference Nespor and Vogel1986); do not fully describe their acoustic methods (Giannelli & Savoia, Reference Giannelli and Savoia1978); or limit acoustic analysis to either a subset of stops (Sorianello, Reference Sorianello2001, Reference Sorianello, Leoni, Cutugno, Pettorino and Savy2003a, Reference Sorianello, Solé, Recasens and Romero2003b) or a subset of pertinent acoustic characteristics (Marotta, Reference Marotta2001). Second, it exhibits a well-known, but as yet unexplained, asymmetry in the extent to which consonants within natural classes weaken—an observation evident in dialectal stereotyping and previous research (Bafile, Reference Bafile and AA.1997; Contini, Reference Contini1960; Giannelli & Savoia, Reference Giannelli1979–80; Kirchner, Reference Kirchner1998; Lepschy & Lepschy, Reference Lepschy and Lepschy1977; and others). Third, although it is a gradient process exhibiting rich variation, there are patterns observed in its history, spread, and current manifestation. If we accept that sound alterations are quantifiable, testable, and do not always pattern randomly, Gorgia Toscana is ripe for an integrated descriptive approach and an assessment of the explanatory strengths of sound-related theoretical frameworks.
This article provides a brief background of the Italian phoneme inventory and the process of Gorgia Toscana; discusses the method of collecting and analyzing speech; presents statistical analysis of lenition data; and argues for an integrated approach involving physical, perceptual, featural, and social forces acting as filters in the weakening process.
BACKGROUND
Italian phoneme inventory
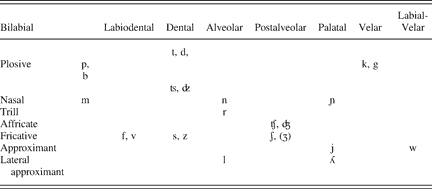
Table 1 illustrates the inventory of consonant phonemes in Italian. Fifteen of these consonants have contrastively long (geminate) correlates (Bertinetto & Loporcaro, Reference Bertinetto and Loporcaro2005:133). The exceptions are the five segments that are intrinsically long (/ɲ/, /ʎ/, /ʃ/, /ʦ/, /ʣ/); the glides /j/ and /w/; and the postalveolar voiced fricative /ʒ/, which occurs primarily in loan words. Note the empty cells in the velar column of the inventory, compared with the presence of additional phonemic segments at labial and dental places of articulation. Velar obstruent phonemes consist of only the two stops, /k/ and /g/, but labial and dental phonemes include both stops and continuants.
Italian consonant inventory
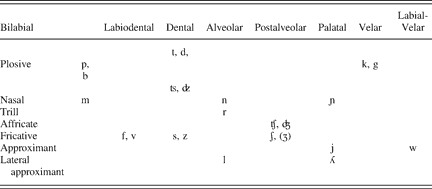
Source: Bertinetto & Loporcaro (Reference Bertinetto and Loporcaro2005:132).
Gorgia Toscana
The data examined are from a dialect of Italian spoken in the region of Tuscany that regularly exhibits Gorgia Toscana (henceforth, Gorgia Toscana or Gorgia), a sound-changing process occurring in several Tuscan dialects of Italian. Vogel (Reference Vogel, Maiden and Parry1997) describes it as the variable phenomenon responsible for the pronunciation of /p/, /t/, and /k/ as [φ], [θ], and [h/x] between sonorants, resulting in surface realizations not occurring in the Italian consonant inventory. Typical examples of Gorgia effects follow.
(1) la casa /la kaza/ → [la xaza/la haza/la aza] “the house”
(2) la torta /la tɔrta/ → [la θɔrta] “the cake”
(3) la palla /la pal:a/ → [la φal:a]“the ball”
Lepschy and Lepschy (Reference Lepschy and Lepschy1977:67) discuss Gorgia as occurring intervocalically both within and across words in continuous speech. They also note that spirantization of /k/ can extend as far as deletion. Giannelli and Savoia (Reference Giannelli and Savoia1978) present a thorough and detailed sociolinguistic description of the factors contributing to, and the continuum of surface forms resulting from, variability in the application of Gorgia. Some of these variables are age, gender, register, newness of topic, and emotion. Giannelli and Cravens (Reference Giannelli, Cravens, Maiden and Parry1997) discuss the phenomenon in the context of other weakening processes in several Italian dialects, both historical and synchronic; Bafile (Reference Bafile and AA.1997) describes Gorgia in the context of Kaye et al.'s (Reference Kaye, Lowenstamm and Vergnaud1985) phonological element theory; Nespor and Vogel (Reference Nespor and Vogel1986) use Gorgia data as evidence in support of prosodic structures; and Kirchner (Reference Kirchner1998) supports his articulatory effort model in part with reference to Florentine lenition.
Although extensive variation in the frequency and extent of lenition is attested throughout the region (Giannelli & Savoia, Reference Giannelli and Savoia1978, Reference Giannelli1979–80), the process is generally known as the intervocalic weakening of the voiceless stop consonants /p/, /t/, and /k/. Often, this weakening takes the form of fricativization to [φ], [θ], and [x], respectively, none of which occurs in the consonant inventory of Italian. More radical alterations to debuccalization and perhaps deletion (Lepschy & Lepschy, Reference Lepschy and Lepschy1977) are not uncommon.
However, Gorgia effects extend beyond voiceless stops. Giannelli and Savoia (Reference Giannelli and Savoia1978), Marotta (Reference Marotta2001, Reference Marotta, Leoni, Cutugno, Pettorino and Savy2003), and Sorianello (Reference Sorianello2001, Reference Sorianello, Leoni, Cutugno, Pettorino and Savy2003a, Reference Sorianello, Solé, Recasens and Romero2003b) all note that the voiced stops /b/, /d/, and /g/ are also involved in the process of weakening, surfacing as [β], [ð], and [ɣ] or [ɦ]. The following examples from Giannelli and Savoia (Reference Giannelli and Savoia1978:44–47) illustrate this.
(4) la gamba /la gamba/ → [la ɣ/ɦamba] “the leg”
(5) e dorme /e dɔrme/ → [e ðɔrme] “and (he/she/it) sleeps”
(6) e bevez /e beve/ → [e βeve] “and (he/she/it) drinks”
It has been claimed that spirantization of singleton stops in intervocalic position is obligatory (Kirchner, Reference Kirchner1998:253). This may be the case for some speakers, particularly given Giannelli and Savoia's (Reference Giannelli and Savoia1978:43) observation of the difficulty with which speakers pronounce these stops, but acoustic studies performed by Marotta (Reference Marotta2001, Reference Marotta, Leoni, Cutugno, Pettorino and Savy2003) and Sorianello (Reference Sorianello2001, Reference Sorianello, Leoni, Cutugno, Pettorino and Savy2003a, Reference Sorianello, Solé, Recasens and Romero2003b) show that stops do, in fact, surface among the allophonic variants. The present study supports the findings that Gorgia is far from an obligatory rule, but instead a widely distributed pattern of variation occurring optionally for a variety of speakers.
A well-known asymmetry in presence and extent of synchronic spirantization has been observed by a number of authors. Giannelli and Savoia (Reference Giannelli and Savoia1978:43) report that Florentine speakers experience the most difficulty in producing nonfricated velars, followed by decreasing levels of difficulty for the nonfricated dentals and then nonfricated labials: “It remains to be noted that when the Florentine speaker forces himself to imitate the Standard Italian pronunciation of all three of the examined consonants, in intervocalic position, he succeeds with difficulty in pronouncing [k t p], with the level of difficulty decreasing respectively.”Footnote 2 Cravens (Reference Cravens2000:9) refers to early 20th-century observations by Rohlfs (Reference Rohlfs1930) and Hall (Reference Hall1949) of “differential geolinguistic extension of spirantization, in which /k/ is affected in a wider area than /t/, which is in turn subject to spirantization over more territory than /p/). Bafile (Reference Bafile and AA.1997:28) writes: “In effect, the occurrence of less spirantized (or non-spirantized) forms becomes more frequent passing from the velar to the dental and then to the labial.”Footnote 3 Antelmi (Reference Antelmi1989:60–61) notes that “a larger quantity of carefully produced word-initial forms is observed, above all for the /k/ … because this is the characteristic most noted and stigmatized in Florentine, that speakers would like to correct.”Footnote 4 Sorianello (Reference Sorianello, Solé, Recasens and Romero2003b:3081) finds that “the velar obstruent /k/ is the primary target of the ‘gorgia,’ progressively followed by /t/ and /p/.” Historically, one sees a similar pattern of asymmetry. Izzo (Reference Izzo1972) provides diachronic evidence that velars lenited at least several generations before nonvelars did.
The present study is justified on several levels: few acoustic analyses of Gorgia Toscana data exist in the literature; the asymmetrical behavior of consonants involved has yet to be explained; previous data has generally been treated as categorical; and the variable output among subjects calls into question claims that Gorgia is obligatory.
DATA COLLECTION AND METHODS
Subjects
Data were collected from six native speakers of Florentine Italian. Of these, three were female and three male; ages ranged between 41 and 69; occupations varied among blue-collar and white-collar; and educational levels achieved ranged from the fifth grade of elementary school to a master's degree. None of the subjects has ever lived outside of Florence for more than three months. Two of the subjects claimed no foreign language ability whatsoever. Of the four subjects who did claim second language ability, none was a native speaker of any language other than Italian.
Methods
All speech data were recorded in quiet rooms familiar to the subjects using a unidirectional microphone, a USB-Pre hard-disk recorder, a Macintosh laptop computer, and Praat phonetics software (Boersma & Weenink, Reference Boersma and Weenink2006).
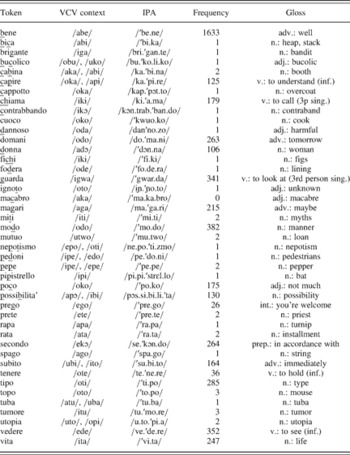
Tokens consisted of voiceless and voiced stops /p, t, k, b, d, g/ embedded between vowels in both high and low frequency lexical items and occurred either word-medially or word-initially within the prosodic domain of the intonational phrase. Lexical stress was controlled. Where possible, sentences were based on actual spontaneous speech as recorded in the AVIP (Albano-Leoni et al., Reference Albano Leoni, Bertinetto, Locchi and Refice2000) corpus to maximize the naturalness of the utterance. Appendix A supplies a list of tokens.
Subjects were informed that the researcher was studying Florentine Italian, but given no specific information as to the nature of the project or its focus on Gorgia. They were asked to read 33 sentences, in a different random order for each, repeating each sentence three times in sequence.Footnote 5
Allophonic categorization of results
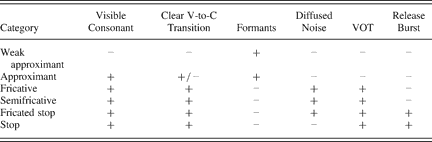
Although this study relies on the quantitative measurement and analysis of lenition that will be discussed in the analysis section, as a preliminary step, allophones of the underlying voiced and voiceless stops were placed into one of six categories based on previous experiments by Marotta (Reference Marotta2001): weak approximant, approximant, fricative, semifricative, fricated stop, and stop. This categorization allows an initial qualitative description of the data, provides a method of assessing the strength of individual lenition indicators, and enables a check on the output of the quantitative analysis to follow.
The first category, weak approximant, identifies those tokens that are unsegmentable and have no clear consonantal qualities between the preceding vowel (V1) and the following vowel (V2). In this group, as we might expect, formants remain robust throughout the vowel-consonant-vowel (VCV) sequence and no large amplitude changes occur where the consonant segment is expected to be (although there is some noticeable amplitude reduction). These accounted for 48 of the 1020 total cases, or 4.7%. Of these unsegmentables, all but four were deemed to be on the verge of categorical deletion.
The second category is approximant and tokens in this category are generally segmentable. That is, there is a clear indication of a consonantal segment between V1 and V2. Although amplitude is still relatively high, there is a greater reduction than in the case of weak approximant segments. Release bursts and voice onset time (VOT) are absent, formants are strong and vowel-like, and the waveform is greatly simplified compared to waveforms of more consonantal sounds.
Fricatives make up the third category. These tokens show turbulent, aperiodic noise throughout a range of frequencies or with a concentration of power at a specific frequency (Fujimura & Erickson, Reference Fujimura, Erickson, Hardcastle and Laver1997:75) depending on their place of articulation, but without bursts or positive VOT.
Category four consists of semifricatives. Marotta (Reference Marotta2001:45) discusses their characteristics as containing two distinct periods—the first with very low amplitude or waveform activity and a second with diffused noise resembling VOT—and no visible burst between the two. Segments in this category bear a strong resemblance to affricates in Lavoie's (2001) study of Spanish and English lenition.
The fricated stops in category five resemble canonical stops in all ways, except that their constriction period contains some diffused noise not generally associated with stop closures. They appear as leaky stops, or stops with incomplete seals, according to Lavoie (Reference Lavoie2001:128).
Finally, in category six are stops. Stops are those tokens surfacing with a period of complete closure—either total silence in the case of voiceless stops or closure with vocal fold vibration in the case of voiced stops (Fujimura & Erickson, Reference Fujimura, Erickson, Hardcastle and Laver1997:74), a visible burst, and VOT.
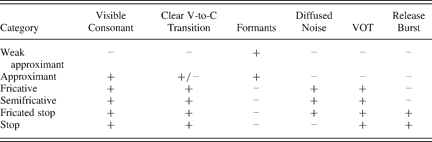
Table 2 summarizes the allophonic categories in terms of a minimal number of features evident in the waveform and/or spectrogram that are necessary to assign a given token to that category.
Feature matrix for allophonic categorization
Acoustic properties investigated
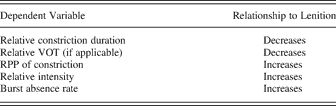
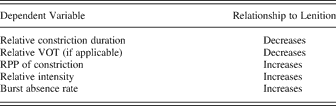
This section addresses in detail the choice of five quantitative measures, including a description of each, the manner in which measurements were performed on the data, and their relationships to weakening. Several of the methods used by Lewis (Reference Lewis2001 and personal communication) and Lavoie (Reference Lavoie2001:69–84) in their analyses of lenition were adopted for the present study. In addition to (and independently of) the quantitative analysis, each token was categorized by allophonic category using waveforms and spectrograms. The variables measured and their relationships to lenition are in Table 3.
Dependent variables as lenition indicators
Constriction and VOT durations
Constriction duration is measured in absolute terms in this experiment as the duration in milliseconds between offset of V1 and either the onset of V2 or the release burst. Because of the inter- and intraspeaker variation in terms of speech rate, absolute constriction duration does not permit comparisons across subjects or tokens (or even within subjects, given the amount of intraspeaker variation in the data). Therefore, a computed variable, relative constriction duration, is used to normalize the data and permit such comparisons. Relative constriction duration is calculated as the ratio of constriction duration to total VCV sequence duration. The same method of calculating relative VOT duration as the percent of total VCV sequence spanned by absolute VOT duration was adopted, and when added to relative constriction duration, it results in relative total duration. It must be noted that in cases where there is no release burst, VOT duration is zero.
Intensity
Because absolute intensity (the perceptual correlate of which is loudness) varies to some extent both within (speakers at times changing their distance from the microphone) and among speakers (some speakers being inherently louder than others), measurements of consonant constriction in decibels of mean absolute intensity were converted to intensity ratios. This was done by subtracting the mean intensity in decibels of the utterance from the mean intensity of the constriction period. The reason relative intensity is not calculated by subtracting mean absolute intensity of constriction from mean absolute intensity of the VCV sequence is that open vowels such as [ɑ] and [ɔ] generally have intensities 5 dB higher than [i] and [u] (Ladefoged, Reference Ladefoged2001:165). Using mean utterance intensity therefore removes the potential effect that surrounding vowels might have on relative intensity of the intervening consonant.
Mean absolute intensity of constriction and utterance were measured by incorporating the power-in-air algorithm used by Praat, which calculates the power of a given sound in air in terms of Watts per meter squared as

where x(t) is the sound pressure in Pascal units, p is the air density (approximately 1.14 kg/m3), c is the velocity of sound in air (approximately 353 m/s), and T is the duration of the sound (Boersma & Weenink, Reference Boersma and Weenink2006). The resulting power in air was then converted into decibels using the following formula:

and mean relative intensity of the phoneme (constriction period only) was calculated as

As with duration, intensity can be considered as a correlate of weakening—the higher the intensity of a sound, the more vowel-like and less consonantal it is, owing to the negative correlation between intensity and degree of constriction in the vocal tract.
Periodicity
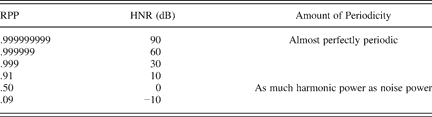
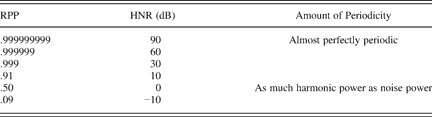
Periodicity, or degree of voicing, was calculated using the “harmonics to noise ratio” (HNR) or “harmonicity” of Boersma (Reference Boersma1993), using a cross-correlation method with time step of .01 ms and minimum pitch of 75 Hz. To avoid negative values, the HNR values were delogged and converted to relative periodicity power (RPP) as follows:

The resulting RPP values correspond with decibel values as illustrated in Table 4. An RPP value of .50 (0 dB) translates into equal amounts of periodicity and noise. RPP should not be confused with the percentage of the sound's temporal duration that is voiced. Though 50% voicing for a segment such as /k/ would entail a significant amount of surface voicing (i.e., for half of its duration, periodicity is evident), a RPP of .50 for /k/ means that it is effectively not voiced.
RPP and its correspondence to HNR in decibels
Release burst absence
In many sonority and weakening hierarchies (e.g., Clements, Reference Clements, Kingston and Beckman1990; Vennemann, Reference Vennemann1988; Zec, Reference Zec1995), one notices a clear pattern of less constriction in weaker segments. Because release bursts can only occur when complete closure is attained at some point in the vocal tract for at least 20 to 30 ms, allowing a sufficient buildup of air pressure (Shadle, Reference Shadle, Hardcastle and Laver1997:48), it follows that only those consonants with a maximal amount of oral constriction (the strongest consonants) will produce bursts. Absence of such bursts, therefore, is a major indicator of lenition.
Lenition indicators for voiceless stops
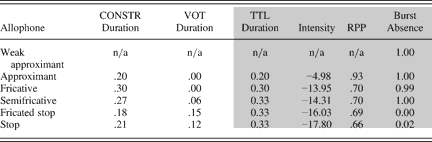
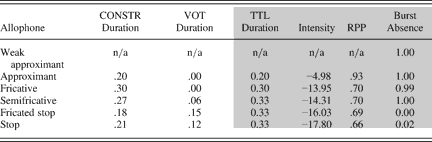
Looking at the lenition measures discussed above by allophonic category, we see that the validity of indicators differs by voicing. Measurements of dependent variables by allophone for /p/, /t/, and /k/ are given in Table 5. The shaded areas represent those variables showing a clear pattern with respect to the allophone categories on the left.
Dependent variables by allophone (voiceless stops)
Weak approximant consonants cannot be segmented; indicators are not measured.
For the class of voiceless stops, neither constriction duration nor VOT duration on its own serves to indicate weakening in a reliable way. With the exception of approximants, which by far have the shortest constriction durations, this measure increases as segments weaken, but VOT duration shows a slight tendency to decrease.
With respect to total relative duration of consonants, we see a much more consistent (and expected) behavior pattern. Although there is no significant difference in duration among the three strongest allophones, weaker variants are progressively shorter.
Relative intensity of voiceless stop allophones also meets expectations. There is a minimal contrast in the intensity of fricatives and semifricatives (probably due to the very infrequent occurrence [N = 23] of the latter, and the fact that these two allophones are minimally different in terms of their acoustic characteristics). Generally, however, segments increase in intensity as they weaken.
There is also a consistent, if slight, relationship between weaker allophones and higher RPP. Although the three variants exhibiting frication (fricatives, semifricatives, and fricated stops) do not exhibit significant variation in RPP, there is an obvious trend for weaker segments to increase in periodicity-to-noise ratio.
Because release burst absence is one of the factors used in classifying tokens into allophone categories, it is no surprise that weaker segments have burst absence rates of 1 (or close to 1), and stronger segments have burst absence rates of zero. Because burst absence can be judged with objectivity based on spectrogram analysis, however, the circularity of burst patterns by allophone does not necessarily demand that this variable be treated as an unreliable predictor of lenition. In fact, it appears to be one of the most reliable.
To sum up then, there are four dependent variables that reflect, albeit to different degrees and with differing robustness, the surface manifestation of voiceless stops. They are total relative duration, relative intensity, RPP, and burst absence.
Lenition indicators for voiced stops
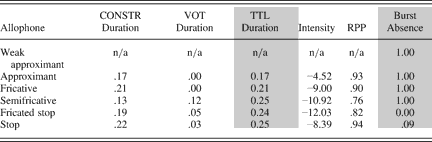
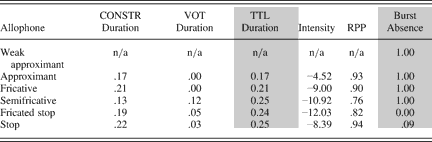
Table 6 summarizes the dependent variable measurements for {/b/, /d/, /g/}, as detailed in the allophonic categorization section. Again, the shaded areas indicate those dependents that pattern with allophones in a consistent, directional manner.
Dependent variables by allophone (voiced stops)
Weak approximant consonants cannot be segmented; indicators are not measured.
As with the set of voiceless stops, relative constriction and VOT durations on their own do not reliably predict the strength of surface variants. Total relative duration is a much better indicator of strength or weakness, although it does not serve to contrast the three strong categories of semifricatives, fricated stops, and stops (however, N is particularly low for voiced segments surfacing as semifricatives (3) and as fricated stops (30)). Its predictive power is limited to contrasts between approximants, fricatives, and the stronger categories.
The real difference between voiceless and voiced segments lies in the failure of relative intensity and RPP to predict weakening in the latter set. As Table 6 illustrates, both intensity and RPP are greater for stops than for any other category except approximants. If either of these variables were incorporated into the assessment of weakening, the spurious conclusion that stops were somehow weaker than fricatives would result (or, more likely, the trends indicated by these measurements would conflict with those indicated by duration and burst absence, resulting in statistically insignificant outcomes).
Release burst absence rate is subject to both the criticism and justification mentioned above, with respect to its correlation with weaker categories, but in light of the lack of other reliable lenition indicators for the set of voiced stops it must be retained.
The only two dependent variables, then, having some amount of predictive strength for allophonic variation are total relative duration and release burst absence rates.
ANALYSIS
Lenition as a latent variable
This study measured the four acoustic features of duration, intensity, periodicity, and burst absence for each token under investigation, basing the choices of acoustic features primarily on those adopted by Lewis (Reference Lewis2001) and Lavoie (Reference Lavoie2001). The present goal, however, is not to discover the exact phonetic ingredients of consonant lenition, but rather to test a number of hypotheses using lenition as the dependent variable. To carry out this goal, a quantitative construct of lenition is required—a hypothetical latent variable, but one that is well-grounded in observable reality.
Latent variables versus observable variables
Latent variables are employed with exceptionally high frequency in various subfields of the social sciences. Consider the concepts of economic strength, intelligence, familial happiness, or second language proficiency—all are often discussed both in academic literature and everyday conversation. Although one can discuss such concepts easily, the matter of defining them is quite difficult. What does it mean for a country to have a strong economy? What does it mean for a student of Spanish to be proficient?
Now consider another class of items—interest rates, math test scores, how often a family dines together, vocabulary size. The crucial difference between this set and the group of concepts just mentioned is that items such as rates, scores, time, and size can be directly observed and measured, but the concepts in the previous paragraph cannot. It is this difference that is fundamental to the concept of latent variables.
The difference in measurability between latent and observable variables entails a further generalization. Latent variables are typically smaller sets of variables that underlie those variables that are actually measured (Leech et al., Reference Leech, Barrett and Morgan2005:76). The many statistical methods used in detecting latent variables, therefore, are chiefly concerned with “whether the covariances or correlations between a set of observed variables can be explained in terms of a smaller number of unobservable constructs” (Landau & Everitt, Reference Landau and Everitt2003:284). Stated in simpler terms, these methods have efficiency as their goal. We can measure several different variables and test our hypotheses using each of them, but it is much simpler to reduce these several variables to a group of one or two, and subsequently run our tests on the resulting smaller set. This parsimony is one of the benefits of data reduction.
Principal components analysis as a data reduction method
Leech et al. (Reference Leech, Barrett and Morgan2005:76) present the end goal of principal components analysis (PCA) as the mathematical derivation of a “relatively small number of variables” from the variables that were actually measured. Landau and Everitt (Reference Landau and Everitt2003:282) describe PCA as “essentially a method of data reduction that aims to produce a small number of derived variables that can be used in place of the larger number of original variables to simplify subsequent analysis of the data.” Accordingly, the outputs of PCA (the principal components themselves) are combinations of the original variables that serve one primary purpose—to account for as much variation in the original data as possible.
A few important conditions and assumptions must be met if PCA is to be used appropriately. The conditions are that (a) a relationship (correlation) exists among the original variables and (b) the sample size must be relatively large in relation to the number of original variables (Landau & Everitt, Reference Landau and Everitt2003; Leech et al., Reference Leech, Barrett and Morgan2005). Three assumptions, which are tested in the process of running PCA, ensure that these conditions are met.Footnote 6
The software then searches through the tested data to find a new variable, called a component or factor, that accounts for as much variability as possible and assigns a value to this first component. The resulting value tells us how much of the variability is accounted for by this first component and is called the eigenvalue of the component.
After a first component is extracted and assigned an eigenvalue, SPSS software searches for additional components (factors) that are not correlated with the first (or any others), thus providing a control for overlap in the original variables. Eigenvalues are assigned to each of the subsequent components, and there will be as many components as there are original tests (variables). Note that a characteristic of PCA is that the cumulative percentage of variance explained by all components will always equal 100%. The most important piece of information in this output is the eigenvalue assigned to each factor, as this value is used to quantify the explained variance. Eigenvalues greater than 1.0 indicate that a factor, which is a latent variable, explains more variance than a single original variable explains (Leech et al., Reference Leech, Barrett and Morgan2005:82). Kaiser (Reference Kaiser1960) proposes the use of eigenvalues over 1.0 as a criterion for deciding which component(s) to keep.
PCA of lenition indicators—Method and results
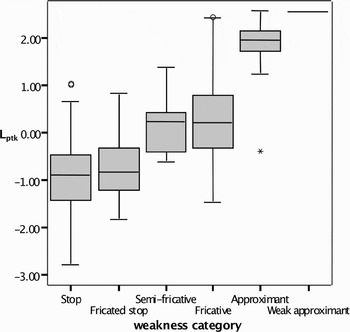
Using SPSS software, PCA was run on the subset of voiceless stops {/p/, /t/, /k/} and on the subset {/b/, /d/, /g/} using the input variables that were shown to have a relationship to weakening in these groups (see Tables 5 and 6 above). All of the assumptions pass the suitability tests required by PCA. For each set, only one component with an eigenvalue over 1.0 was returned, and this component was extracted, defined as a new (standardized) variable, and renamed L ptk or L bdg.Footnote 7 Higher latent variable scores indicate more weakening for the both the /ptk/ and /bdg/ groups. The range of L ptk scores is −2.79 to 2.55 and the range of L bdg scores is −2.99 to 1.87.
One manual adjustment to the scores was made. Of the 637 voiceless and 358 voiced tokens, 28 and 18, respectively, were unmeasurable in terms of duration, intensity, and RPP. Because it was impossible to assign observed variable scores to the individual tokens, SPSS could not calculate latent variable scores for them. They were therefore adjusted by hand, using the conservative approach of assigning each token a L ptk score or L bdg score equal to the maximum score for the entire set of either voiceless or voiced stops (i.e., 2.55 or 1.87).
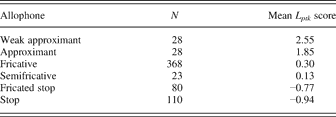
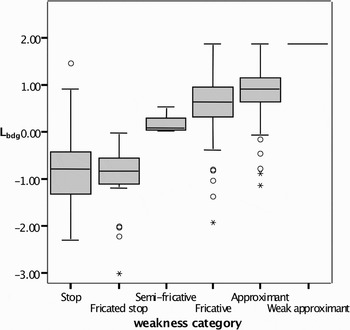
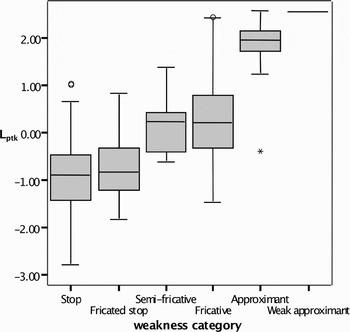
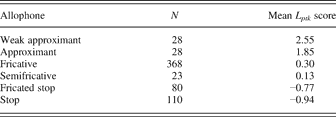
L ptk component score means for the six allophone categories are in Table 7. A box plot of these means is shown in Figure 1.
Box plot of Lptk scores by allophone.
Mean Lptkscores by allophone
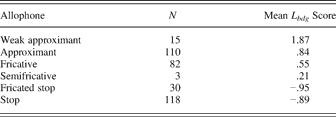
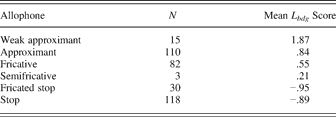
Descriptives run using the L bdg component scores as dependent variables and allophone categories as independent variables are in Table 8. A box plot of these means is shown in Figure 2.
Box plot of Lbdg scores by allophone.

Mean Lbdgscores by allophone
To simplify further statistical testing, the L scores for voiceless and voiced segments, although computed separately due to differences in the underlying variables, were aggregated into one common L score. Because statistical computation of latent variables results in standardized scores (Z scores), which measure distance from the mean, combining the scores does not sacrifice accuracy.
Statistical analysis of effects
Everything lenites, but not all the time
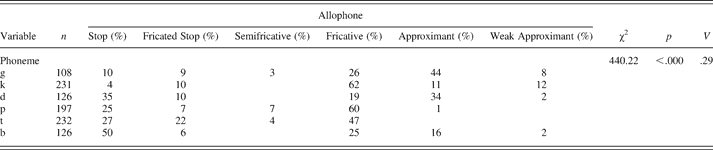
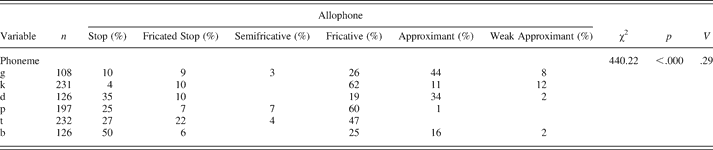
Table 9 shows the percentages of each surface manifestation occurring by individual phoneme.
Realizations of singleton stops by phoneme (percentages)
Percentages may not add to 100 due to rounding.
Pearson chi-square tests indicate a significant difference among the phonemes in terms of their allophonic realization. The data in the Table 9 show that the voiced labial /b/ and voiceless dental /t/ are least likely to lenite and that most lenition occurs with the velars /g/ and /k/. The phoneme most often occurring as a stop is /b/, as fricatives are /p/ and /k/, as approximants are /d/ and /g/, and as weak approximant segments are /g/ and /k/. Cramer's V, which indicates the strength of the relationship between phoneme and allophonic category, is .29, so the effect size can be considered as medium according to Cohen (Reference Cohen1988).
Two interesting observations surface in this analysis. Of the 1020 stops in this study, 637, or 63%, surface as fricatives, approximants, or weak approximant segments. These numbers attest to overwhelming pervasiveness of lenition in the fluent speech of these Florentine subjects. That said, the fact that 239, or 23%, surface as full stops serves as a robust counterargument to any claim that spirantization is obligatory in intervocalic position, as formerly attested by Giannelli and Savoia (Reference Giannelli and Savoia1978) and Kirchner (Reference Kirchner1998).Footnote 8 Furthermore, despite a possible general tendency to regard Gorgia Toscana as a process affecting only voiceless stops—possibly rooted in the previous observations by Giannelli and Savoia (Reference Giannelli and Savoia1978), Lepschy and Lepschy (Reference Lepschy and Lepschy1977), Marotta (Reference Marotta2001), and others that the voiceless group is the primary target—it is clearly not the case that voiced stops resist lenition, as Table 10 illustrates.
Realizations of singleton stops by voicing (percentages)

The results of chi-square tests are significant, and the size of the relationship between voicing and allophonic variation is slightly larger than normal, given Cramer's V = .45. Voiced stops are much more likely to surface as stops than their voiceless counterparts, and voiceless fricatives are a considerably more common realization than voiced fricatives. Approximantization, however, is significantly more likely to occur when the underlying phoneme is voiced: 31% of the voiced stops surface as approximants, but only 4% of the voiceless stops exhibit this manifestation.
Place of articulation matters
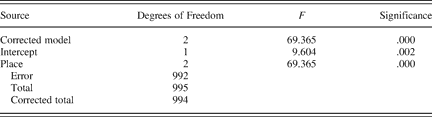
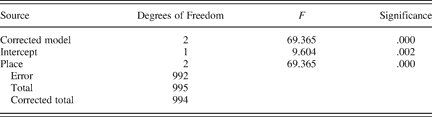
Mean L scores for labials are −.223, for dentals −.113, and .638 for velars. Testing for place of articulation effects both voiceless and voiced stops; a statistically significant difference in L is found among the three places of articulation (labial, dental, and velar), F(2, 992) = 69.365, p = .000. The analysis of variance (ANOVA) of L scores by place of articulation is in Table 11.
ANOVA: Dependent variable equals place of articulation
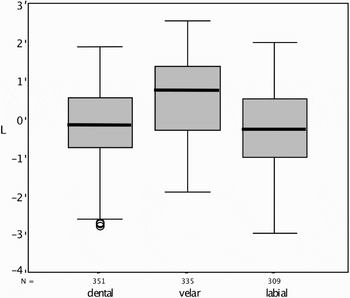
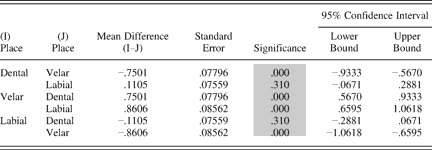
Games-Howell post hoc tests in Table 12 show significant mean differences in L between the velar group and both the labial (p = .000) and the dental (p = .000) groups, but not between the labial and dental groups (p = .310). The box plot in Figure 3 also illustrates a lack of hierarchical place-of-articulation effects throughout the natural class of oral stop consonants.
Box plot of L scores by place of articulation.

Post hoc: Independent variable equals place of articulation (Games-Howell)
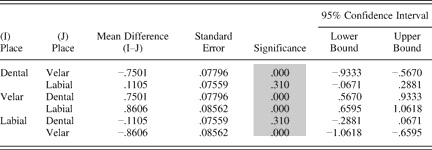
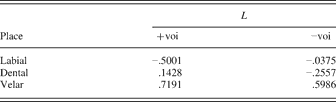
This quantitative assessment of place effects on Gorgia Toscana contradicts the attested asymmetry reported by Bafile (Reference Bafile and AA.1997:28), Giannelli and Savoia (Reference Giannelli and Savoia1978:43), Marotta (Reference Marotta2001:31), and Sorianello (Reference Sorianello2001:82). Each of these authors has claimed a significant three-point hierarchy, where velars lenite more than dentals, which in turn lenite more than labials.Footnote 9 Such a hierarchy is found in the subset of voiced stops /b/, /d/, and /g/, but not in the voiceless subset, where the hierarchy appears to be velar > labial > dental. Quantitative analysis using the mean L scores for voiced and voiceless subsets (see Table 13) supports this finding, and ANOVAs run on these subsets show significant place effects: F(2, 355) = 49.015, p = .000 for voiced segments; F(2, 634) = 40.350, p = .000 for voiceless segments. Post hoc tests indicate that the voiced segments /b/, /d/, and /g/ differ significantly from one another (p = .000), as do the voiceless segments /p/, /t/, and /k/ (although p = .038 for the /p/-/t/ pair).
Mean L scores by place of articulation (by underlying voicing)
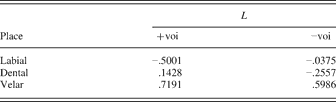
These statistics confirm the hypothesis that velars will lenite more than labials or dentals, but refute claims regarding other places of articulation.
Lenition is gradient—sometimes
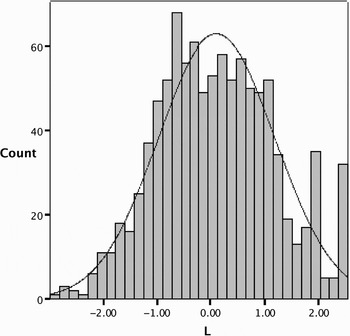
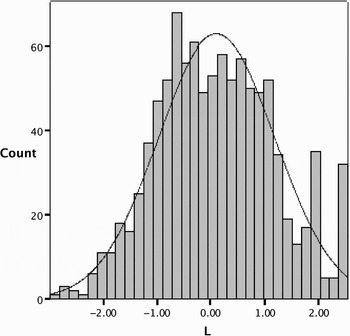
Examining the range of L scores graphically, we see that the distribution is approximately normal (with the exception of some spikes at the extreme right, which are explainable L scores fall at all points along a continuum. That is, they do not cluster into discrete categories, as shown in Figure 4.
Histogram of L scores with normal curve.
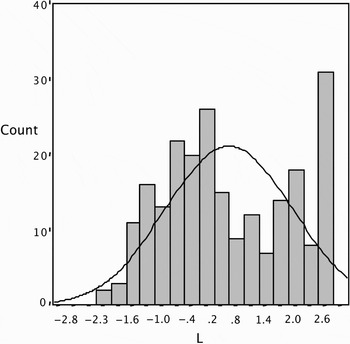
Another histogram, however in Figure 5, indicates a bimodal distribution of L scores for /k/, as evidenced by the jump in frequency of weak approximants (and possibly deleted segments) at the extreme right edge.
Histogram of L scores for phoneme /k/.

Not all subjects lenite the same way
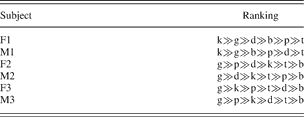
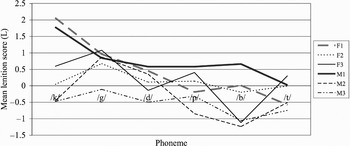
Despite the general tendency of velars to exhibit greater lenition than nonvelars, much variability is found among subjects with respect to place of articulation. Table 14 and Figure 6 illustrate that only two of the subjects, F1 and M1, show higher lenition of /k/ than of any other segment. The other four subjects show a preference for leniting /g/, and three of these rank /k/ no higher than third. An additional pattern emerges, however, in which F1 and M1 appear both extremely similar to one another and markedly different from the other subjects in terms of their lenition hierarchies. This pattern is of interest when we consider the six subjects' general educational levels, social status in terms of employment experience, and exposure to non-Florentine culture and language. These details indicate a potentially different social profile for F1 and M1 than for the other four subjects, which will be discussed further.
Subject lenition rankings (by phoneme)
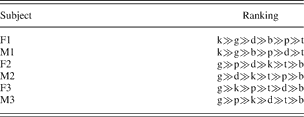
Although place of articulation effects appear generally robust, the facts illustrated in Figure 6 and the unique subject characteristics of F1 and M1 should not be ignored and are discussed further in the functional approaches section.
Intersubject variation in phoneme lenition.

The preceding analysis illustrates the regular occurrence of lenition throughout the entire class of stops in the Italian consonant inventory, the overall gradient nature of lenition, the special status of velars in the lenition process, and the presence of intersubject variation in preference toward velar lenition. The following section discusses Gorgia Toscana in light of these observations.
DISCUSSION
Based on the patterns that emerge through quantitative analysis of stop weakening in this dialect, the diachronic observations, and the social circumstances of speakers in the Florentine linguistic community, Gorgia Toscana can and should be viewed as a sound-change process that involves a mixture of physiological, conceptual, and social motivations. This explanation of Florentine lenition draws on phonetically based theories of coarticulation and perception, phonological theories of symmetry and contrast preservation, and social theories of linguistic change and variation. The interaction of various intrinsic and extrinsic linguistic forces is posited to address the patterns emerging in this study's data. Gorgia Toscana has not heretofore been analyzed under this type of integrated approach.
Gradience and variation in Gorgia Toscana
Although previous studies (Marotta, Reference Marotta2001; Sorianello, Reference Sorianello2001) suggest that Gorgia Toscana results in numerous surface realizations of the underlying consonants involved in the process, the present study indicates a true gradience in the output. However useful it may be to discuss lenition in terms of categorical alterations derived from underlying segments, the acoustic data herein show that changes resulting from lenition lie at all points along a continuum of weakening. This observation has implications for the methods used in measuring sound change and for the descriptive and explanatory power of frameworks incorporated in any account of the data. On the one hand, it appears that lenition can assume infinite forms through minor fluctuations in articulatory motions (corresponding with minor fluctuations in a number of acoustic dimensions). On the other hand, our ability to capture and measure this gradience makes a formal analysis difficult. The dilemma is between focusing on the actual gradience and abstracting away from it by reference to categories in order to explain a process as simply as possible and to formulate learnable, grounded constraints.
Some patterns are found in the current study's data, but in general the data suggest the process of lenition in Florentine is highly variable—both among and within speakers. Not only are inputs associated with a possibly infinite number of surface forms, but also the choice of these forms is not consistent. The degree of lenition varies. /k/ appears prone to categorical extreme weakening, but only some of the time; all segments surface as complete stops at some times and as fricatives or approximants at others. Despite several decades of observations that /k/ is most prone to lenition, /k/ weakening appears to be suppressed by certain subjects and possibly exaggerated by others.
The data analyzed in this study suggest five questions concerning lenition in Florentine Italian:
1. Why might both voiced and voiceless velars exhibit special status?
2. How can we account for gradience in the surface manifestations?
3. Why did nonvelars become (and why do they continue to be) susceptible?
4. Why does the /k/ show a tendency toward categorical extreme weakening?
5. How can we explain intersubject variation, particularly with reference to the preference or dispreference of velars?
Production-related approaches to lenition and Gorgia Toscana
We might view Gorgia Toscana as a physiological coarticulation of consonants and vowels rather than a categorical process that simply alters the continuance feature of a consonant. This purely articulatory theory claims that articulator motions will differ along dimensions of space and time, depending on motions of neighboring articulators (Browman & Goldstein, Reference Browman, Goldstein, Kingston and Beckman1990, Reference Browman and Goldstein1992).
In the cases of /aka/ and /aga/ sequences, the same tract variable (an articulatory entity, in this case the tongue body) is specified by the gestures involved in producing each segment of the VCV sequence where the consonant is a velar. This is not the case for VCV sequences involving labials and dentals. The consonants in those sequences involve a different tract variable than do the vowels. Only in the cases where the intervocalic consonant is a velar does the tongue body (TB), a very slow articulator due to its mass, have to achieve three sequential constriction/location targets if the /aka/ or /aga/ sequence is to result in a surface pronunciation of [aka] or [aga].
Browman and Goldstein (Reference Browman and Goldstein1992:165) argue that this target achievement is not possible:
In the case where consonants and vowels share the same (TB) tract variables (e.g., the consonant [g] as in [aga] or [igi]), the consonant and vowel gestures cannot both simultaneously achieve their targets, since they are attempting to move exactly the same structures to different positions.
The result, then, is that the consonant gesture will vary in its constriction location, achieving a target somewhere between its original target and that of the surrounding vowels. Browman and Goldstein note specifically that only the location of constriction will be affected, not the degree of constriction (1992:165), which on the surface poses a problem for a gestural analysis of lenition, because it is the latter that appears to be at play in the weakening of stops (Lavoie, Reference Lavoie2001). This apparent contradiction is easily resolved, however. Browman and Goldstein also claim that “in faster, casual speech, we expect gestures to show decreased magnitudes (in both space and time) and to show increasing temporal overlap […] weakenings are consequences of these two kinds of variation in the gestural score” (1990:17). Furthermore, they note Brown's (Reference Brown1977) observation that “a typical example of magnitude reduction might be the pronunciation of the medial (velar) consonant in ‘cookie’ as a fricative rather than as a stop” (1992:173).
Browman and Goldstein do in fact recognize that magnitude of constriction, not just its location, may be affected by surrounding articulations. Therefore, even though the articulation of velar consonants in VCV sequences may include a location shift, it is also likely to include a reduction in magnitude. Such a reduction would manifest itself as the difference between velar closure being achieved and velar closure being attempted, but not achieved.
An additional advantage of articulatory phonology with respect to the lenition process of Gorgia Toscana is its ability to account for gradient output. Because duration and magnitude are measured on continuous scales, any and all values for these two variables should be predictable outcomes of lenition. As the previous sections attest, the surface manifestations of weakening in Florentine Italian are generally noncategorical. L assumes analoglike values.
There is other direct evidence supporting a phonetic aspect of Gorgia that targets velars preferentially. Articulations involving closure at a location farther back in the oral cavity necessarily reduce the available volume for air exiting the lungs and therefore increase intraoral pressure, as is well documented in treatments of place-of-articulation effects on voicing such as the aerodynamic voicing constraint, or AVC (Ohala, Reference Ohala1997:92). Stevens (Reference Stevens, Hardcastle and Laver1997:492) asserts “the force from this [increased intraoral] pressure causes the walls of the vocal tract and of the glottis to displace outwards.” However, why should higher air pressure have an effect only on lateral displacement of the oral and glottal walls? In other words, any pressure sufficiently high to result in a structural change of the vocal tract might also be high enough to result in leakage through the stop closure, particularly when, as in the case of velars, the pressure is multiplied by a reduced amount of surface area behind the closure that is able to accommodate the higher pressure (Ohala, Reference Ohala1997:93).
In light of the articulatory phonology model and aerodynamic principles involved in consonant production, complete closure of velar stops is dually impeded in a way that labial and dental stop closure is not. First, the TB gestures necessary for velar stops face a physical hurdle in reaching their closure targets due to their increased mass and their shared tract variable set with that of the surrounding vowels. Second, velars allow the greatest buildup of air pressure and the most reduced outlet for accommodating this pressure among the three places of articulation under discussion. Other things being equal, these aerodynamic principles suggest that velars may be more prone to leakage than other stops. Either of these arguments might substantiate a physiologically motivated aspect of Gorgia that targets velars; the argument is bolstered when they are considered together. The higher intraoral pressure built up behind a velar closureFootnote 10 will combine with the reduction in TB constriction predicted by the articulatory phonology model, resulting in an even greater tendency toward leakage and, hence, lenition.
We encounter three problems in attempting to explain Gorgia wholly in a phonetic framework. A purely articulator-based explanation to the synchronic observations of the process cannot account for nonvelar lenition, categorical behavior of velars, or variable degree of velar lenition among subjects.
First, within a model such as Browman and Goldstein's articulatory phonology, there is no strong motivation for the physiologically motivated weakening of nonvelars, as natural classes play no role. Weakening is a result of identical gestures being required in a period too short to allow them to reach their goals, and the gestures involved in labial and dental articulations are not identical to those involved in vowel articulations. Nonetheless, the data in the present study confirms the lenition of nonvelars.
Second, a physiological model cannot account for the categorical extreme weakening of the voiceless velar stop. Articulatory phonology does not predict a distribution where two forms of reduction (fricativization and weak approximantization or deletion, for example) occur more frequently than a form of reduction lying at an intermediate stage between them (such as approximantization). As a theory of gradual reduction in duration and magnitude, Browman and Goldstein's model predicts that intermediate stages of reduction will consistently lie between two extremes with respect to frequency of occurrence, so that normal and linear distributions are expected, but bimodal distributions are not.
Third, a purely articulatory model is challenged by the observation that some subjects exhibit an aversion to leniting /k/—historically and synchronically the favored segment in the process of Gorgia Toscana. Referring only to physiological factors, articulatory phonology predicts that velars should always lenite, allowing no room for the suppression of these segments' weakening or for the higher frequency of lenited nonvelars in any individual subject's speech.
Kirchner (Reference Kirchner1998) notes one further limit of the articulatory approach. Being a theory of gestural reduction and not gestural change, articulatory phonology in its strongest form has little to say about the replacement of a TB gesture by a glottal gesture in debuccalization (unless the glottal gesture exists and the TB gesture is simply reduced completely). Given previous accounts of /k/ leniting to [h] (Giannelli & Savoia, Reference Giannelli and Savoia1978), a gesture-based model fails to account for the data. (There is, however, another possibility. As no articulatory studies of Gorgia Toscana exist, it is presently impossible to say whether debuccalization actually occurs. The fact that previous studies have used [h] to represent a radically lenited allophone of /k/ does not necessarily mean that /k/ debuccalizes.)
Consider whether one could explain all lenition in Gorgia Toscana in a production-related framework other than articulatory phonology. Other theories simply do not account as elegantly for the data in this study. If we posit phonetic constraints without reference to specific articulators, they become too general (and somewhat less phonetic). Overall reduction in effort (Kirchner, Reference Kirchner1998), reduction of constriction (Trask, Reference Trask1996), or increase in sonority would predict similar, consistent behavior of all consonants in all contexts, not simply those where articulators are identical. We would then see unmanifested Gorgia effects such as all consonants leniting to the same extent or consonants leniting in non-VCV contexts. This is not what we observe, either diachronically or synchronically. Articulatory phonology requires a feature-based framework to generalize its effects, but this is a more appealing position to be in than positing a general constraint on production and subsequently requiring the phonology to make that constraint more specific by referring to fine differences among articulators.
We might also ask whether a phonetic constraint that refers to specific articulators not in terms of their impact on constriction degree and duration, but only in terms of their influence on the degree of voicing (Ohala, Reference Ohala1997) might be applicable to Gorgia Toscana. Ohala argues that the degree of airflow necessary to maintain vocal cord vibration decreases as supralaryngeal volume decreases (i.e., voicing is facilitated by forward places of articulation and inhibited by back places of articulation). This type of constraint would certainly account for a different behavior of consonants in lenition processes (because increased voicing is a correlate of lenition in the present study). Again, however, we would see unmanifested patterns if only voicing constraints were considered. For example, /p/ would be most likely to lenite among the set of voiceless stops, and /g/ would be the least likely to lenite among the voiced stops. Phonetic constraints on voicing fail to explain, on their own, the behavior of consonants where lenition is not only a manifestation of increased voicing, but a manifestation of decreased constriction and duration. Hence, they would require a substantial amount of stipulative repair to account for the patterns observed in this study.
There is likely no phonetic explanation for all of the questions arising from the data in this study. Despite its shortcomings, however, a theory involving direct reference to articulator movements in space and time can account for two aspects of Gorgia Toscana in a straightforward way: the greater susceptibility of velars to the weakening process and the gradient nature of lenition.
At least one further piece of support exists for a physiological motivation behind Gorgia Toscana. Janda and Joseph (Reference Janda, Joseph, Blake and Burridge2003) provide cross-linguistic empirical evidence supporting Ohala's concept of phonetic conditioning as a necessary factor in the innovation phase of sound change. They argue that “sound change originates in a very ‘small,’ highly localized context over a relatively short temporal span” and that “purely phonetic conditions govern an innovation at this necessarily somewhat brief and limited point of origin” (Janda & Joseph, Reference Janda, Joseph, Blake and Burridge2003:206). Subsequent changes, such as the spreading of the original phonetically motivated innovation, may arise from nonphonetic generalizations (phonological, morphological, lexical, or social), but phonetic factors are solely responsible for the innovation (Janda & Joseph, Reference Janda, Joseph, Blake and Burridge2003).
The detailed historical work of Izzo (Reference Izzo1972) provides credible evidence that velar consonants were, for a period of approximately 250 years, the only consonants observed to undergo lenition in the Tuscan dialects. If velar lenition began at some point during the early history of Italian,Footnote 11 then velar lenition, as an innovation, would necessarily be phonetically motivated according to Janda and Joseph's model. To the extent that such a model will be viable under further investigation of empirical sound-change data, and to the extent that historical records accurately represent early lenition of velars (and only velars), the innovation of velar lenition in, or prior to, the 14th century provides indirect evidence of velar lenition as phonetically motivated.
Perceptual approaches to lenition and Gorgia Toscana
In addition to being favored by production constraints, velar lenition is also favored by constraints on maintenance of perceptual contrast. Recall the Italian phoneme chart in Table 1 illustrating gaps in the inventory: specifically, the existence of labial and alveolar continuants and the absence of velar continuants.
The existence of labiodental fricatives /f/ and /v/ can be seen as a perceptual obstacle for lenition of both bilabial and dental stops. Maddieson notes that the acoustic difference between bilabial and labiodental fricatives is subtle, even to trained phoneticians, and the number of languages having a contrast between /f/ and /φ/ is likely to be approximately 3% (Reference Maddieson2005:199) and also rather small for /b/ and /β/. With respect to acoustic differences between labiodental and dental fricatives /f, v/ and /θ, ð/, Jongman et al. (Reference Jongman, Wang and Kim2003:1) note that “most research on fricatives has not been able to identify consistent acoustic characteristics that may serve to distinguish [them].” They cite previous studies that find /f/ and /θ/ and /v/ and /ð/ are most easily confused among fricatives (Balise & Diehl, Reference Balise and Diehl1994) and that their distinction may be based on nonacoustic (e.g., visual) information (Miller & Nicely, Reference Miller and Nicely1955). The perceptual contrast between bilabial and labiodental fricatives may pose a greater challenge, given the infrequent occurrence of each of these in phoneme inventories—about 5% each (Maddieson, Reference Maddieson1984), yielding only a .25% probability of co-occurrence—although such small percentages in a sample of 317 languages offer limited evidentiary support in the absence of instrumental testing.
There are no existing velar fricatives in the Italian phoneme inventory, however—nor are there uvular, pharyngeal, or glottal fricatives. Although minimization of perceptual confusion (Boersma, Reference Boersma1998) and avoidance of weakly perceptible contrasts (Hume & Johnson, Reference Hume, Johnson, Hume and Johnson2001) can be seen as constraints against labial and dental lenition, no such constraint is applicable to velars in Italian. Velars are free to depart from a complete stop articulation without wreaking perceptual havoc, and their weakening is also freer to phonologize without resulting in a phonological system that includes “contrastive” entities that are in actuality difficult to contrast.
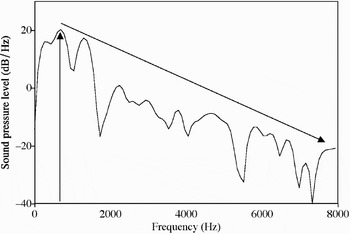
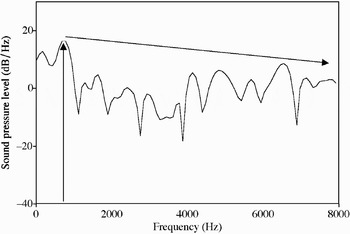
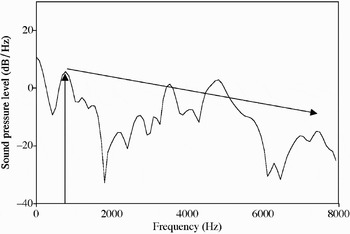
We might also ask whether perceptual information regarding a three-way (labial-dental-velar) place of articulation contrast is substantially degraded by lenition of any of the consonants in question. The answer is very likely no. Although Harris and Urua (Reference Harris and Urua2001:73–74) point out that “consonantal lenition degrades information in the speech signal” and spirantization, in particular “suppresses the sustained interval of radically reduced amplitude associated with stop closure,” it does not appear to be the case that place of articulation cues are lost as a result of lenition. Stevens and Blumstein (Reference Stevens and Blumstein1978) found that stop consonants were identified more consistently based on their transitions only (and although bursts added information, they alone did not contribute to correct place identification. Analysis of the spectra of lenited /p/, /t/, and /k/ (to /φ/, /θ/, and /x/, respectively) in /aCa/ environments uttered by a male speaker (M1) in this study indicate strong dissimilarities among the consonants, as Figures 7, 8, and 9 illustrate. Note the characteristics of each consonant in terms of peak amplitude (highest for /φ/, lowest for /x/) and spectral roll-off versus evenly distributed amplitude (greatest roll-off for /φ/, most even distribution for /θ/). Assuming the availability of such acoustic cues throughout the duration of the fricatives, it is unlikely that fricativization would result in degraded place of articulation contrasts among the three consonants in question.
Spectrum of [φ] in “rapa” (subject M1, repetition 1).

Spectrum of [θ] in “rata” (subject M1, repetition 1).

Spectrum of [x] in “macabro” (subject M1, repetition 1).

We see that perception can account for place of articulation asymmetries in Gorgia Toscana in two ways. On the one hand, a constraint against perceptual confusion, given the existing phoneme inventory, likely inhibits lenition of nonvelar consonants. On the other hand, the availability of salient place of articulation cues in the speech signal of fricatives means that lenited stops retain a three-way contrast with respect to each other, such that velar lenition does not result in perceptual confusion with nonvelars with respect to place of articulation.
Perception on its own, however, cannot account for other patterns that emerge from the present study's data, particularly the gradient characteristic of Gorgia Toscana, the generalization of weakening to a natural class, and the intersubject variation in preference for /k/ lenition.
Featural approaches to lenition and Gorgia Toscana
A featural approach to Florentine weakening offers some of the explanatory power that is missing from production- and perception-oriented frameworks. First, it captures the natural classes of stops without regard to place of articulation. Second, it allows for the categorical behavior of underlying segments. It does not, without physiological, perceptual, and social stipulations, account for the varied weakening of consonants within a class or for intersubject variation.
There is historical evidence (Izzo, Reference Izzo1972) that the nonvelar stops /p/, /b/, /t/, and /d/, all of which were present in early Italian's phonemic inventory, began leniting at least several generations after velar lenition was first observed. From the articulatory discussion above, lenition of these nonvelars is less likely to be physiologically motivated than velar lenition. From the perceptual discussion, nonvelar lenition is also more likely to be constrained than velar lenition is. Spread of lenition to nonvelars did occur, however, and continues to occur in Florentine Italian. The first question in this section is why such a spread should have occurred. Why should phonetically motivated lenition of velars have propagated throughout the natural class of oral stops? The answer may be related to nonarticulatory motivations: symmetry (Hayes, Reference Hayes, Darnell, Moravscik, Noonan, Newmeyer and Wheatly1999), phonologization (Hyman, Reference Hyman and Juilland1977) and exaggeration (Janda, Reference Janda, Joseph and Janda2003; Janda & Joseph, Reference Janda, Joseph, Blake and Burridge2003). All of these concepts share a common theme. Sound changes that begin as purely phonetic may become less so over time and ultimately occur in the absence of the original conditioning environment.
Hayes (Reference Hayes, Darnell, Moravscik, Noonan, Newmeyer and Wheatly1999) argues that purely phonetic constraints, though explanatorily powerful and influential to the phonology, are too complex to account for the actual patterns observed in languages:
… constraints are typically natural, in that the set of cases they ban is phonetically harder than the complement set. But the “boundary lines” that divide the prohibited cases from the legal ones are characteristically statable in rather simple terms, with a small logical conjunction of feature predicates. In other words, phonological constraints tend to ban phonetic difficulty in simple, formally symmetrical ways (Hayes, Reference Hayes, Darnell, Moravscik, Noonan, Newmeyer and Wheatly1999:253–254).
He illustrates this preference for simpler, feature-based constraints over direct physiological motivations by comparing allowable segments in Japanese and Arabic. He discusses two phonetic realities with respect to voicing difficulties—both voiced obstruent geminates and voiceless labial stops are physiologically difficult (see also Ohala, Reference Ohala and Jones1993 for an explanation of the aerodynamic principles involved in assessments of difficulty). Japanese allows [pp] and bans [bb], and in Arabic the preference is exactly the opposite. If one outcome were (universally) phonetically more difficult than the other, and the phonology of a language mapped directly to this difficulty, we should not expect these languages to exhibit such a contradiction. Therefore, the Japanese and Arabic bans should be viewed as general phonological constraints, either against voiced obstruent geminates or against voiceless labial stops (Hayes, Reference Hayes, Darnell, Moravscik, Noonan, Newmeyer and Wheatly1999:254), not as direct results of mapping the degree of phonetic difficulty to the languages' respective phonologies. Even though phonetic motivations play a role in the basis of constraints, their effects are mitigated by “some pressure toward formal symmetry” (1999:254).
Hyman (Reference Hyman and Juilland1977) discusses phonologization as the process by which natural (i.e., phonetic or intrinsic) variations in the speech signal become part of a language's phonological system. At the phonologization stage of a sound change, a physiologically motivated perturbation is “exaggerated to a degree which cannot be attributed solely to universal phonetics” (1977:410).
Janda (Reference Janda, Joseph and Janda2003:305) argues, “sound change tends to [remain] regular, not due to persistent influence from some kind of articulatory/acoustic phonetic naturalness, but instead because exaggerations and misperceptions of phonetic tendencies tend to involve stepwise generalizations based on the natural classes of phonology.” How these exaggerations may be tied to social forces (Janda & Joseph, Reference Janda, Joseph, Blake and Burridge2003) is discussed below.
Hayes's, Hyman's, Janda's, and Joseph's explanations of nonphonetic conditioning in sound change can be extended to account for the historical patterns in Gorgia Toscana. Lenition of nonvelars in Florentine Italian may involve a conceptual shift occurring subsequent to an initial pattern that is phonetically conditioned, resulting in the generalization of a phonetic process to domains in which purely phonetic factors do not necessarily play a role. In this conceptual shift, feature-based phonology matters. It offers a plausible motivation for the spread of lenition throughout the Italian stop series as well as a simpler set of rules of constraints.
The second advantage of a featural account is its ability to account for the categorical alterations that articulatory phonology cannot (Zsiga, Reference Zsiga1997:229). “Any one representation that is powerful enough to describe gradient processes will not be constrained enough to explain the categorical nature of alternations ….” The data in the current study, though attesting to the gradient nature of Gorgia Toscana, is also evidence that one segment, /k/, lenites categorically (at least some of the time). If /k/'s tendency toward deletion is not simply a tendency toward gradually more reduction, but a categorical alteration, then a theory of gradient gestural reduction, as discussed in the section on production-related approaches, does not account for its behavior. Rather, extreme weakening of /k/ might be part of the phonologization process described by Hyman (Reference Hyman and Juilland1977) or the regularization process described by Janda and Joseph (Reference Janda, Joseph, Blake and Burridge2003).
There are weaknesses, however, to a feature-based approach. Although phonological features capture natural classes and define even single segments in terms of articulatory characteristics, the set of these features is limited. Such a limitation enables generalizations over sound-changing processes, but fails to account for three characteristics of the lenition data in this and previous studies: gradience, variation, and place asymmetry.
Featural approaches without stipulative embellishments do not predict gradient processes. Many appear as all-or-nothing categorizations of an outcome, failing to account for the fine granularity and analog nature of lenition shown in the present study.
Nor do feature-based theories allow variation in the output. The simplest type of featural representation states that given the right context, lenition will occur all of the time. The data in the present study show that the application of Gorgia Toscana varies—it is not the case that all stops necessarily lenite, or lenite to the same extent within or across subjects, in allowable contexts.
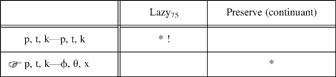
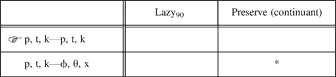
Kirchner (Reference Kirchner1998) repairs part of the intrasubject variation problem by making specific reference (via a lazy constraint) to the allowance of different levels of articulatory effort in various speech registers (based on Giannelli and Savoia's 1978 observations) and by assigning a numerical effort costFootnote 12 to various consonant allophones. As an example, at a given speech register, the voiceless stop [k] resulting from an underlying /k/ requires more physical effort (cost: 85) than, say, the voiceless fricative [x] (cost: 70). Raising or lowering the lazy constraint's coefficient—that is, increasing or decreasing the level of articulatory effort allowable—for any given speech register results in a different optimal output. In the tableau in Table 15, lazy is set at 75, allowing only segments with a lesser effort cost to surface; if the allophone proposed as an output has a higher effort cost than 75, the lazy constraint is violated and the underlying value of the feature [continuant] is preserved.
Weak position, level A
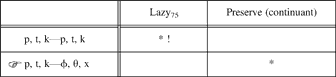
Note: Effort costs: p, t, k = 85; φ, θ, x = 70.
Source: Simplified from Kirchner (Reference Kirchner1998:274).
In the tableau in Table 16, however, the same lazy constraint is hypothetically changed to 90 and generates a different optimal output.
Hypothetical level X
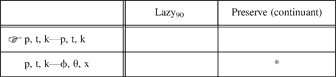
Note: Effort costs: p, t, k = 85; φ, θ, x = 70.
This account repairs the deficiencies of feature-based rules in accounting for variable output, but only by incorporating a phonetically grounded constraint. The lazy constraint and its values at different levels, as well as the effort costs of various surface realizations, are motivated by articulatory difficulty.
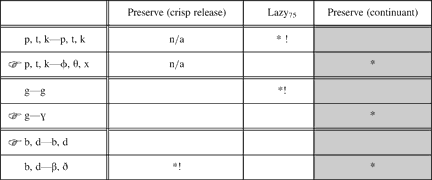
Finally, although featural accounts that refer to entire natural classes are arguably simpler, they do not explain the asymmetry among the members of a natural class that appear in this and previous studies. Even Kirchner's recent model does not fully and consistently differentiate places of articulation as more or less susceptible to lenition, as we see from the tableaux in Table 17.
Spirantization of stops in weak position at level A
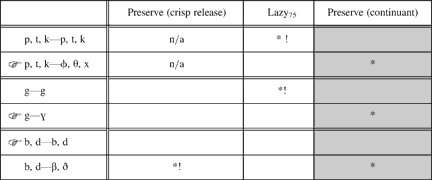
effort costs: p, t, k = 85; b, d, g = 75; φ, θ, x = 74; β, ð, ɣ = 73.
Source: Combined and simplified tableaux 8-23 and 8-2-26 from Kirchner (Reference Kirchner1998:274–275).
At the assumed level of discourse in Table 17 (level A), where speech is the slowest and most formal, all of the voiceless stops spirantize. Of the voiced stops, only /g/ does so because velar stops are underlying (no crisp release) and so their spirantization does not violate the highest ranked constraint.
In its current state—motivated by Giannelli and Savoia's (Reference Vogel, Maiden and Parry1978) discrete analysis of their data—Kirchner's analysis is both too broad and too narrow to account for the data in the present study. It is too broad in the sense that effort value assignments for stops do not vary by place of articulation. On the other hand, it is too narrow in that the addition of the single place-related constraint preserve (crisp release) categorically rules out nonvelar lenition at the rate and register levels where the constraint is incorporated. Both of these problems, relative to the present data, arise from the predominant role played by features and natural classes in the model. This is not so much a fault of Kirchner's model as it is a logical sequela of the discreteness of the data. It might easily be corrected by incorporating lazy and faithfulness constraints that are articulatorily more fine-tuned and less dependent on abstract features and classes.
Despite the drawbacks of feature-based explanations for Gorgia Toscana, some incorporation of features seems necessary in light of Gorgia's spread to an entire natural class of segments and the apparent tendency for voiceless velars to weaken categorically. The availability of, and reference to, a phonological grammar may also assist in accounting for variable output in terms of degree and locus of lenition. The inadequacy of phonological models, however, is in their inability to account for gradience, which explains why velar segments are more susceptible to lenition, or explains why lenition of /k/ is suppressed or accentuated by some of the subjects in the current study.
Functional approaches
This section discusses the relationship between linguistic variation and social context as it relates to Gorgia Toscana. The role of social differentiation in language variation and change emerged from Labov's study of New York dialectal variation (Labov, Reference Labov1966). Labov explored the concept of social class as a variable—a concept since revisited throughout the development of sociolinguistic literature by Labov (Reference Labov1972a, 1980) and many others including Feagin (Reference Feagin1979), Horvath (Reference Horvath1985), and Trudgill (Reference Trudgill1974). Social class, which can be described in terms of objective economic indicators or in terms of subjective notions of prestige and community membership (Ash, Reference Ash, Chambers, Trudgill and Schilling-Estes2002), is not the only social variable, however. Trudgill (Reference Trudgill, Chambers, Trudgill and Schilling-Estes2002:373) highlights three others that enjoy a prominent place in sociolinguistic research. Social context (or style/register), gender, and ethnicity have all been used as independent variables in the attempt to explain linguistic variants in the domains of sound, form, and meaning (although many other variables are testable). Variationist theories can be incorporated into a study such as the present one, which attests to diachronic spread of lenition and synchronic variation in individual subjects' lenition patterns.
Giannelli and Savoia (Reference Giannelli and Savoia1978) have set a precedent for considering social factors as correlates and motivators of Gorgia Toscana. The small number of subjects in this study makes social generalizations difficult; however, social variables cannot be ignored. This section focuses on the role that social forces might be seen to play in the historical acceptance of lenition in the Florentine dialect, in the subsequent spread of lenition to nonvelars, and in the present-day variation in preference for velar lenition. There are sound reasons to believe that phonetic and phonological motivations play an essential role in the innovative and spreading stages of Gorgia Toscana, respectively, but these motivations cannot completely account for the diachronic observations, and they cannot account at all for the synchronic variation of velar lenition among subjects in the present study.
Social factors in the acceptance and spread of a sound change
Even though articulatory pressures may have been the catalyst for the original innovation of velar lenition, its acceptance as a regular dialectal feature cannot be attributed only to phonetic conditioning. If it were, the presence of velar lenition in limited geographical areas would indeed be difficult to explain. Labov (Reference Labov1972a:3) begins his investigation into language change by stating “ … one cannot understand the development of a language change apart from the social life of the community in which it occurs.” Narrowing this view to the onset of change, he quotes Sturtevant (Reference Sturtevant1947:74–84):
Before a phoneme can spread from word to word … it is necessary that one of the two rivals shall acquire some sort of prestige.
This observation may be important in the understanding of why velar lenition, arguably a phonetically motivated innovation that might have occurred in all of Italian, should have been adopted into certain dialects, such as Florentine.
Labov, while arguing strongly for the presence of social conditioning in language change, does not rule out the role of phonetics:
At the first stage of change, where linguistic changes originate, we may observe many sporadic side-effects of articulatory processes which have no linguistic meaning: no socially determined significance is attached to them… . Only when social meaning is assigned to such variations will they be imitated and begin to play a role in the language (Labov, Reference Labov1972a:23).
The overlay of social factors, then, is just that—a post-innovative force that does not in any way undermine the argument that velar lenition in Florentine (and possibly other Tuscan dialects) occurred for phonetic, and only phonetic, reasons, a claim made by Janda and Joseph (Reference Janda, Joseph, Blake and Burridge2003:205–206). Their “Big Bang” (Janda & Joseph's term) theory of sound change requires that “purely phonetic conditions govern an innovation.”
Why did Florentines adopt the phonetically motivated innovation of velar lenition, and why has it spread throughout the natural class of stops? One plausible answer is that lenition, though phonetically natural enough to occur in other regional varieties of Italian, became associated with specific geographical areas and took on a specific social meaning, in much the same way as vowel centralization did on Martha's Vineyard:
It is apparent that the immediate meaning of this phonetic feature is “Vineyarder.” When a man says [rɐit] or [hɐus], he is unconsciously establishing the fact that he belongs to the island: that he is one of the natives to whom the island really belongs (Labov, Reference Labov1972a:36).
Much more inquiry into the historical and synchronic presence of lenition throughout Italy is required to address the question of why (or whether) weakening became more associated with local identity in primarily Tuscan regions.
As to the subsequent spread of lenition to other places of articulation, this generalization of a specific dialectal feature can also be rooted in social forces. Janda and Joseph (Reference Janda, Joseph, Blake and Burridge2003:7–8) discuss Northeastern Swiss German vowel lowering in this context, arguing that the extension of prerhotic lowering to environments preceding a wider range of consonants can be viewed “as a method of reinforcing local identities.”
The present study is plainly not a thorough sociolinguistic examination of Gorgia Toscana. There are, however, gaps in the scientific analysis that require reference to aspects beyond those supplied in phonetic and phonological frameworks. Though the role of social factors is not central to this study, we can view the weakening of consonants in the data as an innovation that took on a specific social meaning—that of being Florentine—and that this attachment of meaning, whether subconscious or conscious, was an ingredient in the adoption of lenition as a regular and generalized process. Present-day accounts of the ability of Italians to immediately identify a speaker as being from central Tuscany (Cravens, Reference Cravens2000:14) may be seen as the felicitous result of speakers' self-marking via lenition.
Social factors in the variation of a sound change
As the data herein show, lenition in present-day Florentine is not regular. Although certain patterns emerge from testing a number of hypotheses, there is a great deal of intersubject and intrasubject variation. This section addresses one specific element of intersubject differences: the suppression of /k/ lenition among certain subjects in light of prior observations that velars are more prone to lenite and the general presence of lenited consonants in all subjects' speech.
Florentines are extremely conscious of their dialect and some of its phonetic, syntactic, and lexical features, but they appear to be more aware of /k/ lenition than of /t/ and /p/ lenition (Cravens, Reference Cravens2000:14). The result of this consciousness, Cravens claims, is a Labovian stereotype, where the velar surface variant [h] serves as a “sociolinguistic marker or indicator of toscanità ‘Tuscanness’” (Cravens, Reference Cravens2000:14). This stereotype is regarded both positively and negatively, both by the speakers it marks and by other speakers throughout the Italian peninsula. Indeed, Cravens points out the typical non-Tuscan mimicry of [uː na hɔː ha hɔː la hon la hanː uʧː a] una Coca Cola con la cannuccia “a Coca Cola with a straw” (Cravens, Reference Cravens2000:14).Footnote 13 Given the potential of negative marking of /k/ lenition with respect to a greater geopolitical area, another sociolinguistic marker is plausible: the realization of unlenited /k/ as an indicator of “Italianness.”
Although there is a sense in which dialectal features in Italy are linked with lower rungs of the social ladder, not all such features need be regarded pejoratively:
The distinction between Italian and dialect has no firm correlation with social hierarchy, because although ignorance of Italian is limited to the bottom of the scale, the use of dialect is not, and cuts right across class barriers (Lepschy & Lepschy, Reference Lepschy and Lepschy1977:12).
Izzo (Reference Izzo1972:100) corroborates this observation with anecdotal evidence based on a year's worth of interactions with university students, a university professor, and various other business people and professionals in Florence.
These allusions to lenition as both a positive and negative social marker are reflected in the various attitudes of Florentine Italians and are discussed in recent studies of lenition in a Labovian framework (Cravens & Giannelli, Reference Cravens and Giannelli1995; Pacini, Reference Pacini1998). On the one hand, the majority of the subjects interviewed for the present study, and of other Florentines interviewed, regard their most salient dialectal feature—la “c” aspirata Footnote 14—as a deficiency, claiming that it is sbagliata “incorrect.” On the other hand, regular adoption of this dialectal feature by nonnative speakers of Italian is looked upon favorably, and scholarly work on Gorgia Toscana is considered a tribute to, rather than a derogatory illumination of, Florentine speech. There appears to be a conflict, then, on the part of speakers in the community. They are conscious of their /k/ lenition and view it as a deviation from the ideal linguistic standard while also viewing lenition as a positive marker of identification with Florence. Previous studies of choice of linguistic variants in Bibbiena (Cravens, Reference Cravens2000; Cravens & Giannelli, Reference Cravens and Giannelli1995) and Cortona (Pacini, Reference Pacini1998) suggest that there is much to be gained from incorporating the concepts of prestige and stigma in descriptions of interspeaker and interregional variation of Gorgia Toscana.
Although this study's original design did not incorporate the issue of variation in preference for /k/ lenition, there is a plausible sociolinguistic explanation for the tendency of certain speakers to suppress the dialect stereotype. As Cravens points out (2000:13), the pronunciation of full occlusions corresponds to Standard Italian and is overtly prestigious. Thus we might expect those Florentines who have regular contact with non-Tuscans to be somewhat more inclined toward use of the national norm, which involves /k/ surfacing as [k]. Schilling-Estes and Wolfram (Reference Schilling-Estes and Wolfram1999), following Trudgill (Reference Trudgill1986), posit that dialect dissipation stems directly from increased contact with speakers of other language varieties. This hypothesis can be extended to the present discussion. On the basis of personal data collected from the six subjects in this study, /k/ lenition is less likely to occur in the speech of individuals (F2, F3, M2, and M3) with generally higher educational levels, or who have some combination of regular business dealings with colleagues and clients throughout Italy (and in three cases, throughout Europe). The dialect stereotype is least suppressed, and possibly accentuated, by the two subjects (F1 and M1) who maintain virtually no contact with non-Florentines. The intersubject variation graph in Figure 6 illustrates this pattern.Footnote 15
Further questions arise from the intersubject patterns in this study. Following Bucholtz (Reference Bucholtz1999), we might assume that the behavior of speakers is agentive in nature (Certeau, Reference de Certeau1984) and not simply a subconscious reflection of social patterns already in existence (Bourdieu, Reference Bourdieu1991). It is not immediately clear whether speakers are engaging in negative or positive identity practices (Bucholtz, Reference Bucholtz1999:211–212), but the patterns in Table 14 indicate that speakers may be using phonetic information to build and convey identity and so are engaging in some type of identity practice. If this is indeed the case, we can likely use Gorgia Toscana data to explore what the exact nature of that identity is (Tuscanness, Italianness, or their antitheses) and the extent to which different speakers build this identity in varying contexts.
The Gorgia Toscana provides us, then, with an opportunity to explore the role of social forces working (either in tandem or antagonistically) to encourage the general continuation of lenition while concomitantly causing individual speakers to either accentuate or suppress lenition. Although the present experiment cannot address this subject more fully, it has nonetheless brought to light an interesting and testable area of inquiry that has a basis in the literature on dialectal variation and the use of phonetic information in the construction of social identity.
CONCLUSION
This study adds to the existing literature on Gorgia Toscana by providing a more thorough, objective, and replicable analysis of Florentine speech data than has heretofore been undertaken. It has presented an acoustic analysis of all stop consonants undergoing intervocalic weakening and has introduced an innovative statistical technique for quantitative investigation of the construct of lenition. The findings support previous claims regarding susceptibility of velars and variability in the output, but the patterns emerging from the present data support arguments for and against specific ways of looking at the lenition process under investigation. It appears that phonetic, phonological, or social explanations cannot independently account for the Gorgia data.
This outcome should stimulate further inquiry into the roles played by physiological, perceptual, featural, and social factors in sound-changing processes, and how such factors reinforce or weaken each other's effects (see Hume & Johnson, Reference Hume, Johnson, Hume and Johnson2001 for a proposal of a suitable model). The data herein also suggest a need for as yet unrealized articulatory and perceptual studies of Gorgia Toscana. They call for more investigation into how phonetic innovations may generalize over time and whether the attested asymmetry among consonant sounds involved in Gorgia might be attributed to eventual phonoligization of what was effectively an articulatory accident. The variable nature of consonant weakening among subjects calls for a greater understanding of whether, and how, sound alterations are socially marked in Florentine and other Tuscan dialects.
APPENDIX: TOKEN LIST
Notes: Underlined segments in each token indicate the relevant sounds. Frequency coefficients are from the De Mauro corpus Lessico di frequenza dell'italiano parlato (Corpus LIP). Glosses are from Il Grande Dizionario Hazon di Inglese 2005 (Garzanti).