

Introduction
The World Health Organization’s (WHO) sustainable development goal (SDG) 3.8 states that access to universal health coverage (UHC) and protection against financial risks, as well as achieving quality and affordable medicines, are important indicators for ensuring healthier lives and greater well-being. In many developing countries, inadequate health care resources prevent equal access to health needs. Private health expenditure refers to those incurred by non-public agents and are often split between out-of-pocket expenditure (OOP), voluntary payment schemes and external sources. OOP expenses force those seeking healthcare to choose between health expenses and other necessities, creating financial hardships.Reference Castaño, Arbelaez, Gedion and Morales1 The proportion of people in the world spending more than 10 percent of their household income on health has increased from 9.4 percent in 2000 to almost 13 percent in 2015.Reference Sirag and Norashidah2
OOP health spending in Latin America and Caribbean (LAC) countries have not shown a substantial decline despite the increase of GDP and public revenues in the last two decades. Medicines make up a high share of the total health spending, and the reason have not been widely analyzed, in the context of a market with high drug prices and several attempts to develop high standards of regulation in the pharmaceutical markets. In LAC on average, the OOP share of health spending is 34 percent — well above the OECD average of almost 21 percent.3 The highest presence of OOP is seen in Venezuela (63 percent) followed by Guatemala (54 percent) and Grenada (52 percent).4 In other words, OOP health spending in these three countries is above 50 percent. Only five countries stand below 20 percent — Cuba (10 percent), Argentina (15 percent), Colombia (16 percent), Jamaica (17 percent), and Uruguay (17 percent).
A substantial part of the health care OOP is spent on medicines that tend to not be fully available to users at affordable cost. Many pharmaceutical products in Latin America are unavailable and/or unaffordable to most of the population. The objective of the paper is to examine the trend and disparities of total OOP expenditure on health and drugs and outline the main trends in drug spending and coverage in Peru, Brazil, and Costa Rica.
The first section presents health OOP trends in LAC countries. The second section discusses methods for assessing the magnitude of OOP expenses in drugs and total health services by income quintile. The third section presents an extensive literature review on equity in access and expenditure on medicines. The fourth section investigates the disparities across income quintiles in access and financing of health and drug expenditures in Brazil, Costa Rica, and Peru. Finally, a concluding section provides an overview of challenges and policy implications.
Trends in OOP Health Spending in Latin America and the Caribbean
Government spending as a percentage of the gross domestic product (GDP) in LAC has increased over the past two decades except for a few countries such as Peru. (Figure 1, A and B). However, current health expenditure (CHE) as a share of general government expenditure (GGE) has only increased in some of the more globally competitive countries in the Region (Figure 1D), such as Chile, Colombia, Panamá and Perú (Figure 1C). In Argentina and Costa Rica there was, in fact, a drop in the share of health spending in total public spending.
General government expenditure (% of GDP) has seen a rise across LAC in the past two decades; however, that has not translated for health expenditures in most countries.
Source: WHO Global Health Expenditure Database5
Source: WHO Global Health Expenditure Database6
Note: Group 1 includes globally competitive countries “Chile,” “Colombia,” “Costa Rica,” “Mexico,” “Panama,” “Peru.” Group 2 countries are “Argentina,” “Brazil,” “Uruguay.” All values are averages.

OOP spend as a share of CHE is over 15 percent in ten Latin American countries and the average for Caribbean countries. In Paraguay and Mexico, OOP’s participation in health is even greater, with more than 40 percent of CHE (Figure 2A). OOP above 20 percent of current health expenditure is considered problematic as it indicates high vulnerability to catastrophic health spending in the event of a health emergency. What is also significant is an increase in per capita health expenditures, adjusted for purchasing power parity (PPP) across countries (Figure 2B). The increase is almost three folds in Argentina, Panama, and Chile, and almost double in Costa Rica, Paraguay, and the Caribbean islands.
The reliance on out-of-pocket health expenditures varies across Countries in LAC.
Source: WHO Global Health Expenditure Database7

When investigating insurance coverage and the share of spending on drugs or pharmaceuticals as percentage of CHE, data are limited to just a few countries. Using OECD data, all high-income countries have virtually full health insurance coverage, with the notable exception of the US (Figure 3). It is also clear that LAC countries that are member of the OECD, such as Chile, Costa Rica, Colombia, and Mexico have partial health insurance coverage.
OECD high-income countries ensure complete health coverage, whereas LAC lags behind.
Source: OECD Health expenditure and financing: Health expenditure indicators8
Note: Data for all countries is reported for 2019, except for Chile where the latest data point available is 2017.

There is also heterogeneity across countries in spending on pharmaceuticals as a share of health expenditures (Figure 4). While Colombia is close to the OECD average at 15 percent, Costa Rica spends well below the average at 9 percent. Brazil and Mexico, have a greater of pharmaceutical products in total health spending.
There is heterogeneity across countries in spending on drugs.
Source: OECD Health expenditure and financing: Health expenditure indicators9

Given the weight of healthcare expenses, especially for households OOP, it is not surprising that in most LAC countries, more than 10 percent of the population spends over 10 percent of their household income on health expenses (Figure 5A). The numbers are more worrying when looking at the proportion of people who spend over a quarter of their earnings on health (Figure 5B). In Nicaragua over 9 percent of the country’s population spends at least a quarter of their earnings on healthcare, whereas between 4 to 5 percent of the population spends this proportion in Dominican Republic, Chile, Argentina, Colombia, and Chile. The statistics get even more troublesome when looked at from the point of poverty perspective (Figure 5C). In Haiti and Nicaragua, over 4 percent of the population has fallen below the $3.20 (2011 $ PPP) poverty line due directly to high OOP health expenditures.
Over 10 percent of the population in most countries spends at least 10 percent of their income on healthcare.
Source: OECD Health expenditure and financing: Health expenditure indicators10
Note: Data for all countries is reported for 2019, except for Chile where the latest data point available is 2017.

What We Know about the Drugs OOP Expenditures
More than a quarter of the world’s population lacks access to essential medicines because they are unavailable, inaccessible, or of poor quality. Systemic barriers to clinically appropriate drugs disproportionately affect people based on their income, race, ethnicity, and other factors. Medicines represent the largest health expenditure item in the family budget of the poorest population. The barriers are usually associated with low health coverage and can be addressed through policies and procedures to increase access.
In recent decades, the expansion of public coverage or health insurance schemes has strengthened families’ access to a greater variety of medicines. But rising drug costs and the spread of NCDs are still driving many households into poverty. To exemplify, the high costs of drugs for rare diseases make it difficult to access the respective treatments.
Overall, the data show that, although progress has been made to improve health coverage in LAC, there are still pending challenges to improve access to and financing of medicines that guarantee the health and well-being of people and reduce inequalities. One of the important aspects of the health systems in the region is the financial protection granted to the population through health insurance. Although in principle, insurance fulfills a protective role for households against OOP spending, this protection is often uneven or inefficient.
With the acceleration of the demographic and epidemiological transition in low- and middle-income countries (LMICs), prescription drugs have become essential in the management of chronic diseases and acute cases, because they improve the health status of these neglected groups. This section will highlight the main issues related to OOP in medicines in LMICs as it relates to equity issues, catastrophic expenditures associated with NCDs, and financial protection mechanisms.
OOP spending accounts for 16.4 percent of total global health spending. LAC is the third region in the world with the highest direct household spending, reaching on average 26.2 percent of total health spending in 2020 — 10 percentage points above the world average.11 In Latin America, the percentage of OOP in total health expenditure per capita increased from 2000 to 2018, with significant variation across countries. In Colombia, 9.6 percent of households had catastrophic out-of-pocket spending in 2011 and in Chile, the households faced catastrophic health expenditures reached 4 percent in 2012.Reference Mougenot and Herrera-Añazco12
Overall, the data show that, although progress has been made to improve health coverage in LAC, there are still pending challenges to improve access to and financing of medicines that guarantee the health and well-being of people and reduce inequalities. One of the important aspects of the health systems in the region is the financial protection granted to the population through health insurance. Although in principle, insurance fulfills a protective role for households against OOP spending, this protection is often uneven or inefficient. In Argentina, for example, the presence of public coverage as the first source of healthcare is clearly concentrated in the lowest income group (62.39 percent) but drops drastically by half (32 percent) in the second quintile and gradually drops to less than 5 percent in the group with the highest income.13
Effective access to medicines in Latin America was analyzed, in the case of Mexico, by García-Diaz.Reference Garcia-Diaz14 In that country, those who have public insurance, but who systematically resort to private services through direct payments do not have effective access. Public insurance generally only guarantees around 50 percent effective access, as non-monetary access represents a greater proportion of OOP expenditure and a greater risk of incurring catastrophic expenditure. In the case of Mexico, it is noted that not opting for effective access increases OOP spending by around 2300 Mexican pesos per year. Thus, it was found that a positive correlation between affiliation to Seguro Popular and the probability of incurring catastrophic health expenses. One of the criticisms of the Seguro Popular scheme was, precisely, that it increases the demand for services, while not being able to offer sufficient and quality services.Reference Sáenz-Vela and Guzmán-Giraldo15
Another important aspect that impacts the health OOP and drug spending in the region is the aging of the population and the health of older adults. There is a significant increase in health and drugs OOP spending in the elderly especially among those individuals with higher levels of disability or chronic diseases.Reference Rivera-Almaraz, Manrique-Espinoza, Chatterji, Naidoo, Kowal and Salinas-Rodríguez16 It was found that the percentage of households with catastrophic expenses is higher in households with at least one person over 65 years of age (4.2 percent), compared to the rest of the households (1.7 percent).Reference Nava-Bolaños17 Health systems must be prepared for the unprecedented demand for health services and medicines by the elderly population. The probability of not having access to medicines is 2.7 times higher for old age people if they need to purchase drugs with OOP, compared to who did not need to use their own resources because are covered by health insurance or other kind of resources. OOP spending increases by 3.3 times the probability of no access to medicines if you were older than 50 years compared with younger users, and by 3.6 times more if the required medication is needed for more than one year compared to those who needed it for a shorter time.Reference Nievas, Gandini and Tapia18
Countries with accelerated rates of aging such as Uruguay, Chile, and Argentina face these challenges with the consequent economic impact on financing health systems and increasing share of drug spending on the households’ OOP expenditures.
It is not surprising, therefore, to observe that access to medicines in Latin America presents greater limitations in women over 50 years of age who present a higher health OOP expense. The OOP burden of health spending has an unequal distribution in the population, and LAC aging is a key factor that led to this inequality. For instance, 76.6 percent of Paraguayan households with sick or injured over 60 years incurred health OOP expenses. This affects 79.5 percent of poor households and 75.8 percent of non-poor households. Overall, average health OOP spending was lower for poor households, but expenses made before the illness or accident of one of its members aged over 60 years impact differently on households according to their poverty condition. The monetary incidence of health spending is twice as high for poor households compared to non-poor households.Reference Giménez, Caballero, Peralta and Araujo19
Not only is there an inequity factor in access to medicines, but financing is also inequitable because it links access to ability to pay and not to the need for care. In LAC, the population is exposed to excessive spending, and it affects the poor most intensely. While there is evidence that health insurance reduces, albeit not sufficiently, the likelihood of overspending on medicines, public policies should be focused on health promotion and diseases prevention, as well as on reducing gaps in the quality of public health services. The results show that heterogeneity exists not only at the regional level, but also due to the socioeconomic differences of individuals.20
In Argentina, similar patterns of family spending on medicines were found in household income groups that have limitations on ability to pay, showing that the poorest cannot exceed a maximum limit of spending on medicines beyond which other basic needs cease to be satisfied.21 In Chile, the public insurance system (FONASA) and the private insurance system (ISAPRE) show different results in terms of the acquisition of medicines and OOP health expenditure. It was evident that OOP spending on medicines affects slightly more those enrolled in public insurance (31.4 percent) than in the private insurance (29.9 percent). Private insurance affiliates have higher OOP spending than public policyholders in absolute terms and in terms of the proportion of their income allocated to OOP payments. In Chile, the percentage of OOP expenditure on health of poor households as a proportion of total income was 14.6 percent, 8.2 percent in middle-class households and 7.0 percent in rich households. The probability of catastrophic health spending in poor households was 30.6 percent, in middle-income households,10.2 percent and high-income households 8.6 percent.Reference Castillo-Laborde and Villalobos Dintrans22
There is ample evidence that socioeconomic status, education, and occupation are the main determinants of OOP expenditure on health and medicines, and the probability of incurring catastrophic expenditure on health in LAC.Reference Alvis-Zakzuk, Marrugo-Arnedo, Alvis-Zakzuk, de la Rosa, Florez-Tanus, Moreno-Ruiz and Alvis-Guzmán23
Methods
The WHO annual health expenditure data series was utilized for the comparative analysis among Latin American Countries and for the global comparison with other regions. OECD data on drug expenditures provided information on drug spending trends in LAC.Reference Mousnad, Shafie and Ibrahim24 For country estimates, microdata from Household Surveys from three selected countries (Peru, Chile, and Costa Rica) were used for selected years between 2010 and 2020. The estimated CHE prevalence corresponds to the fraction of health care spending related to household consumption expenditures, and this analysis was performed in relation to national poverty levels. Single and multiple logistic regression models were used to examine associations of out-of-pocket spending with explanatory factors. Some measures of income and spending concentration, such as the Gini and Kakawane coefficients, were used in the analysis of selected countries.
A brief systematic review of previous studies on drugs expenditures was performed by extracting policy information and estimates at the global level through a search of pragmatic literature in PubMed and Google Scholar, and gray literature, such as websites of multilateral organizations.25
COUNTRY CASES
PERU: Out of Pocket Expenditures in Health and Drugs in Peru: Are the Poor Financially Protected?
According to the national pharmaceutical policy in Peru, the public health care system should ensure universal access to medicines as an essential component of comprehensive care through rational selection, affordable prices, sustainable financing, and reliable supply.26 Nevertheless, differentiated access to medicines in public or private health facilities, geographic location, and level of care (primary care x hospitals) has been frequently implying suboptimal availability of medicines in the public sector. This means that although patients should receive their medications free of charge, they may have significant OOP expenses to purchase these in the private sector due to their unavailability in the public sector.
Peru has a nationwide monitoring system for the supply of medicines in the public sector that keep a record of the availability and quantity of medicines used in each health facility. The use of systematic data allows for a stratified analysis by level of care and/or geographical organization (district, province, or regions). Such a tool could also assess the impact of policies or interventions in the procurement, distribution, or prescription. This data could be an asset for more detailed analysis of the impact of the current pharmaceutical policy in the country.
Health expenditures in Peru reached 5.2 percent of GDP in 2018. About 61.5 percent of this expenditure (3 percent of GDP) was financed by the public sector and the private sector contributed 38.5 percent. OOP in health accounted for around 30 percent of total health spending.Reference Matus-López, Toledo and Pedraza27 Around 40 percent of OOP expenditures dedicated to health were allocated to purchase medicines.
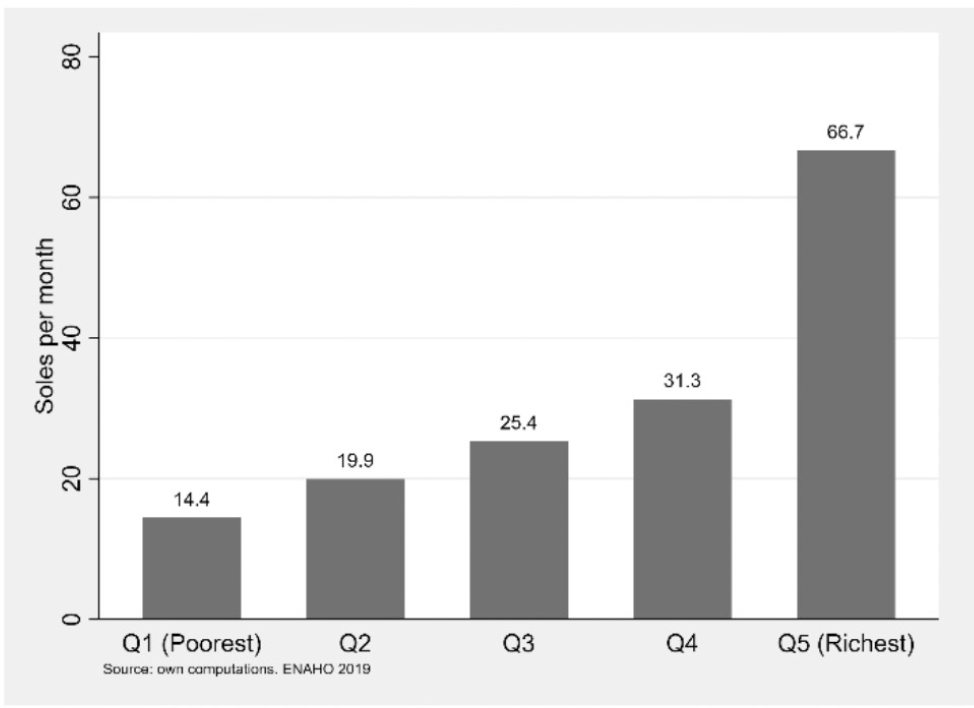
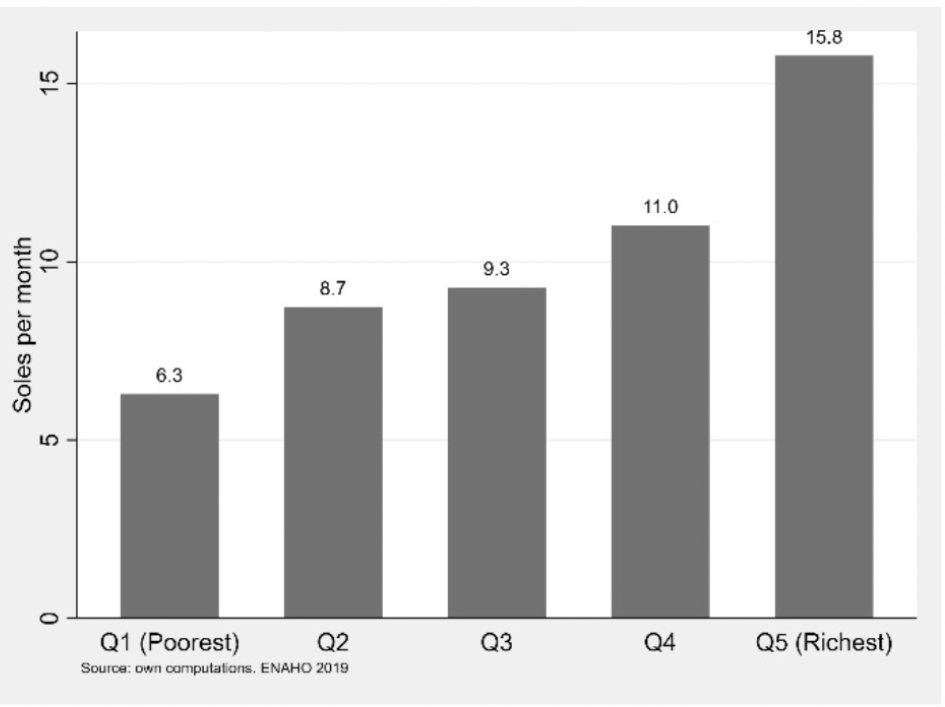
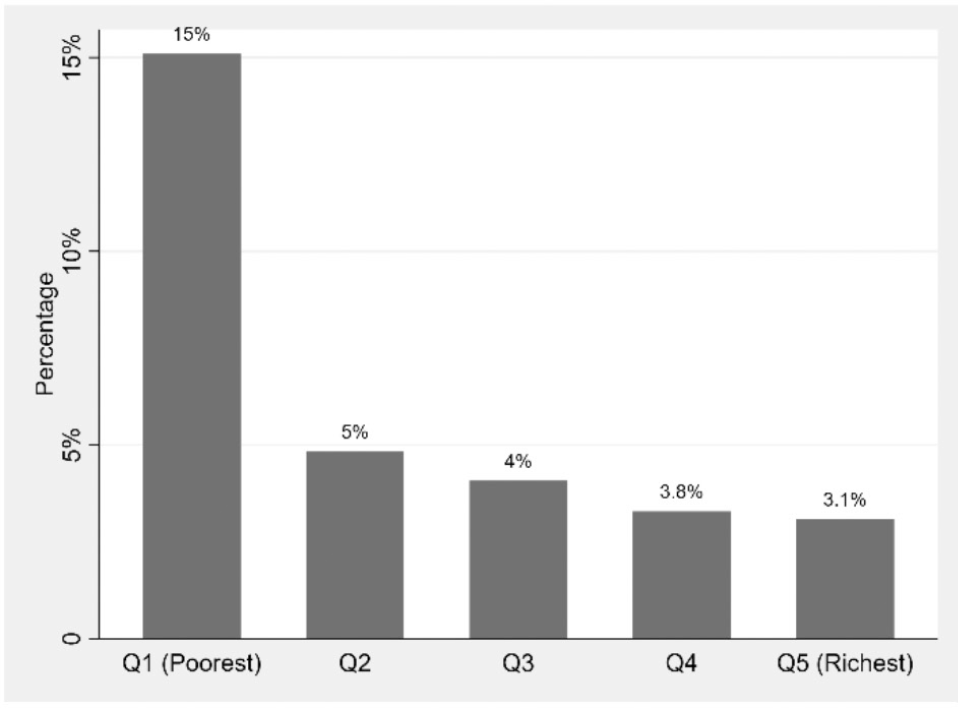
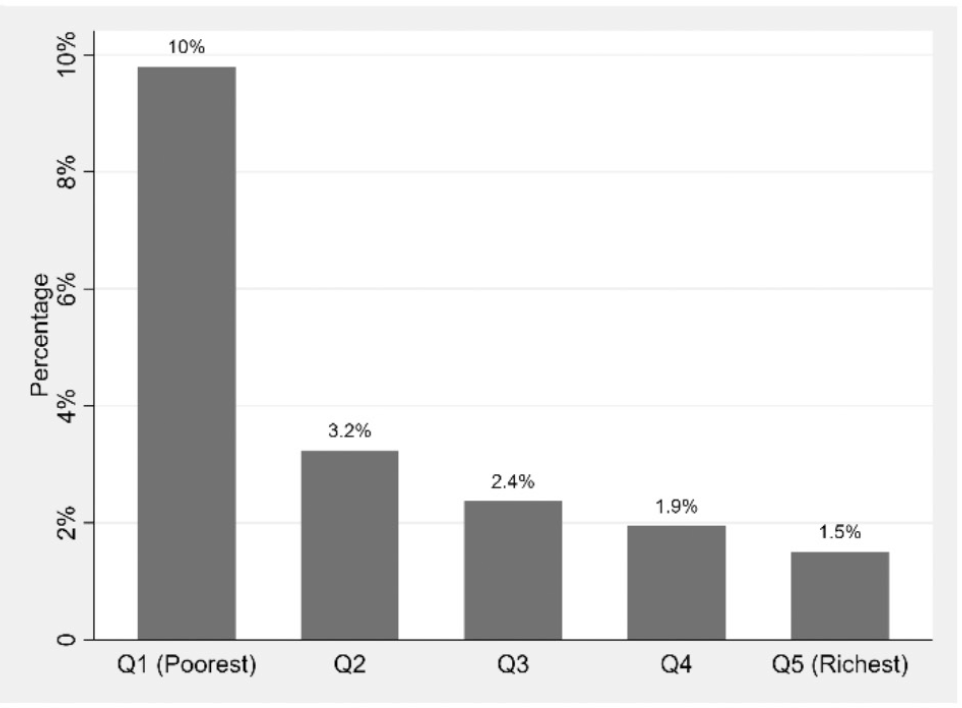
Families spent an average of 1,500 soles (US$405) per year on pharmaceuticals.Reference Guerrero-Ojeda28 These expenditures, however, are marked by strong socioeconomic inequality. The richest quintiles of the population have higher absolute expenditures on medicines than the poorest, but this does not occur if we observe the percentage of the family budget spent on medicines, given that expenditures on medicines in the poorest quintiles have a greater relative impact on the budget of this portion of the population, due to their lower disposable income.Reference Hernández-Vásquez, Vargas-Fernández, Magallanes-Quevedo and Bendezu-Quispe29 This disparity is observed when comparing direct expenses for each income quintile.
Perú: Out-of-Pocket Expenditure by Income Quintile
Source: Authors´ elaboration with data from ENAHO 201930

Perú: Out-of-Pocket Spending on Drugs by Income Quintile

Perú: Out-of-Pocket Expenditure as a Proportion of Household Income by Quintiles
Source: Authors’ elaboration with data from ENAHO 201931

Two factors clearly show that, in Peru, both access and spending on medicines are highly inequitable, affecting the poorest families. First, the deficit in access to medicines and the possibility of catastrophic expenses is visibly higher among the lowest income deciles. Second, these same poorest income deciles of the population spend more significant portions of their income on the purchase of medicines.
Another determining factor in the distribution of out-of-pocket expenditure is the level of education. A higher OOP expenditure in health and, particularly in medicines, has been found for people with more years of education. (Figure 10).
Perú: Out-of-Pocket Expenditure in Medicines as a Proportion of Household Income by Quintiles

Perú: Out-of-Pocket Expenditure by Level of Education
Source: Authors elaboration with data from ENAHO 201932

On the other hand, health insurance plays a fundamental role in the financial protection of the population against OOP spending (see figure 11). However, those insured by the mandatory social health insurances (EsSalud and other private health insurances) made the highest expenditure on health, representing 37.2 percent of the total health OOP spending in 2019, followed by people insured with the Comprehensive Health Insurance (SIS) with 25.7 percent. which is financed with general taxes. It is important to highlight the increase in the participation in total out-of-pocket expenditure of SIS affiliates from 17.9 percent to 25.7 percent from 2018 to 2021. Those affiliated to the Comprehensive Health Insurance (SIS), for each quintile of expenditure per person, represent an average of 44.2 percent, with those with the highest affiliation being those of quintiles 1 and 2 considered the poorest with 71.6 percent and 55.2 percent respectively. The percentages of affiliation to ESSALUD increase from quintile 1 to quintile 5 by 8.5 percent to 52.5 percent with an average affiliation of 28.3 percent; it is important to note that 24.2 percent of the population in Peru are not affiliated to any health insurance.Reference Guerrero-Ojeda33
Perú: Out-of-Pocket Expense by Type of Insurance
Source: Author´s elaboration with data from ENAHO 201934

Regarding the services where the population goes to be treated: the ENAHO 2019 survey shows that t 47.6 percent of the population did not seek care for a health problem. About 20 percent of the population went to the Ministry of Health facilities and 7 percent went to a private sector provider and 6 percent to ESSALUD facilities. The full data of the distribution of where the population was served is in figure 12 below.
Perú: Place Where People Go to Be Treated
Source: Authors’ elaboration with data from ENAHO 201935

Perú: Concentration Curve of Out-of-Pocket Expenditure on Health 2019
Source: Authors’ elaboration with data from ENAHO 201936

Based on data from the ENAHO 2019, the richest quintile of the population concentrates around 80 percent of total OOP spending. Most of households not reporting OOP health expenditures are those from the poorest quintiles, which could indicate either progressive financial protection or that families with lower incomes tend to have less income available to spend on medical consultations or on medicines in addition to the coverage provided by SIS. Figures 14 and 15 show the concentration curves of OOP expenditure. The concentration area is quite large, indicating an unequal distribution of the household income spent on health. The poorest income groups spend little on medicines relative to higher-income groups. This high concentration process may be related to the failures of the SIS to provide financial protection to the poorest and to offer fully free drugs as needed by the poorest income groups as assured by the 2004 Law.
Perú: Concentration Curve of Drugs Out-of-Pocket Expenditure 2019

Perú: Total Out-of-Pocket and Medication Expenses by Area Where They Live
Source: Authors’ elaboration with data from ENAHO 201937

Rural households are the most affected by high OOP spending on health and medicines, due to their lower income levels that make them more vulnerable to catastrophic expenditures and greater inefficiencies in rural health services. They are also the ones who pay a higher proportion of their income on medicines (figure 15).
It is important to note that the existence of chronic diseases increases household out-of-pocket spending. Peru shows a growing trend in the number of people suffering from chronic diseases.38 Chronic diseases are persistent and long-lasting, putting households in a situation of financial vulnerability due to the higher health expenses they entail.39 For this reason, the availability and proper dispensing of first-line medicines for hypertension and diabetes is an essential factor for sustainable and equitable treatment.Reference Tenorio‑Mucha40
Perú: Total Out-of-Pocket and Medication Expenses for Chronic Illness
Source: Authors elaboration with data from ENAHO 201941

BRAZIL. Equitable Access and Spending on Medicines in Brazil: What Do Household Surveys Say?
Expenditures and Public Policies for Access to Medicines in Brazil
Spending on medicines in Brazil has increased in recent years, largely influenced by the low economic growth of the last decade. Between 2010 and 2019, household consumption expenditures on medicines remained stable at around 1.6 percent of GDP, and national spending on medicines about 2.2 percent of GDP in 2019, when total spending with health in Brazil reached 9.6 percent of GDP, according to the Health Satellite Accounts, calculated by the Brazilian Institute of Geography and Statistics (IBGE). Thus, 23 percent of what the country spent on health in 2019 was consumed by families and the government with medicines and decline from 26 percent in 2010. In 2019, total household spending on pharmaceuticals/medicines reached US$31.1 billion (R$122.7 billion). This amount corresponds to 29.3 percent of household health expenditures and 73 percent of total expenditures on pharmaceuticals in the country.42
In the last two decades, Brazil has improved the population’s access to medicines, due to the implementation of specific public policies, within the scope of the Unified Health System (SUS) — a public system that aims to provide free universal access to health for all Brazilian citizens. The SUS created three major programs that define the scope of access to medicines: (1) the National Medicines Policy (PNM), launched in 1998; (2) the National Pharmaceutical Assistance Policy (PNAF) launched in 2004 and, (3) the Popular Pharmacy Program of Brazil (PFPB), also created in 2004, but which has undergone several modifications and improvements in recent years.
The PNM and the PNAF established the main guidelines and strategies to expand the population’s access and improve public management of the supply of medicines by the SUS, while the PFPB aims to complement the supply of medicines used in primary health care, through a partnership with private sector pharmacies and drugstores. Thus, in addition to basic health units and/or municipal public pharmacies, citizens can obtain free or subsidized medicines at pharmacies accredited by the PFPB.
The main innovation brought by the PFPB is the supply of free medicines for the treatment of non-communicable diseases, such as diabetes, asthma, and hypertension, where costs in pharmacies were prohibitive for most Brazilian citizens. The program also subsidizes medication for dyslipidemia, rhinitis, Parkinson’s disease, osteoporosis, glaucoma, contraceptives, and geriatric diapers. In these cases, the Ministry of Health pays part of the drug price (up to 90 percent of an assigned reference value) and the citizen pays the rest, according to the price practiced by the pharmacy.
It is important to note that public spending on SUS medicines (PNM and PNAF) did not increase much in the last decade and were seriously compromised after the pandemic, but this did not happen with the PFPB, which had spending increases until 2017, when its funding began falling.
Equity and Access to Medicines in Brazil
Despite all these well-designed and well-intentioned policies, access to prescription drugs in Brazil has not been a gift for the entire population. According to the 2019 National Health Survey (PNS), 81.8 percent of people who received prescriptions for medications in the last medical appointment had full access to their medications, but 10.0 percent received only a few and 8.2 percent did not receive them.
In addition to this unequal access, most of prescribed drugs are financed directly by families, who purchase them from the private network of pharmacies with out-of-pocket resources.Reference Garcia, Sant’Anna, Magalhães, Santana de Freitas and Aurea43 The low access to drugs in the SUS or in the PFPB may not only be a problem of shortages in the public supply, but also a problem on the demand side. A certain portion of the population may not even have looked for medicines in the SUS or the PFPB due to the asymmetry of information about the functioning of these programs, or even because pharmacies or health centers are in places that are not accessible to less informed citizens and more needy population. In this case, the preference for most citizens with ability to pay is to go straight to the nearest pharmacy, whatever the cost of the medicines.
The three main sources of obtaining free or subsidized medication for families in Brazil are: (a) private health plans (accessed by only 25 percent of families), (b) the network of SUS health units, and (c) the PFPB. In 2013, the percentage of the population receiving completely free or subsidized medication was 5 percent among users of private health plans; 20 percent from SUS and 12 percent from PFPB.Reference Domingues, Andrade, Chein, Santiago, Perobelli and Possa da Motta44 In other words, 93 percent of health plans’ beneficiaries, 75 percent of PFPB users and 57 percent of SUS users had to bear the total cost of prescribed drugs.45
Percentage of Deficit of Access to Medicines in Brazil by Income Quintiles — 2013
Source: Brazil, IBGE, National Health Survey (PNS), 201346

On the other hand, as previously mentioned, 17.6 percent of Brazilians who needed prescription drugs did not get them or got only part of them, according to the 2013 National Health Survey (PNS). Of these, 55 percent claimed that pharmacies or health services did not have the medicines and 13 percent were unable to purchase them due to lack of money. According to a study carried out by the Ministry of Economy of Brazil with data from the 2013 PNS,47 13.8 percent of Brazilian families are considered in deficit of prescription drugs.
Higher drug costs or consumption also increase the risk of impoverishment due to catastrophic drug expenditures. Figure 18 shows the percentage of the population with catastrophic expenditures on pharmaceuticals according to population income deciles. It is shown that 13 percent of the population at the poorest decile is incurring catastrophic spending in medicines. This proportion is 65 times higher than the exposure of the richest decile to catastrophic spending in medicines.
Percentage of Population Spending More Than 20% of Their Family Budget with Medicines (Catastrophic Spending) by Income Deciles — Brazil 2017-2018
Source: Brazil, IBGE, Family Budget Survey (POF) 2017/1848

Effects of the Pharmaceutical Public Policies on Coverage and Family Spending
The Brazilian government’s policies for direct expenditures with pharmaceuticals defined by the SUS49 led to an increase from 11 percent to 16 percent of the federal budget spent on medicines, considering the period from 2010 to 2016.50 In absolute terms, the federal government’s expenditure on medicines went from US$ 2.6 billion to US$ 4.6 billion, from 2010 to 2016, reducing to US$ 3.8 billion in 2018. This represents a 46 percent increase in the entire period of 2010-2018 (4.9 percent per year)51. Even government spending through the PFPB, which rose from US$84 million to US$718 million between 2010 and 2017, dropped to US$595 million in 2019.52
Percentage of the Brazilian Population Covered by Medicines Distributed by the SUS by Income Quintiles: Brazil 2013-2019
Source: Brazil, IBGE, National Health Survey (PNS), 2013 and 201953

SUS helps reducing the burden of spending on medicines for families, tax exemption for medicines, and the Brazilian federal fiscal policy also assists to increase medicines consumption. On this regard, the total amount of federal expenditures with medicines have increased from US$3.9 to US$7.3 billion, between 2010 and 2017, falling to US$7.0 billion in 2018.
Correia54 demonstrates that both direct government spending on medicines and fiscal subsidies on medicines are regressive. However, they are less regressive than total household income. The accumulation of direct and fiscal government subsidies relative to the poorest 20 percent (that accumulates 2.8 percent of the national income) was 11.9 percent and 6.3 percent versus the richest 20 percent (that accumulates 59.6 percent of total income) with 21.6 percent and 43.5 percent respectively. Boing et al.Reference Boing, Andrade, Bertoldi, Peres, Massuda and Boing55 shows that the access to medicines provided by the SUS between 2013 and 2019 has been reduced, on average, from 31.6 percent to 29.7 percent between 2013 and 2019, concentrated in the three poorest quintiles of the population (see Figure 19).
Between 2013 and 2019, the average drug coverage of the Brazilian population increased from 78.4 percent to 81.8 percent and, as can be seen in figure 20, the largest increases occurred among the population of the poorest income deciles. Bearing in mind that the SUS has reduced its drug coverage among these population income deciles, the increases in coverage are probably associated with the private sector. This could also explain why direct household spending on pharmaceuticals increased from 2.17 percent to 2.80 percent of total household spending between 2002/3 and 2017/18.
Percentage of the Brazilian Population Covered by Medicines Distributed in Public and Private Sectors by Income Quintile 2013-2019
Source: Brazil, IBGE, National Health Survey (PNS), 2013 and 201956

Brazil: Lorenz Curves for Households’ Drugs Expenditures: 2013-2019
Source: Brazil, IBGE, Family Budget Survey (POF) 2002/3 and 2017/1857

Finally, it is important to say that both policies for access to medicines — the direct spending of the SUS and the fiscal subsidy for medicines — can be progressive if they are designed in an integrated and complementary way to reduce inequities in access to and spending on medicines. But this has not been the case, given that fragmentation in design and implementation has been a constant feature of health policies in Brazil and in many Latin American countries.
Concentration Curves and Concentration Index of Families’ Pharmaceutical Spending in Brazil
This part will deal with how spending on medicines by families in Brazil can be translated into Lorenz curves and concentration indices. First, a visual analysis of the Lorenz curves for household expenditures on pharmaceutical products will be performed considering the years 2002/3 and 2017/18.
It is visible that, with the downward shift of the Lorenz curve between 2003 and 2018, there is a process of concentration of spending on medicines in Brazilian households, showing that the distance between spending on medicines by the poorest and the richest has increased in the country over these 15 years. The increase of this concentration process could be associated with the failures of the SUS in filling the gap of the public free or subsidized provision of pharmaceuticals for the poorest income groups.
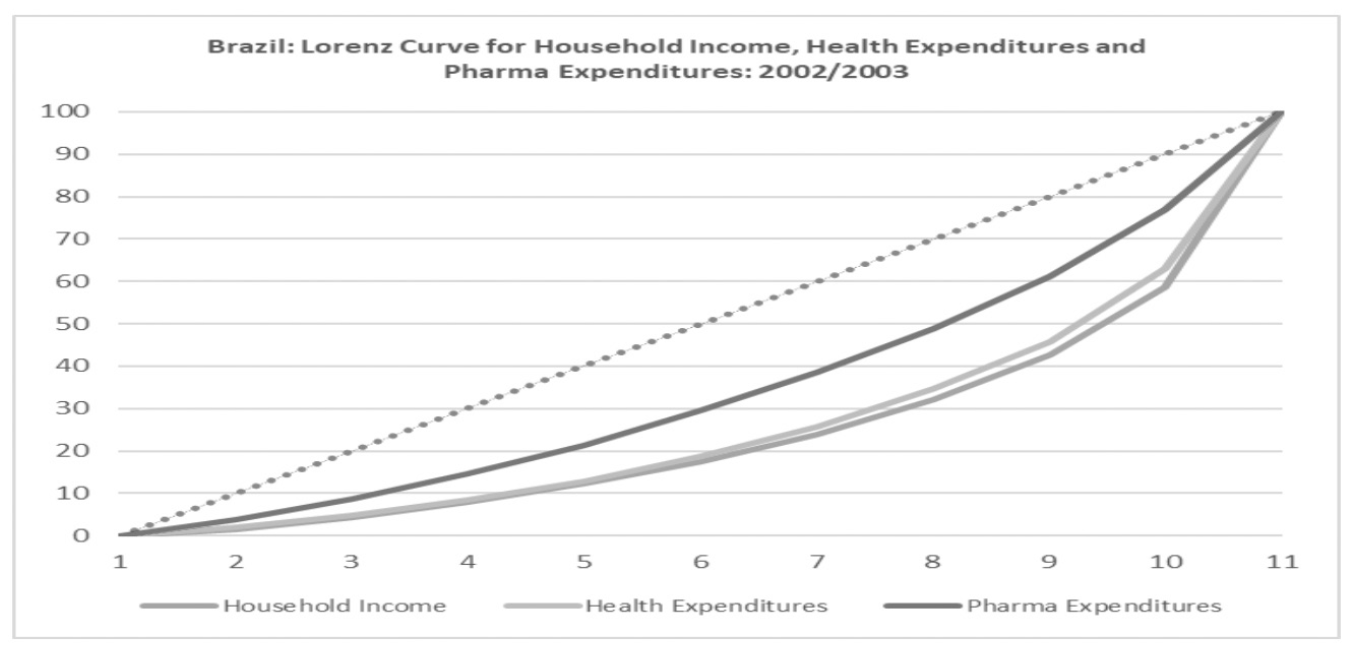
It is also important to see how the concentration of household spending on medicines can be compared with the concentration levels of available income of the families and total household spending on health. The difference on the concentration indexes associated with the household’s available income and pharmaceutical expenditures is important for the discussion about how the pharmaceutical expenditure is contributing (or not) for the income concentration in the country. The corresponding Lorenz curves associated with these variables can be seen in figures 22 and 23 for the years 2003 and 2018, respectively.
Brazil: Lorenz Curves for Households’ Income, Health Expenditures and Drugs Expenditures: 2002/2003 2013-2019
Source: Brazil, IBGE, Family Budget Survey (POF) 2002/358

Brazil: Lorenz Curves for Households’ Income, Health Expenditures and Drugs Expenditures: 2017/2018
Source: Brazil, IBGE, Family Budget Survey (POF) 2017/1859

A visual analysis of the two curves can demonstrate that in 2017/18 the Lorenz curve for spending on pharmaceutical products is closer to the Lorenz curves for total health spending and household disposable income, compared to what happened in 2002/3. Therefore, one can infer the hypothesis that spending on medicines has become an element of concentration of health spending and total family spending over time, increasing in all aspects the distances of well-being due to the deterioration of compared consumption patterns of the richest and poorest.
The objective measurement of the concentration indices of spending on medicines will be done by directly measuring the degree of concentration of this expenditure, expressed through the Gini Index,60 as well as through the analysis of the contribution of expenditures on medicines to the concentration of available income in the country, through of the Kakawani Index.61 The results for the analysis of the concentration indexes are shown in Table 1.
A first observation is that there was a slight deconcentrating of available family income between 2003 and 2018, because of distributive policies implemented in the period, such as income transfer programs (Bolsa Familia), extension of benefits to retired rural populations and appreciation of the minimum salary. As a result, the Gini coefficient referring to disposable family income fell from 0.498 to 0.468.62
A second finding is that household expenditures on health are less concentrated than household disposable income. In this case, there is also a slight reduction on the concentration of household health expenditures along these fifteen years, due to the distributive effects of public health programs, such as the SUS, which tended to reduce household expenditure on health costs.
There was a concentration of spending on pharmaceutical products by families, which occurred in the opposite direction, both for available income and household health expenditures. The Gini coefficient of spending on pharmaceuticals increased from 0.293 to 0.345 over this fifteen-year period. Finally, both household expenses and pharmaceuticals expenses are progressive in relation to the distribution of household income, that is, they help to reduce income inequalities. The positive Kakawani indices, both in 2003 and 2018 for these two types of household expenditures, show their positive contribution to reducing inequality in Brazil. However, it is worth highlighting, specifically in the case of spending on pharmaceuticals, that this contribution has been decreasing. Public policies on access to medicines should act so that these indices remain positive and increase their distance from nullity.
Gini Indexes and Kakawani Indexes Related to Household Expenditures in Health and in Pharmaceutical Products: Brazil 2003 and 2018

Source: Authors’ elaboration based on Brazil, IBGE, Family Budget Survey (POF) 2002/3 and 2017/1863
COSTA RICA: Is Out-of-Pocket Spending on Health Services and Medicines Regressive?
The average income in Costa Rica is close to 1,650 dollars. The average income of the richest quintile is 9 times the income of the first quintile. The Gini index of 0.42; showing a concentration of almost 50 percent of revenues in the last quintile. On the other hand, the average expenditure per household is 1,540 dollars per month.64
OOP expenditure on health in Costa Rica is $56 per month, which represents 3.6 percent of total household expenditure. This percentage is similar in all income quintiles; both in urban and rural areas.65 This apparent equity in households’ expenditures in Costa Rica is because the largest number of consultations and hospitalizations are carried out in the public system administered by the Costa Rican Social Security Fund, which has broad national coverage and good and progressive financial protection. Health expenditure comprises 58.4 percent on medical equipment and medicines; 38.3 percent in health services consultation and 3.3 percent in inpatient services.
Regarding expenditure on medicines, households spend an average of $26 per month, which represents 1.5 percent of household expenditure; a percentage that remains homogeneous across income quintiles. It is much lower in rural areas but in urban areas this expenditure is higher 1.6 percent versus 1.1.66
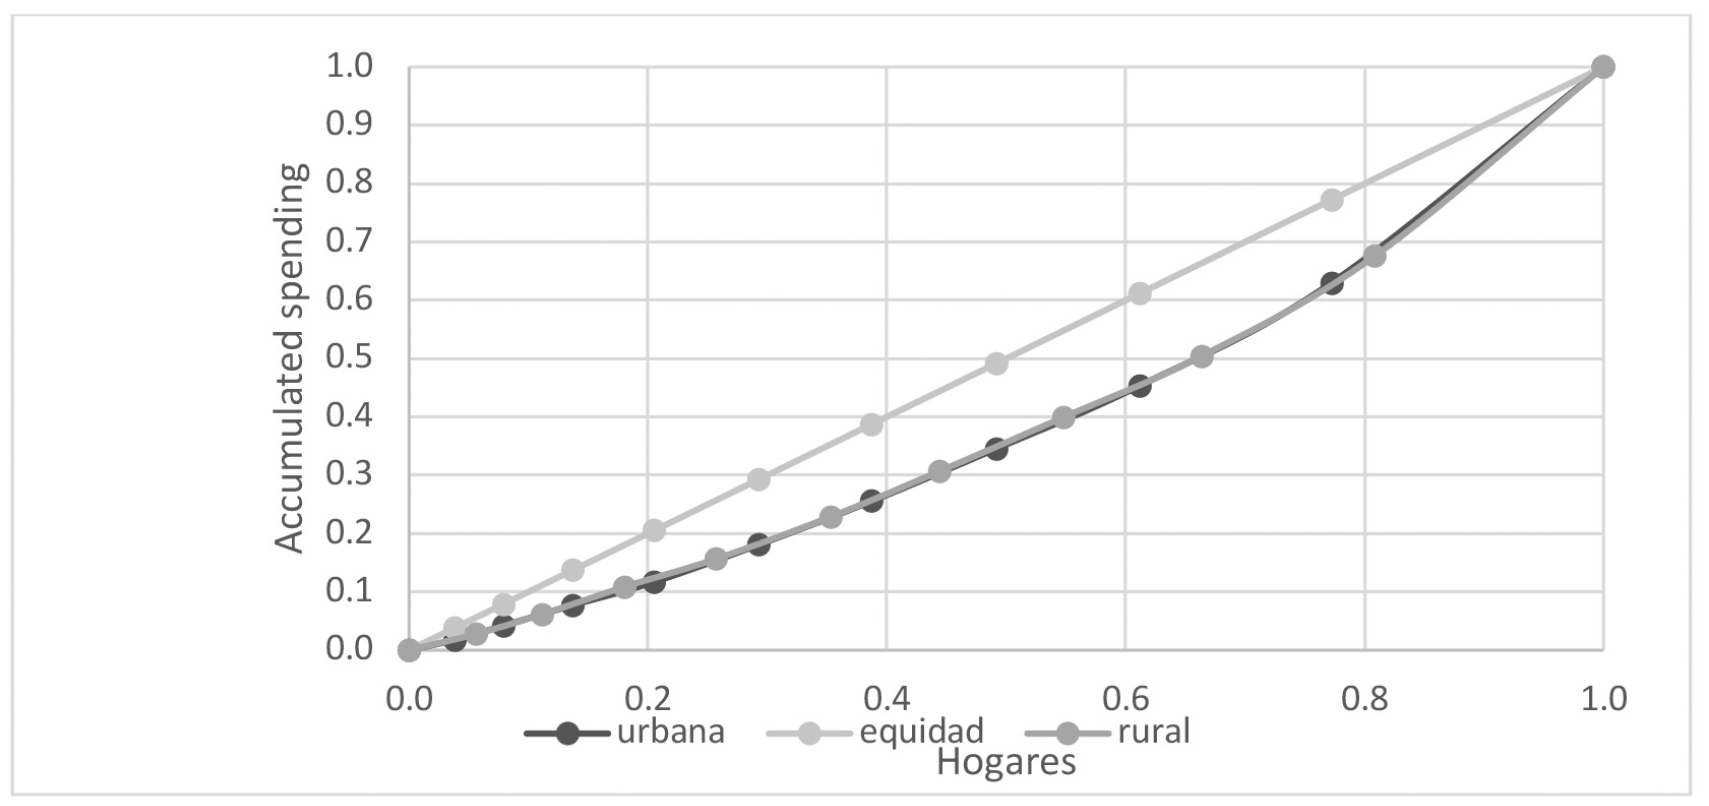
This area concentrates the largest number of people who do not have access to insurance because they are unemployed or are foreigners who do not meet the requirements for legal permanence in the country. In rural areas, the increase in spending on medicines is as expected, the higher the decile of income, the greater the out-of-pocket expenditure. The total Gini index on drug expenditure is 0.20, while in rural areas this index drops 0.13. (Figure 24 and 25)
Costa Rica: Average Health Care Expenditure by Income Quintile
Note: Exchange rate: 2018: 577
Source: Own elaboration based on the INEC ENIG 2018 Income and Expenditure Survey67

Costa Rica: Average Drug Expenditure by Income Quintile

Average Expenditure on Medicines According to Income Quintile by Level of Education of the Head of Household. Costa Rica 2022
(Average exchange rate 2018:577)
Source: Own elaboration based on the ENIG 2018 Income and Expenditure Survey, INEC68

Average Expenditure and % of Drug Expenditure on NCDs (average exchange rate of the year 2018:577)
Source: Based on the Income and Expenditure Survey. ENIG 2018, INEC69

Concentration Curve of Out-of-Pocket Expenditure on Medicines: Urban-Rural Costa Rica 2018
Source: Brazil, IBGE, Family Budget Survey (POF) 2017/1859


The expenditure on medicine increases as the educational level of the head of the household increases; it triples in households whose head has a university education; the expenditure on medicine increases as the income quintile increases, reaching 10 times in the highest quintile with respect to the first quintile; regardless of the educational level of the head of the household. There is an increasing trend in average spending on medicines as the income quintile increases regardless of educational level.
Drug spending on NCDs represents about 50 percent of income quintile and geographical area. According to the educational level of the head of household. College-educated heads spend almost three times as much as head of households with primary or secondary education (Figure 26).
Expenditures on medicines seem to be financially protected in low-income groups compared to the cases of Peru and Brazil. The Gini index shows low inequality with respect to drug spending, especially in rural areas.
Although the CCSS model offers more equitable access to medicines than other LAC countries, some trends could jeopardize this stable situation. First, the growing share of residents as illegal immigrants, without access to health insurance and unable to pay for medicine. Secondly, the rapid aging of the population associated with the escalation in the cost of health services and medicines in a scenario of greater resource constraints. Thirdly, the need to change the CCSS model including more promotion and prevention to avoid an excessive medicalization of health care in the country and to moderate an increasing behaviour of high use and high levels of prescription of medicines.
Conclusions and the Way Ahead
In the last two decades, some LAC countries have improved the population’s access to medicines because of the expansion of universal health coverage, by increased coverage through health insurance or tax-based health schemes. However, a large part of the LAC population is still not covered by prescribed medicines due to (a) lack of availability of pharmacies or health facilities nearby, (b) the drugs were not available in government facilities or private pharmacies, and (c) lack of money or willingness to pay.
In general, LAC experiences a regressive access and financing to medicines provision to the population according income levels. Despite that, access to drugs in LAC are not affordable for all population, and still a large proportion of population must pay a substantial proportion of their medicine needs.
Families in LAC pay at least one third of total expenses in medicines, and financial protection in drugs is still a challenge of the governments in the region. Most of the OOP expenditures in drugs are made for the highest income quintiles of the population, but in general poorest pay a higher proportion of their income in drugs than high income level quintiles. Clearly socioeconomic and education levels are key factors associated with better access to medicines. Costa Rica has built up a health care system with substantial equality in the access and financial protection with their lower income quintiles populations paying a lower proportion of their income in medicines compared to other countries.
A new generation of health policies are required in the region to respond effectively to the increasing aging and NCDs challenges that cause a greater need for medicines and more affordable. This implies not only better procurement and logistics of medicines but also setting up arrangements to improve access and reduce expenses of medicines from the most vulnerable and poorest populations. In addition, more regulation and stewardship are required to ensure affordable and prompt provision of medicines to the most vulnerable and needed.
New policies require addressing their sustainability, and how feasible is improving the efficiency and equity to access and financing of medicines and policies to reach populations in need due to lack of access or lack of ability to pay. Health outcomes are inequal due to low level of access and the high cost of drugs in chronic diseases, and most countries face this challenge. Effective direct distribution of drugs and tax subsidies to companies are one way used in some countries in the region such as Brazil increase health status of low-income segments of the population.
Note
The authors do not have any conflicts of interest to disclose.
Acknowledgments
We thank Roberto Iunes for his valuable comments on the initial conception of this paper, and Andres Plazolles and Jacqueline Castillo for their contributions with data processing for Peru and Costa Rica data sets. This paper received financial support from the Research Center at the Universidad del Pacifico.