Introduction
“Terahertz” is an unexplored frequency band in the sense that no commercially available microelectronic device can generate, detect, or manipulate electromagnetic waves over the entire terahertz frequency band.Reference Novoselov, Geim, Morozov, Jiang, Zhang, Dubonos, Grigorieva and Frisov1 In the past decade, therefore, development of compact, tunable, and coherent terahertz sources that operate at room temperature has been one of the hottest issues in modern terahertz electronics.Reference Novoselov, Geim, Morozov, Jiang, Zhang, Dubonos, Grigorieva and Frisov1
Graphene, a one-atom-thick planar sheet of sp Reference Novoselov, Geim, Morozov, Jiang, Katsnelson, Grigorieva, Dubonos and Firsov2-hybridized honeycomb carbon crystals, has attracted considerable attention because of its unique carrier-transport and optical properties.Reference Novoselov, Geim, Morozov, Jiang, Zhang, Dubonos, Grigorieva and Frisov1–Reference Geim and Novoselov4 The conduction and valence bands of graphene have a symmetrical conical shape around the Brillouin zone corners, which are called the K and K′ points, and contact each other at “Dirac points”. Electrons and holes in graphene have a linear dispersion relation with zero bandgap, resulting in peculiar features such as massless relativistic fermion behavior with backscattering-free ultrafast transport.Reference Novoselov, Geim, Morozov, Jiang, Katsnelson, Grigorieva, Dubonos and Firsov2–Reference Wakabayashi, Sigrist and Fujita8
In addition, optical or electrical pumping of graphene can dramatically alter its electromagnetic response at frequencies in the technologically underexploited terahertz range,Reference Ryzhii, Ryzhii and Otsuji9–Reference Ryzhii, Ryzhii, Mitin and Otsuji11 as a result of nonequilibrium dynamics of carrier relaxation and recombination. Specifically, the very fast energy relaxation of photoexcited electrons and holes through optical-phonon emission in graphene and their relatively slow recombination lead to population inversion over a wide energy range under sufficiently high pumping intensity. This population inversion, in which some higher-energy states contain more electrons than states below them, makes it possible to obtain negative dynamic conductivity in the terahertz spectral range.Reference Ryzhii, Ryzhii and Otsuji9–Reference Ryzhii, Ryzhii, Mitin and Otsuji11 Such negative conductivity can produce amplification, or gain, of electromagnetic signals in the appropriate frequency range and, in a well-designed cavity structure, could enable graphene-based coherent laser sources of terahertz radiation.Reference Ryzhii, Ryzhii, Mitin and Otsuji11–Reference Ryzhii, Dubinov, Otsuji, Mitin and Shur14
These unique features of graphene materials can be exploited to develop many high-performance terahertz devices including photodetectors and phototransistors, plasmonic oscillators, fast modulators, and harmonic-frequency generation and conversion devices. This article reviews recent advances in graphene-based materials and devices for terahertz science and technology.
Heteroepitaxial graphene-on-silicon (GOS) technology
From the technological point of view, synthesis and growth of high-quality graphene is critical. Thermal decomposition of epitaxially grown hexagonal SiC on a SiC substrate is a promising synthesis technology for epitaxial graphene (EG).Reference de Heer, Berger, Wu, First, Conrad, Li, Li, Sprinkle, Hass, Sadowski, Potemski and Martinez15 (See the articles in this issue by Ruan et al., Nyakiti et al., Bartelt and McCarty, Starke et al., and Wong et al. for more information about epitaxial graphene.) Epitaxial graphene is formed on hexagonal SiC crystals by silicon sublimation during ultrahigh-vacuum annealing. Such an epitaxial growth method can provide a definite graphene crystal orientation, which is mandatory for use in ultrahigh-frequency optoelectronic devices whose operations rely on superior carrier-transport properties.
Because EG synthesis is more amenable than exfoliation to mass production, it is likely to have a greater impact on industrial applications. The drawbacks of EG, however, are the limited diameter of available SiC substrates and their high current prices. For practical use of graphene in electronics, the formation of graphene on silicon substrates, if it proves possible, would be the most promising approach.
With this motivation, we developed a heteroepitaxial graphene-on-silicon (GOS) materials-synthesis technology.Reference Suemitsu, Miyamoto, Handa and Konno16–Reference Fukidome, Abe, Takahashi, Imaizumi, Inomata, Handa, Saito, Enta, Yoshigoe, Teraoka, Kotsugi, Ohkouchi, Kinoshita, Ito and Suemitsu19 The first step in the GOS process is the heteroepitaxy of SiC on silicon substrates. Instead of the conventional silane/propane two-source system, a single source of monomethylsilane (SiCH6) was introduced to grow a single-domain SiC film at relatively low temperatures (∼1000°C) under a vacuum of 10–4 Torr.Reference Suemitsu and Fukidome17 Cubic 3C-SiC is the only polytype that grows on silicon substrates, not the hexagonal SiC phases that have been extensively explored for epitaxial graphene growth. Fortunately, the surface crystallographic structures of cubic 3C-SiC(111) and hexagonal 6H-SiC(0001) are identical, so that hexagonal graphene can be synthesized by sublimation of silicon from cubic 3C-SiC(111).Reference Suemitsu and Fukidome17
Further study of GOS growth in terms of chirality and crystal orientation has been carried out.Reference Fukidome, Takahashi, Abe, Imaizumi, Handa, Kang, Karasawa, Suemitsu, Otsuji, Enta, Yoshigoe, Teraoka, Kotsugi, Ohkouchi, Kinoshita and Suemitsu18, Reference Fukidome, Abe, Takahashi, Imaizumi, Inomata, Handa, Saito, Enta, Yoshigoe, Teraoka, Kotsugi, Ohkouchi, Kinoshita, Ito and Suemitsu19 It was found that graphene can be grown on various crystal orientations of the silicon substrate: 3C-SiC(111)/Si(111), 3C-SiC(110)/Si(110), 3C-SiC(100)/Si(110), and 3C-SiC(111)/Si(110). The authors’ findings on this growth method include the influence of the substrate orientation on the graphene–SiC interface structure and on the stacking of multiple graphene layers.
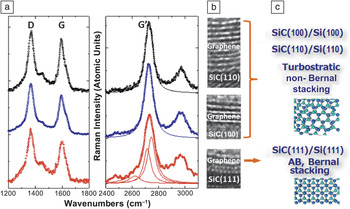
Figure 1 a shows the Raman spectra at the D, G, and G′ bands of graphene grown on SiC(110)/Si(110), SiC(100)/Si(100), and SiC(111)/Si(111). Figure 1b shows the corresponding transmission electron microscope images. The G′ band, in particular, is related to the intrinsic electronic structure of graphene, because it originates from an intervalley double-resonant process involving excitation and de-excitation of an electron and two in-plane transverse optical phonons in the vicinity of the K and K′ points. Interlayer interactions can break the symmetry and split the electronic band, which can readily be detected in the splitting of the G′ band into multiple peaks.
(a) Raman spectra and (b) transmission electron microscope images of heteroepitaxial graphene on SiC(110)/Si(110) (top), SiC(100)/Si(100) (middle), and SiC(111)/Si(111) (bottom), along with (c) schematic plan-view representations of the differences in their stacking formations. Adapted from References 18 and 19.

For Si(111) growth, the G′ band exhibits multiple peak components.Reference Fukidome, Takahashi, Abe, Imaizumi, Handa, Kang, Karasawa, Suemitsu, Otsuji, Enta, Yoshigoe, Teraoka, Kotsugi, Ohkouchi, Kinoshita and Suemitsu18, Reference Fukidome, Abe, Takahashi, Imaizumi, Inomata, Handa, Saito, Enta, Yoshigoe, Teraoka, Kotsugi, Ohkouchi, Kinoshita, Ito and Suemitsu19 This shows that the graphene is stacked in a Bernal manner, so that multilayer graphene on this substrate is semiconducting with nonzero carrier masses. In contrast, when a Si(100) or Si(110) substrate is used, the G′ band shows a single peak. This Raman spectrum, in conjunction with the low-energy electron diffraction pattern (not shown), shows that the stacking is non-Bernal and turbostratic (i.e., the stacking is not chiral and the honeycomb lattice is stacked on top with random rotational angle), and the graphene on this surface is metallic.Reference Fukidome, Takahashi, Abe, Imaizumi, Handa, Kang, Karasawa, Suemitsu, Otsuji, Enta, Yoshigoe, Teraoka, Kotsugi, Ohkouchi, Kinoshita and Suemitsu18, Reference Fukidome, Abe, Takahashi, Imaizumi, Inomata, Handa, Saito, Enta, Yoshigoe, Teraoka, Kotsugi, Ohkouchi, Kinoshita, Ito and Suemitsu19
Even for multilayered graphene, each layer preserves the optoelectronic properties of monolayer graphene. This characteristic provides a fundamental advantage for terahertz photonic device applications, in that the quantum efficiency can be increased in proportion to the number of stacked layers while still preserving the gapless and linear energy spectrum.Reference Ryzhii, Ryzhii, Mitin and Otsuji11, Reference Ryzhii, Ryzhii, Satou, Otsuji, Dubinov and Aleshkin13, Reference Ryzhii, Dubinov, Otsuji, Mitin and Shur14
Carrier relaxation/recombination dynamics and terahertz gain
Ultrafast carrier dynamics in optically or electrically pumped graphene
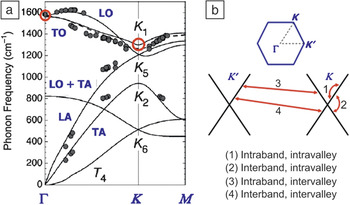
The unusual optical properties of photoexcited carriers in graphene reflect the structures of both the electronic and vibrational bands. The honeycomb lattice of graphene is formed with strong in-plane covalent bonds of carbons having a low atomic mass, giving rise to extremely high optical-phonon energies, ∼198 meV (1600 cm–1) at the zone center Γ and ∼163 meV (1315 cm–1) for the transverse mode at the zone edges K and K′, as shown in Figure 2aReference Suzuura and Ando20, Reference Maultzsch21 (also see the article in this issue by Pop et al.). Carrier–phonon interactions, through intravalley and intervalley as well as intraband and interband processes, as shown in Figure 2b, play a dominant role in cooling photoelectrons and photoholes, which leads to ultrafast nonequilibrium energy relaxation processes in graphene.
(a) Phonon band diagram of graphene. The identified modes are as follows: LA, longitudinal acoustic; LO, longitudinal optical; TA, transverse acoustic; TO, transverse optical. The red circles show the phonons that interact with carriers. (b) Interaction of optical phonons and carriers through intervalley, intravalley, interband, and intraband transitions. Adapted from Reference Reference Maultzsch21.

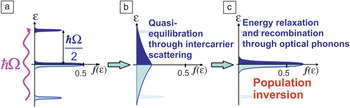
Carrier relaxation and recombination dynamics in optically pumped graphene are shown schematically in Figure 3. After the electrons and holes are first photogenerated with high energies (Figure 3a), collective excitations due to carrier–carrier scattering result in ultrafast carrier quasi-equilibration among the electron and hole populations separately, within a time scale of 10–100 fs (Figure 3b).22–25 At this point, the quasi-Fermi level for electrons (holes) is below (above) the Dirac point (which is the position of the Fermi level in undoped graphene). Then, carriers in the high-energy tails of their distributions emit optical phonons, cooling the entire population and accumulating around the Dirac point (Figure 3c).Reference Dawlaty, Shivaraman, Chandrashekhar, Rana and Spencer22–Reference Rana, George, Strait, Dawlaty, Shivaraman, Chandrashekhar and Spencer25 Because of the fast intraband relaxation (picosecond or less) and relatively slow interband recombination (≫1 ps) of photoelectrons and holes, large excesses of electrons and holes build up just above and below the Dirac point, respectively. With sufficiently intense excitation, a population inversion can be achieved, as seen in Figure 3c (mathematically indicated by an average electron and hole occupation greater than 0.5), leading to the potential for stimulated emission as in lasers.Reference Satou, Otsuji and Ryzhii26
Carrier relaxation and recombination dynamics in optically pumped graphene at room temperature, showing the evolution of f(ε), the fraction of states at energy ε that are occupied. The horizontal axis indicates the Fermi energy, which is at the Dirac point in undoped graphene. The medium blue regions represent photoexcited or thermally excited electrons, and the light blue regions represent holes. (a) Optical excitation creates an electron and a hole, each with one-half of the photon energy, ħΩ. (b) Scattering among carriers redistributes this energy to create hot thermal distributions of electrons and holes. (c) Optical-phonon emission cools the carriers, allowing population inversion in which some states above the Fermi level, with f(ε) > 0.5, contain more electrons than some states, with 1 – f(ε) < 0.5 electron occupancy, below the Fermi energy.

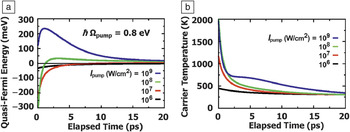
After quasi-equilibration, the energy distributions of both the electrons and holes can be characterized by the usual Fermi–Dirac function, but with a modified temperature and a nonzero quasi-Fermi energy εF (relative to the Dirac point). Figure 4a–b shows the simulated time evolution of these quantities after graphene is pumped at t = 0 with a pulse of light with a photon energy of 0.8 eV. In this simulation, all of the scattering mechanisms shown in Figure 3 are taken into account. The calculated carrier energy relaxation times (inverses of the scattering rates) for the various mechanisms range from subpicoseconds to picoseconds, depending on the carrier and optical-phonon energies, the populations, and the initial and final states of carriers.26
Simulated temporal evolution of the (a) quasi-Fermi energy and (b) carrier temperature in graphene after a pulse of pump light at time t = 0. These two quantities characterize the energy distribution of photoexcited electrons (and also holes, given that, in undoped graphene, the two carriers are symmetrical) once the electron and hole populations have separately come into internal thermal equilibrium. Adapted from Reference Reference Satou, Otsuji and Ryzhii26.

The following trends can be observed: (1) Immediately after the pumping (t ≈ 0 ps), εF instantaneously falls due to carrier–carrier scattering (corresponding to Figure 3b). (2) Then, εF increases rapidly as a result of carrier cooling due to emission of optical phonons by carriers in the high-energy tails. (3) If the pumping intensity exceeds a certain threshold level, εF becomes positive (for both electrons and holes), so the population is inverted (corresponding to Figure 3c). After that, the recombination process continues more slowly (∼10 ps).
Negative terahertz conductivity and amplified stimulated emission
Population inversion is a prerequisite for gain. However, to achieve gain for any particular frequency of electromagnetic radiation, population inversion must overcome Drude absorption by free carriers.
The gain at angular frequency ω is determined by the real part of the net dynamic conductivity,  ${\rm{Re \sigma }}_{\rm{\omega }} $, which is proportional to the absorption of photons with that angular frequency. Specifically, negative values of
 ${\rm{Re \sigma }}_{\rm{\omega }} $ correspond to gain.
 ${\rm{Re \sigma }}_{\rm{\omega }} $ consists of intraband (
 ${\mathop{\rm Re}\nolimits} {\rm{ \sigma }}_{\rm{\omega }}^{{\mathop{\rm intra}\nolimits} }$) and interband (
 ${\mathop{\rm Re}\nolimits} {\rm{ \sigma }}_{\rm{\omega }}^{{\mathop{\rm inter}\nolimits} }$) contributions and is given byReference Ryzhii, Ryzhii and Otsuji9
 $$\displaylines{ {\rm{Re \sigma }}_{\rm{\omega }} = {\rm{Re \sigma }}_{\rm{\omega }}^{{\mathop{\rm inter}\nolimits} } + {\rm{Re \sigma }}_{\rm{\omega }}^{{\mathop{\rm intra}\nolimits} } \cr \approx {{e^2 } \over {4\hbar }}(1 - 2f_{\hbar {\rm{\omega }}} ) + {{(\ln 2 + {\rm{\varepsilon }}_{\rm{F}} /2k_{\rm{B}} T)e^2 } \over {{\rm{\pi }}\hbar }}{{k_{\rm{B}} T{\rm{\tau }}_{\rm{m}} } \over {\hbar (1 + {\rm{\omega }}^2 {\rm{\tau }}_{\rm{m}} ^2 )}}{\rm{,}} \cr} $$
where e is the elementary charge, ħ is the reduced Planck constant, fħ ω is the Fermi distribution function at energy ħω, k B is the Boltzmann constant, T is the temperature, and τ m is the momentum relaxation time of carriers. The intraband contribution,  ${\mathop{\rm Re}\nolimits} {\rm{ \sigma }}_{\rm{\omega }}^{{\mathop{\rm intra}\nolimits} }$, corresponds to the Drude absorption and is always positive, contributing as a loss, although this contribution becomes less important for ω > 1/τm.
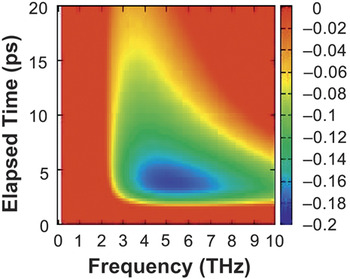
Typical simulated results for  ${\rm{Re \sigma }}_{\rm{\omega }} $ are shown in Figure 5 as a function of time and frequency at a fixed pump fluence of 8 μJ/cm2 (intensity of 1 × 10⁸ W/cm2 and pulse duration of 80 fs [full width at half-maximum]) with a momentum relaxation time of τ m = 3.3 ps.Reference Satou, Boubanga Tombet, Otsuji and Ryzhii27 It can be clearly seen that, even at room temperature, a broad terahertz gain bandwidth from ∼2.2 THz to 10 THz is obtained on the picosecond time scale after pumping.
Simulated time evolution of the terahertz dynamic conductivity of graphene after pulsed pumping at a fixed pump fluence of 8 μJ/cm2 (intensity of 1 × 10⁸ W/cm2 and pulse duration of 80 fs [full width at half-maximum]). The pump-photon energy and carrier momentum relaxation time τm were assumed to be 0.8 eV and 3.3 ps, respectively. The conductivity values were normalized to the quantum conductivity [e 2/(4ħ)]. The red color encompasses positive values as well as small negative values. After the initial carrier relaxation, a spectral window temporarily appears, at frequencies high enough to avoid free-carrier absorption, that has negative conductivity (not red) and thus potential power gain.

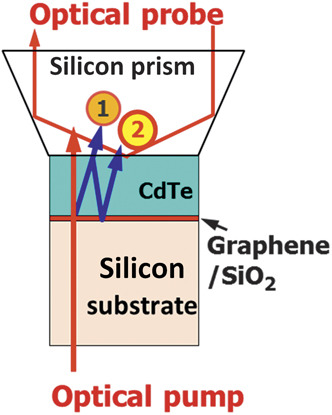
We used time-domain spectroscopic studies to show that a graphene sheet can amplify an incoming terahertz field.Reference Otsuji, Boubanga-Tombet, Chan, Satou and Ryzhii28–Reference Karasawa, Komori, Watanabe, Satou, Fukidome, Suemitsu, Ryzhii and Otsuji30 The novel pump/probe geometry is shown in Figure 6. In this setup, a single 80-fs, 1550-nm, 4-mW, 20-MHz-repetition-rate beam from a fiber laser is split into two parts: one for optical pumping and generation of the terahertz probe beam in a CdTe crystal and the other for optical probing of the terahertz field. The delay of the optical probe relative to the arrival of the pump pulse can be swept through the time domain of interest. The terahertz probe pulse double-reflects to stimulate terahertz emission in graphene, which is detected as a second, delayed terahertz signal.
Geometry for the observation of amplified terahertz emission from optically pumped graphene. When the pump (thick red arrow) enters CdTe, it generates a terahertz wave (blue arrow labeled “1”) that is measured by electro-optic sampling using an optical probe (thin red arrow). Some of the terahertz wave is reflected and then reflected again from the substrate (blue arrow labeled “2”). This second terahertz pulse is delayed by the round-trip transit time through the CdTe, allowing it to be probed separately. Adapted from Reference Reference Boubanga-Tombet, Chan, Watanabe, Satou, Ryzhii and Otsuji29.

For our experiments, a high-quality exfoliated monolayer-graphene/SiO2/silicon sample, having a surface potential variance of 4.05 meV and a Dirac voltage close to zero, indicating very little doping,28was placed on the stage. A 120-μm-thick CdTe(100) crystal placed on the sample acted as both a terahertz probe pulse emitter and an electro-optic sensor.
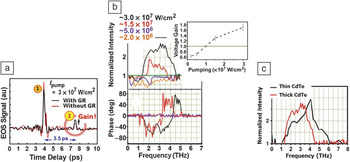
Figure 7a shows the measured temporal response.Reference Otsuji, Boubanga-Tombet, Chan, Satou and Ryzhii28 The second pulse, the doubly reflected terahertz signal, is more intense with graphene present than without it. This indicates that graphene acts as an amplifying medium in the terahertz frequency range. As shown in the inset of Figure 7b, the emission spectra exhibit threshold-like behavior as a function of laser pumping intensity, attesting to the occurrence of negative conductivity and population inversion in graphene.29A normal dispersion, in which the phase changes sign across the gain peak, testifies to the occurrence of amplification attributed to stimulated emission of photocarriers in the inverted state.
(a) Temporal responses to an optical pulse,Reference Otsuji, Boubanga-Tombet, Chan, Satou and Ryzhii28 measured using electro-optic sampling (EOS), for samples with and without graphene (GR) at the substrate–CdTe interface. Graphene has little effect on the terahertz pulse generated by the first passage of the pump (“1,” see Figure 6), but the delayed, doubly reflected pulse (“2”) samples the graphene after pump-excited carriers have equilibrated, and its increased amplitude demonstrates the gain of photoexcited graphene in the terahertz spectral region. (b) Gain spectra obtained by Fourier transforming the temporal responses of the second pulse, normalized to the frequency response without graphene. The inset shows that power gain appears only for sufficient pump power.Reference Boubanga-Tombet, Chan, Watanabe, Satou, Ryzhii and Otsuji29 (c) Comparison of the measured gain spectra for terahertz-probe delays of 2.0 ps (with a thin CdTe crystal) and 3.5 ps (with a thick CdTe crystal). The shorter delay in the thinner crystal allows the reflected teraherz pulse to arrive earlier, when there are more unrecombined (but already quasi-equilibrated) photoexcited carriers to create gain.

The observed voltage gain exceeded the calculated maximum value of 1.011 (= $\sqrt {1.023}$) determined by the absorbance of monolayer graphene (2.3%). Part of this discrepancy could result from experimental artifacts. For example, the ∼70% reflection of the terahertz probe pulse at the SiO2–silicon interface will also interact with graphene and be amplified. Because the round-trip delay in the 300-nm-thick SiO2 layer is ∼4 fs, almost no distortion is seen in the temporal response. This multipath reflection effect can at most double the gain but cannot fully explain the observed large discrepancy in the gain. Another effect arises from the pumping-induced increase in substrate reflectivity due to photocarrier-dependent Drude conductivity. For a graphene/SiO2/silicon sample, whose silicon substrate has a low resistivity of 0.005 Ω cm, the reflectivity increase is as small as 1–2% and quite monotonic over the entire terahertz spectral range of interest. Thus, a small percentage of the increase in reflectivity should be subtracted from the obtained photon echo signal, but this would barely affect the gain spectral profile.Reference Boubanga-Tombet, Chan, Watanabe, Satou, Ryzhii and Otsuji29
We also conducted a similar experiment with a thinner (80-μm-thick) CdTe crystal to shorten the terahertz-probe delay time from the original 3.5 ps to 2.0 ps, which is the timing giving the largest negative conductivity and, hence, the greatest gain spectral width, according to Figure 5.Reference Boubanga-Tombet, Chan, Watanabe, Satou, Ryzhii and Otsuji29 The gain spectra of these two cases are plotted in Figure 7c. The emission spectra are clearly broader (in particular, at the higher-frequency end) for a terahertz-probe delay time of 2 ps. This tendency coincides with the simulated results in Figure 5, providing clear evidence of the nonequilibrium relaxation dynamics of the quasi-Fermi energy reflecting a population inversion.
Toward terahertz graphene injection lasers
When installed in a proper terahertz cavity as a gain medium, graphene is expected to lase. Because the electronic transitions arise from the π-electron sheets, the electric field vector of the emitted terahertz photons must lie within the graphene plane. This permits gain for terahertz photons propagating either perpendicular or parallel to the graphene plane. Therefore, structures with both verticalReference Dubinov, Aleshkin, Ryzhii, Otsuji and Ryzhii12, Reference Ryzhii, Ryzhii, Satou, Otsuji, Dubinov and Aleshkin13 and waveguide-typeReference Ryzhii, Dubinov, Otsuji, Mitin and Shur14 cavities can be used to construct a graphene terahertz laser. From the viewpoint of higher quantum efficiency and hence lower pumping threshold, a waveguide cavity is superior because it can have a larger volume of gain overlap, distributed along the length of the cavity in which the terahertz photons propagate.
Figure 8a–b depicts simulated room-temperature gain spectra in different geometries of a slot-line waveguide cavity structure that includes a 20-layer non-Bernal-stacked graphene sample.Reference Ryzhii, Dubinov, Otsuji, Mitin and Shur14 The cross-sectional electric field distribution is also shown for one geometry. The width of the slot line was fixed at 15 μm, whereas the depth of the cavity was treated as a parameter. The quasi-Fermi energy that defines the level of population inversion was set in the calculations at a feasible level of 30 meV.
(a) The bottom image shows the simulated distribution of the terahertz electric field, E ω, in a slot-line waveguide laser structure with multiple graphene layers (GLs) on top, for a slot width of D = 15 μm and a substrate (cavity) thickness of W = 25 μm. In the envisioned operation, GLs in the slot are illuminated from the top with photons of energy ħΩ to provide gain to a terahertz wave traveling in the plane of the image. (b) Calculated frequency dependence of the terahertz gain coefficient in laser structures consisting of K = 20 GLs and the having quasi-Fermi energy of the topmost GL  ${\rm{\varepsilon }}_{\rm{F}}^{\rm{T}} = 30{\rm{ meV}}$, for different cavity thicknesses. Adapted from Reference Reference Ryzhii, Dubinov, Otsuji, Mitin and Shur14.

Depending on the cavity thickness in the range of 12–25 μm, the gain coefficient reached a peak value ranging from 2 to 8 cm–1at 2–3 THz, whereas its lower (higher) cutoff frequencies fell in the range of 1.5–2.2 THz (3.5–7.6 THz). If the number of graphene layers could be increased to ∼100, the gain factor would increase by one order of magnitude.Reference Ryzhii, Dubinov, Otsuji, Mitin and Shur14
To assess the practicality of the graphene terahertz laser structure, consider a distributed-feedback laser-cavity structure similar to that demonstrated for a terahertz quantum-cascade laser,Reference Williams, Kumar, Hu and Reno31 in which the gain coefficient of the slot-line waveguide is spatially and periodically modulated. We assume front and back mirrors having a feasible reflectance of ∼85% and a waveguide loss, including radiative loss and free-carrier absorption, of ∼10 cm–1. A 1-mm-long laser cavity can then provide a net gain of ∼5 (∼7 dB), which is sufficient to realize lasing.
Optical pumping with rather high photon energy, on the order of a few electronvolts, significantly heats the carriers, as shown in Figure 3b, which dramatically increases the pumping threshold required to achieve population inversion.Reference Ryzhii, Ryzhii, Mitin and Otsuji11, Reference Dubinov, Aleshkin, Ryzhii, Otsuji and Ryzhii12, Reference Satou, Otsuji and Ryzhii26 However, decreasing the pump-photon energy suppresses carrier heating. For example, for a decrease in pump-photon energy from 0.8 eV to 0.2 eV (such as for CO2gas lasers or terahertz quantum-cascade lasers), the maximum carrier temperature is suppressed from ∼1400 K to below ∼450 K. Population inversion then occurs from the earliest time after pumping at deeper levels, reducing the pumping threshold.
Current injection is a better solution because such electrical pumping can provide any pumping energy, even below a few millielectronvolts, thus reducing heating. In traditional semiconductor laser diodes,Reference Ryzhii and Ryzhii10, Reference Ryzhii, Ryzhii, Mitin and Otsuji11 a narrow-bandgap intrinsic (“i”) active region is sandwiched between wide-bandgap p- and n-type regions. Forward biasing the p–i–n diode injects carriers into the i region at the fixed energy levels of the band edges, leading to population inversion between the conduction and valence bands. Similarly, in quantum-cascade laser diodes, forward bias injects carriers into the upper subbands of multiple quantum wells in a superlattice heterostructure, leading to population inversion between the subbands. In both cases, the population inversion occurs between fixed energy levels that are defined by the bandgap or subbandgap energies, and majority carriers (electrons in n-type regions or holes in p-type regions) are originally introduced by donor or acceptor impurity doping.
In contrast, the lack of a bandgap in graphene means that the energy levels that contain the inverted carrier populations are not fixed. Moreover, so far, no mature impurity doping technique has been developed for graphene. One must therefore consider how to define the energy levels at which the carrier populations are inverted and how to realize a p–i–n junction.
We have proposed a device with a dual-gate structure that can solve these issues.Reference Ryzhii and Ryzhii10, Reference Ryzhii, Ryzhii, Mitin and Otsuji11Figure 9 a shows the structure and band diagram of a dual-gate graphene-channel field-effect transistor (FET).Reference Ryzhii, Ryzhii, Mitin and Otsuji11 Applying opposite-polarity biases to the dual gates (i.e., V G1 = –V G, V G2 = +V G) attracts holes (electrons) beneath gate G1 (G2), making a p–i–n junction in the graphene channel.
(a) Schematic drawings of proposed dual-gate field-effect transistor structure for electrically pumping graphene to create lasers at terahertz frequencies. Opposite biases on the two gates, G1 and G2, create an effective p-type/intrinsic/n-type diode. A small bias between drain D and source S allows holes and electrons to flow from under the gates into the intrinsic region between the gates. Sufficient injection will create population inversion in this region and thus the possibility of optical gain for photons of energy ħω0. The band diagram on the bottom shows how the dual gate biases, with the same magnitude but opposite polarity, attract electrons and holes and thereby generate equal quasi-Fermi levels μi in the n-type and p-type regions. Both types are injected into the intrinsic section by the drain–source bias, which is split equally on the two sides, resulting in equal quasi-Fermi energies μ in the intrinsic section. As shown, a positive drain–source bias shifts the electron quasi-Fermi energy up by μ and the hole quasi-Fermi energy down by μ, resulting in population inversion. (b) Simulated real parts of the terahertz conductivities (negative values corresponding to gain) of monolayer graphene at 300 K. The axis unit is normalized to the quantum conductivity. The parameter  ${\rm{\eta }}_{\rm{o}}^{{\rm{decay}}}$is the optical-phonon decay factor described in the text. Adapted from Reference Reference Ryzhii, Ryzhii, Mitin and Otsuji11.

In the intrinsic section, both electrons and holes are injected, as follows: If a slight dc drain-to-source (DS) bias is applied, V DS = +V D (V D > 0), the quasi-Fermi levels of electrons and holes in the intrinsic section will split by V D, resulting in population inversion. Injected electrons and holes can recombine through optical-phonon-assisted interband indirect transitions, Auger processes, and/or radiative direct transitions, contributing to spontaneous terahertz photon emission when V Dis on the order of millivolts to tens of millivolts, with little of the extra heating that occurs during optical pumping.
Electrons (holes) in the intrinsic section are confined by the built-in potential between the p and i (n and i) regions. Carriers can escape either by thermal excitation over this barrier (thermionic current) or by interband quantum-mechanical tunneling through the barrier, which reflects the gapless band structure of graphene.Reference Ryzhii, Ryzhii and Otsuji32 Thermionic and tunneling currents are the major factors that prevent population inversion and reduce the injection efficiency. When the space between the dual-gate electrodes is wide enough, the tunneling current can be suppressed far below the thermionic current,Reference Ryzhii and Ryzhii10, Reference Ryzhii, Ryzhii, Mitin and Otsuji11 which is a key to maximizing the injection efficiency and, hence, minimizing the threshold lasing current.
Figure 9b shows typical simulated dynamic conductivity of a dual-gate structure having a dual-gate spacing of 20 μm for different bias conditions at room temperature.Reference Ryzhii, Ryzhii, Mitin and Otsuji11 In this simulation, a carrier injection with a density of 1012 cm–2, an interband optical-phonon emission rate of 10 ps, and a carrier momentum relaxation time of 3.3 ps was assumed. The optical-phonon decay factor,  ${\rm{\eta }}_{\rm{o}}^{{\rm{decay}}}$, which affects the carrier cooling speed,Reference Ryzhii, Ryzhii, Mitin, Satou and Otsuji33 and the drain bias, V D, were taken as parameters. The value
 ${\rm{\eta }}_{\rm{o}}^{{\rm{decay}}} = 2$ occurs when graphene is attached to a conductive substrate with a high thermal conductivity, whereas
 ${\rm{\eta }}_{\rm{o}}^{{\rm{decay}}} = 10$ applies when graphene is suspended in free space. It can be clearly seen that, for
 ${\rm{\eta }}_{\rm{o}}^{{\rm{decay}}} = 2$ and V D= 0.075 V (75 mV), negative dynamic conductivity can be obtained over a very wide frequency range from 2 THz to ∼18 THz. These simulation results are encouraging with respect to the creation of graphene terahertz injection lasers that operate at room temperature.
Two-dimensional plasmons in graphene structures
The collective excitation of two-dimensional charge-density waves in graphene, which are called plasma waves, can provide unique features in their response to terahertz electromagnetic radiation, such as negative terahertz conductivity. The dispersion relations for plasmons, as the quantum excitations of plasma waves are called, have been formulated in two graphene structures: a gated planar graphene structure and a graphene microribbon array structure.Reference Ryzhii, Satou and Otsuji34, Reference Popov, Yu Bagaeva, Otsuji and Ryzhii35 Terahertz plasmon modes in the latter structure were experimentally observed to verify the theoretical dispersion relations.Reference Fukushima, Chan, Boubanga-Tombet, Ryzhii, Popov and Otsuji36–Reference Yu. Nikitin, Guinea, Garcia-Vidal and Martin-Moreno39
Nonlinear behaviors of terahertz plasmons in the structures of a graphene slot waveguideReference Dubinov, Aleshkin, Mitin, Otsuji and Ryzhii40 and planar graphene with a metal meshReference Takatsuka, Sano, Ryzhii and Otsuji41 under optical pumping have been examined by our group. We discovered theoretically that the nonlinearity leads these structures to exhibit gain over a wide terahertz range so that they can act as amplifying media for terahertz radiation when graphene is driven to carrier population inversion.Reference Dubinov, Aleshkin, Mitin, Otsuji and Ryzhii40, Reference Takatsuka, Sano, Ryzhii and Otsuji41 Indeed, waveguiding the terahertz emitted waves with low attenuation is another key issue for the creation of a graphene terahertz laser.
Rana et al. also performed theoretical studies of the effects of ultrafast carrier generation and recombination dynamics on plasmon emission and absorption in grapheneReference Rana, George, Strait, Dawlaty, Shivaraman, Chandrashekhar and Spencer42 and terahertz conductivityReference Rana43 of the dual-gate graphene FET structuresReference Ryzhii and Ryzhii10, Reference Ryzhii, Ryzhii, Mitin and Otsuji11 and revealed the possibility of graphene plasmonic terahertz oscillators. These findings could lead to new types of room-temperature coherent terahertz light sources such as graphene injection terahertz lasers.
New aspects of graphene terahertz science and technology
Terahertz spectroscopic studies on graphene carrier dynamics
As already discussed, time-resolved measurements reveal ultrafast nonequilibrium carrier relaxation dynamics of multilayers and monolayers of graphene.Reference Dawlaty, Shivaraman, Chandrashekhar, Rana and Spencer22–Reference Breusing, Ropers and Elsaesser24 At room temperature, intraband carrier–carrier scattering brings the carrier energy distribution into quasi-equilibrium on an ultrafast time scale; this is followed by optical-phonon emission that cools the carriers. For electron–hole recombination, the gapless, symmetrical band structure allows optical-phonon-assisted or direct radiative recombination.
Interband carrier–carrier scattering, such as Auger processes (imparting energy to a third carrier) and impact ionization (creating electron–hole pairs), have been thought to be theoretically forbidden in graphene.Reference Foster and Aleiner44 However, such processes can occur as a result of higher-order many-body effects or crystal imperfections, which could also strongly modify the carrier relaxation dynamics.Reference Strait, Wang, Shivaraman, Shields, Spencer and Rana45, Reference Winzer, Knorr and Malic46
Concurrently with our observation of terahertz stimulated emission in optically pumped graphene,Reference Otsuji, Boubanga-Tombet, Chan, Satou and Ryzhii28–Reference Karasawa, Komori, Watanabe, Satou, Fukidome, Suemitsu, Ryzhii and Otsuji30 Li et al. observed population inversion and stimulated emission at near-infrared frequencies on very short time scales (∼200 fs).Reference Li, Luo, Hupalo, Zhang, Tringides, Schmalian and Wang47 In other work, Prechtel et al. observed time-resolved picosecond photocurrents in freely suspended graphene contacted by metal electrodes.Reference Prechtel, Song, Schuh, Ajayan, Wegscheider and Holleitner48 At the graphene–metal interface, built-in electric fields give rise to a transient photocurrent with a full width at half-maximum of ∼4 ps, and a photothermoelectric effect generates a current with a decay time of ∼130 ps. That work also showed that, in optically pumped graphene, electromagnetic radiation up to 1 THz is generated. These results might prove essential to the construction of graphene-based terahertz sources, ultrafast photodetectors, and photovoltaic cells.
Other possible terahertz graphene device applications
Researchers have also explored other graphene-based electronic, optoelectronic, and terahertz photonic devices. For example, graphene-channel transistors have cutoff frequencies approaching the terahertz rangeReference Schwierz49, Reference Wu, Farmer, Valdes-Garcia, Zhu, Jenkins, Dimitrakopoulos, Avouris and Lin50 (see the article in this issue by Avouris and Xia), and graphene photodetectors have demonstrated high-speed operationReference Mueller, Xia and Avouris51 in the mid-infrared range that is also expected to extend to the terahertz range.Reference Ryzhii, Ryabova, Ryzhii, Varyshnikov, Karasik, Mitin and Otsuji52
Using a quasiclassical kinetic theory, Mikhailov and Ziegler studied the response of the Dirac fermions in graphene, with their linear dispersion, to an applied ac electric field with an angular frequency ω. They found an ac current not only at the original fundamental frequency but also at odd harmonics with angular frequencies nω and magnitudes 1/n as large as the fundamental (where n is an odd integer), even without any saturation due to Pauli blocking.Reference Mikhailov and Ziegler53, Reference Mikhailov54 Therefore, the dynamics of graphene in an ac electric field are intrinsically nonlinear, and efficient frequency multiplication for terahertz generation can be expected for microwave-driven graphene that substantially outperforms that of any existing materials.
Very recently, a terahertz modulator based on intraband absorption in graphene was proposedReference Sensale-Rodriguez, Fang, Yan, Kelly, Jena, Liu and Xing55 and demonstrated experimentally.Reference Sensale-Rodriguez, Yan, Kelly, Fang, Tahy, Hwang, Jena, Liu and Xing56 Sensale-Rodriguez et al. exploited electrical tuning of intraband conductivity (hence of the Drude absorption), which can theoretically modulate terahertz electromagnetic radiation by up to 100%. In contrast, interband absorption is limited to 2.3% per graphene monolayer. The experiments demonstrated a fairly high modulation index of up to ∼70%.
Judging from these examples, graphene-based devices could provide all of the fundamental functionalities of generation, detection, amplification, modulation, and frequency conversion that are required for terahertz signal processing. Their versatility could provide an important boost to this rapidly developing field.
Summary
Recent advances in graphene-based materials and devices for terahertz science and technology were reviewed in this article. Owing to its unique carrier-transport and optical properties, including massless and gapless energy spectra, graphene is anticipated to overcome many technological limitations on conventional electronic and photonic devices operating in the terahertz frequency range. One of the most important aspects arising from the unique ultrafast carrier relaxation/recombination dynamics of graphene is the occurrence of negative dynamic conductivity over a wide terahertz spectral range even at room temperature, which would break through the limit on operating temperatures of state-of-the-art semiconductor lasers. Theoretical calculations suggest that current injection is best suited to preventing carrier heating, hence minimizing the pumping threshold level.
Compared to the existing state-of-the-art semiconductor laser technologies, graphene injection lasers have substantial advantages including relatively high quantum efficiency (∼1), practically high output power (on the order of milliwatts), and room-temperature operation. These advantages arise from (1) the symmetric, gapless, linear band structure that achieves carrier depopulation without the special structures that are mandatory in quantum-cascade lasers; (2) extremely high optical-phonon energy, resulting in ultrafast carrier energy relaxation and efficient population inversion; and (3) extremely long carrier momentum relaxation times that help minimize the intraband Drude conductivity (loss factor) and hence maximize the terahertz gain. Because of the operating principle of interband transitions within the gapless and continuum linear band structure, the lasing frequency and linewidth are determined mainly by the laser cavity profiles (resonance frequencies and finesse), which should be demonstrated when lasing operation is achieved.
The unique terahertz dynamics of two-dimensional plasmons in graphene is another important advantage of graphene materials and devices that helps reduce the propagation loss of the generated terahertz waves. More experiments are needed to verify these exciting predictions, especially in the more practical, epitaxially grown material.
In addition to coherent terahertz light sources, graphene can realize various other functionalities, including amplification, detection, modulation, and frequency multiplication over the terahertz frequency range. In fact, in all of these aspects, graphene could substantially outperform any existing materials. Continued study is also expected toward the creation of graphene terahertz lasers and other novel devices. Design and implementation of high-performance device structures and improvement of synthesis technology that can reproducibly provide the highest quality of large-area graphene will be the key issues.
Acknowledgments
The authors thank Dr. T.Yu. Bagaeva at Kotelnikov Institute of Radio Engineering and Electronics, Saratov, Russia; Dr. A.A. Dubinov, Institute for Physics of Microstructures, Russian Academy of Sciences (RAS), Nizhny Novgorod, Russia; S. Chan at University of Pennsylvania, Philadelphia, PA, USA; Prof. V. Mitin at University at Buffalo, State University of New York, Buffalo, NY, USA; Prof. M. Shur at Rensselaer Polytechnic Institute, Troy, NY, USA; and Dr. A. El Moutaouakil, T. Watanabe, and T. Fukushima at Tohoku University, Sendai, Japan, for their contributions throughout this work. This work was financially supported by JST-CREST, JSPS GA-SPR, JSPS Core-to-Core, JSPS JPN-RUS, Japan; NSF-PIRE-Nano-Japan, USA; and RFBR-RAS, Russia.