

Introduction
Social anxiety disorder (SAD) is a frequently occurring and highly impairing psychological disorder associated with reduced quality of life, substantial economic burden, and high levels of mental health service utilisation (Aderka et al., Reference Aderka, Hofmann, Nickerson, Hermesh, Gilboa-Schechtman and Marom2012; Eng, Coles, Heimberg, & Safren, Reference Eng, Coles, Heimberg and Safren2005; Keller, Reference Keller2003; Mendlowicz & Stein, Reference Mendlowicz and Stein2000; Patel, Knapp, Henderson, & Baldwin, Reference Patel, Knapp, Henderson and Baldwin2002; Stein & Kean, Reference Stein and Kean2000). Cognitive-behavioural therapy (CBT) is the most widely studied treatment for SAD (Heimberg, Reference Heimberg2002) and is currently considered the gold-standard treatment for this disorder (Hofmann & Otto, Reference Hofmann and Otto2017; Narr & Teachman, Reference Narr and Teachman2017; Rodebaugh, Holaway, & Heimberg, Reference Rodebaugh, Holaway and Heimberg2004). CBT for SAD targets various maintenance factors implicated in the disorder, including post-event processing (PEP; Brozovich & Heimberg, Reference Brozovich and Heimberg2008; Clark, Reference Clark, Crozier and Alden2001; Clark & Wells, Reference Clark, Wells, Heimberg, Liebowitz, Hope and Schneier1995; Hofmann & Otto, Reference Hofmann and Otto2018; Rachman, Grüter-Andrew, & Shafran, Reference Rachman, Grüter-Andrew and Shafran2000). PEP is defined as the prolonged, ruminative review of one's performance following a social interaction. When individuals with SAD engage in PEP, they tend to (1) ruminate on the negative affect that they experienced during the social interaction, (2) experience negative self-perceptions of their performance during the social interaction, and (3) recall additional instances of past social failures (Hofmann & Otto, Reference Hofmann and Otto2018). The cumulative consequence of PEP is that memories of social interactions become increasingly negative over time, thereby maintaining SAD by reinforcing beliefs about one's perceived social ineptitude (Wong & Moulds, Reference Wong and Moulds2009).
Positive Beliefs about PEP
Research supporting the importance of PEP to SAD pathology has consistently demonstrated positive associations between these constructs, both cross-sectionally (e.g., Fehm, Schneider, & Hoyer, Reference Fehm, Schneider and Hoyer2007; Kocovski & Rector, Reference Kocovski and Rector2007) and prospectively (e.g., Abbott & Rapee, Reference Abbott and Rapee2004; Dannahy & Stopa, Reference Dannahy and Stopa2007; Kocovski, Endler, Rector, & Flett, Reference Kocovski, Endler, Rector and Flett2005; Mellings & Alden, Reference Mellings and Alden2000). Findings from treatment outcome studies have also demonstrated that PEP tends to decrease over the course of CBT for SAD (McEvoy, Mahoney, Perini, & Kingsep, Reference McEvoy, Mahoney, Perini and Kingsep2009; Price & Anderson, Reference Price and Anderson2011), and that reductions in PEP precede and predict reductions in social anxiety symptoms (Hedman et al., Reference Hedman, Mörtberg, Hesser, Clark, Lekander, Andersson and Ljótsson2013; McEvoy et al., Reference McEvoy, Mahoney, Perini and Kingsep2009). Others (e.g., Katz, Cassin, Weerasinghe, & Rector, Reference Katz, Cassin, Weerasinghe and Rector2019; Price & Anderson, Reference Price and Anderson2011) have demonstrated that individuals reporting higher levels of PEP demonstrate slower social anxiety symptom reduction as compared with those reporting lower levels of PEP, suggesting that PEP limits treatment response. Taken together, these findings suggest that PEP plays an important role in maintaining SAD and is consequently an important intervention target. If PEP is to be adequately targeted in SAD treatment, it is imperative to understand the factors that predict and maintain it. Research groups have begun to explore the potential role of metacognition (i.e., beliefs that individuals hold about the function of rumination) in predicting PEP (Fisak & Hammond, Reference Fisak and Hammond2013; Vassilopoulos, Brouzos, & Moberly, Reference Vassilopoulos, Brouzos and Moberly2015; Wong & Moulds, Reference Wong and Moulds2010).Footnote 1 The impetus to explore the role of metacognition stemmed largely from Wells (Reference Wells1995)'s metacognitive model of generalised anxiety disorder (GAD). Research in support of this model suggests that, in the context of GAD, holding positive beliefs about the function of worry (e.g., believing that worrying prevents bad things from happening) predicts subsequent worry behaviour (Borkovec, Hazlett-Stevens, & Diaz, Reference Borkovec, Hazlett-Stevens and Diaz1999). Given the conceptual similarity of worry to PEP (McEvoy, Mahoney, & Moulds, Reference McEvoy, Mahoney and Moulds2010), researchers have begun to explore the potential applicability of Wells (Reference Wells1995)'s metacognitive model to social anxiety (Fisak & Hammond, Reference Fisak and Hammond2013).
Wong and Moulds (Reference Wong and Moulds2010) explored this question by adapting an existing measure of positive beliefs about rumination to the social context. Results from their study indicated that holding positive beliefs about the function of rumination following social events (i.e., PEP) was positively associated with both the tendency to engage in subsequent PEP, as well as with symptoms of social anxiety (Wong & Moulds, Reference Wong and Moulds2010). In another study, Gavric et al. (Reference Gavric, Moscovitch, Rowa and Mccabe2017) found that metacognitive beliefs about PEP mediated the relationship between group status (i.e., SAD, anxious control, or healthy control) and self-reported PEP in days following an in-lab social performance task.
Fisak and Hammond (Reference Fisak and Hammond2013) further expanded upon this research through the development and validation of the Positive Beliefs about Post-Event Processing Questionnaire (PB-PEPQ), the first measure to directly assess metacognitive beliefs about PEP. Based on the administration of the PB-PEPQ to a large undergraduate student sample, Fisak and Hammond (Reference Fisak and Hammond2013) provided initial psychometric data supporting the scale's factor structure, reliability, and validity. Results of an exploratory factor analysis (EFA) supported a single-factor solution. The scale showed strong internal consistency (Cronbach's alpha of 0.92). Scores on the PB-PEPQ were positively associated with scores on measures of PEP and social anxiety symptoms, supporting the criterion validity of the scale. Furthermore, incremental validity was evidenced to the extent that PB-PEPQ scores accounted for additional variance in social anxiety symptoms beyond the variance explained by measures of PEP and metacognitive beliefs. Fisak and Hammond (Reference Fisak and Hammond2013) also conducted a mediation analysis to demonstrate that PEP underlies the relationship between PB-PEPQ scores and social anxiety symptoms. However, given that these analyses were based on cross-sectional data, the direction of the observed relationship between these variables remains unclear.
Initial findings reported by Fisak and Hammond (Reference Fisak and Hammond2013) support the psychometric rigour of the PB-PEPQ and suggest that positive beliefs about PEP may predict PEP itself, thereby maintaining SAD pathology. However, there is a need for independent evaluation of the psychometric properties of the PB-PEPQ, including confirmatory factor analysis (CFA) and replication of findings in a clinical sample of individuals with SAD. Furthermore, administering the measure to individuals with other anxiety disorder diagnoses would allow for discriminative validity analyses, which would be useful for exploring the extent to which positive beliefs about PEP are unique to SAD.
Present Study
The present study fills this need by examining the psychometric properties of the PB-PEPQ in a clinical sample of individuals diagnosed with SAD and other anxiety and related disorder diagnoses. In addition to replicating the analyses conducted by Fisak and Hammond (Reference Fisak and Hammond2013), the present paper also reports the results of analyses examining test–retest reliability and discriminative validity, more robust tests of criterion validity, and CFA. We anticipated finding strong support for the psychometric properties of the PB-PEPQ. We further anticipated that the results of the CFA would support the single-factor structure of the scale reported by Fisak and Hammond (Reference Fisak and Hammond2013).
Method
The authors assert that all procedures contributing to this work comply with the ethical standards of the relevant national and institutional committees on human experimentation and with the Helsinki Declaration of 1975, as revised in 2008.
Participants
The study sample comprised individuals referred for assessment and treatment of anxiety-related problems at a large anxiety and related disorders clinic based in an academic hospital. At baseline, the sample consisted of 337 participants enrolled in a CBT group for SAD (n = 71), GAD (n = 98), obsessive-compulsive disorder (OCD; n = 41), panic disorder (PD; n = 30), or posttraumatic stress disorder (PTSD; n = 60), as well as individuals referred for a general cognitive-behavioural therapy for anxiety (CBT-A) groupFootnote 2 (n = 16), a transdiagnostic behaviour therapy (TBT) groupFootnote 3 (n = 7), and a CBT group for perfectionismFootnote 4 (CBT-P; n = 14).
Materials
Diagnostic Assessment and Research Tool (DART)
The DART (McCabe et al., Reference McCabe, Milosevic, Rowa, Shnaider, Key and Antony2017) is a freely available semi-structured diagnostic interview used to assess for the presence of psychological disorders according to DSM-5 criteria (American Psychiatric Association, 2013). Initial validation data provide good support for the psychometric properties of the DART. Findings suggest that DART diagnoses for anxiety, depressive, and substance use disorders correspond with higher scores on self-report questionnaires assessing symptoms of these disorders (e.g., individuals with SAD diagnoses based on the DART score significantly higher on measures of social anxiety symptoms as compared with those not diagnosed with SAD; p < .001 for all diagnoses; Pawluk et al., Reference Pawluk, Schneider, Milosevic, Shnaider, Rowa, Antony and McCabein press). In a separate study, preliminary data demonstrated high inter-rater agreement as well as good construct, convergent, and divergent validity of the DART for modules assessing mood disorders, anxiety and related disorders, and substance use disorders (Schneider et al., Reference Schneider, Pawluk, Milosevic, Shnaider, Rowa, Antony and McCabein press).
Demographics Questionnaire
All participants completed a questionnaire assessing standard demographic characteristics (e.g., age, ethnicity, education, marital status).
Social Phobia Inventory (SPIN)
The SPIN (Connor et al., Reference Connor, Davidson, Churchill, Sherwood, Weisler and Foa2000) is a 17-item self-report measure assessing the extent to which respondents were bothered by symptoms of social anxiety over the past week. The SPIN includes social anxiety symptoms across three domains, including fear, avoidance, and physiological symptoms. Items are rated on a 5-point Likert scale ranging from 0 (Not at all) to 5 (Extremely). The SPIN has previously demonstrated strong convergent and discriminant validity, as well as excellent internal consistency and good test–retest reliability (e.g., Antony, Coons, McCabe, Ashbaugh, & Swinson, Reference Antony, Coons, McCabe, Ashbaugh and Swinson2006). Internal consistency based on the full pretreatment sample in the current study was excellent, α = 0.94.
Post-Event Processing Questionnaire – Revised (PEPQ-R)
The PEPQ-R (McEvoy & Kingsep, Reference McEvoy and Kingsep2006; original PEPQ, Rachman et al., Reference Rachman, Grüter-Andrew and Shafran2000) is a 14-item questionnaire used to assess PEP occurring over the past 2 weeks. Following McEvoy and Kingsep (Reference McEvoy and Kingsep2006), six items with low factor loadings were excluded from the total (sum) scale score, and total (sum) scores were based on the remaining eight items. Due to the limitations of our data collection system, we opted to use a Likert scale rather than the original visual analogue scale, as has been done in prior research (e.g., Fisak & Hammond, Reference Fisak and Hammond2013). The Likert scale ranged from 0 (Not at all) to 10 (Totally agree). At week 2, a modified version of the PEPQ-R was used which asked participants to report on experiences of PEP occurring over the past week (i.e., since the first treatment session, which is typically experienced by SAD individuals as an anxiety-provoking social event). The nine-item PEPQ-R has demonstrated strong psychometric properties (McEvoy & Kingsep, Reference McEvoy and Kingsep2006). Internal consistency of the PEPQ-R based on the full pretreatment sample in the present study was excellent, α = 0.92.
Positive Beliefs about Post-Event Processing Questionnaire (PB-PEBQ)
The PB-PEBQ (Fisak & Hammond, Reference Fisak and Hammond2013) is a 23-item questionnaire used to measure positive beliefs about engaging in PEP. Items are rated on a 4-point Likert scale ranging from 1 (Do not agree) to 4 (Agree very much). In an initial validation study, the PB-PEBQ demonstrated excellent internal consistency and strong criterion validity (Fisak & Hammond, Reference Fisak and Hammond2013). Internal consistency in the current pretreatment sample was excellent, α = 0.95.
Depression Anxiety Stress Scales, 21-item Version (DASS-21)
The DASS-21 (Lovibond & Lovibond, Reference Lovibond and Lovibond1995) is a 21-item questionnaire assessing symptoms of depression, anxiety, and psychological distress and tension. Items are rated on a 4-point Likert scale ranging from 0 (Did not apply to me at all) to 3 (Applied to me very much). The DASS-21 has previously demonstrated strong psychometric properties, including good internal consistency (Henry & Crawford, Reference Henry and Crawford2005), as well as strong convergent and discriminant validity (Antony, Bieling, Cox, Enns, & Swinson, Reference Antony, Bieling, Cox, Enns and Swinson1998; Henry & Crawford, Reference Henry and Crawford2005). Internal consistency coefficients for the pretreatment sample in the present study ranged from good to excellent, as follows: DASS-21 Depression, α = 0.90; DASS-21 Anxiety, α = 0.86; DASS-21 Stress, α = 0.86.
Procedure
Most participants in the present study (n = 312, 93.6%) were administered the DART (McCabe et al., Reference McCabe, Milosevic, Rowa, Shnaider, Key and Antony2017) as part of the initial assessment protocol. The remaining participants (n = 25, 7.4%) were referred for anxiety services following assessment at another mental health clinic at the same hospital or were referred directly for group treatment following psychiatric consult. Accordingly, diagnostic data are not available for this small subset of participants. All participants (N = 337) provided informed consent to participate in research and subsequently completed the self-report measures described above (i.e., SPIN, PEPQ-R, PB-PEBQ, and DASS-21). Although most individuals were referred to the CBT group that corresponded to their principal diagnosis on the DART, this was not always the case, as some patients at the clinic were referred to a second or third CBT group for additional diagnoses following completion of an initial treatment program for their principal diagnosis. The percentage of participants whose principal diagnosis corresponded to the CBT group was as follows: 35.7% (GAD), 52.1% (SAD), 53.7% (OCD), 65.0% (PTSD), and 50.0% (PD). Participants who were referred to a second or third CBT group were re-assessed by a clinician at the end of their previous CBT group who ensured that the principal symptoms at that point were consistent with the next CBT group to which they were referred. In other words, participants were only referred to a CBT group when their current symptoms matched the current group focus.
Next, a subset of participants (N = 265) began CBT and completed the same self-report measures at week 2 or 3 of treatment. Additional participant data were also collected at subsequent weeks as part of a larger study.
Data Analytic Plan
To maximise sample size, we examined the proposed unidimensional factor structure of the PB-PEPQ (Fisak & Hammond, Reference Fisak and Hammond2013) using a CFA based on the complete treatment-seeking sample (N = 337). Next, we conducted internal consistency (using Cronbach's alpha) and test–retest reliability analyses of the PB-PEPQ based on the SAD group only (n = 71). Similarly, analyses examining the convergent and criterion validity of the PB-PEPQ were completed using individuals in the SAD group only. Specifically, we examined convergent validity using a series of linear regression analyses, with baseline PB-PEPQ as the predictor variable and post-event processing (PEPQ-R scores) and social anxiety symptoms (SPIN scores) measured at baseline as outcome variables. To examine criterion validity of the PB-PEPQ, a series of linear regression analyses were conducted with baseline PB-PEPQ as the predictor and the SPIN and PEPQ-R measured at week 2 as outcome variables. To further explore the criterion validity of the PB-PEPQ, a series of mediation analyses were conducted to examine whether PEP mediates the relationship between positive beliefs about PEP and social anxiety symptoms measured at baseline. Finally, discriminative validity of the PB-PEPQ was examined by comparing individuals in the SAD, GAD, OCD, PD, and PTSD groups at baseline using one-way ANOVA. Any significant effect was followed up with planned comparisons.
Results
Preliminary Analyses
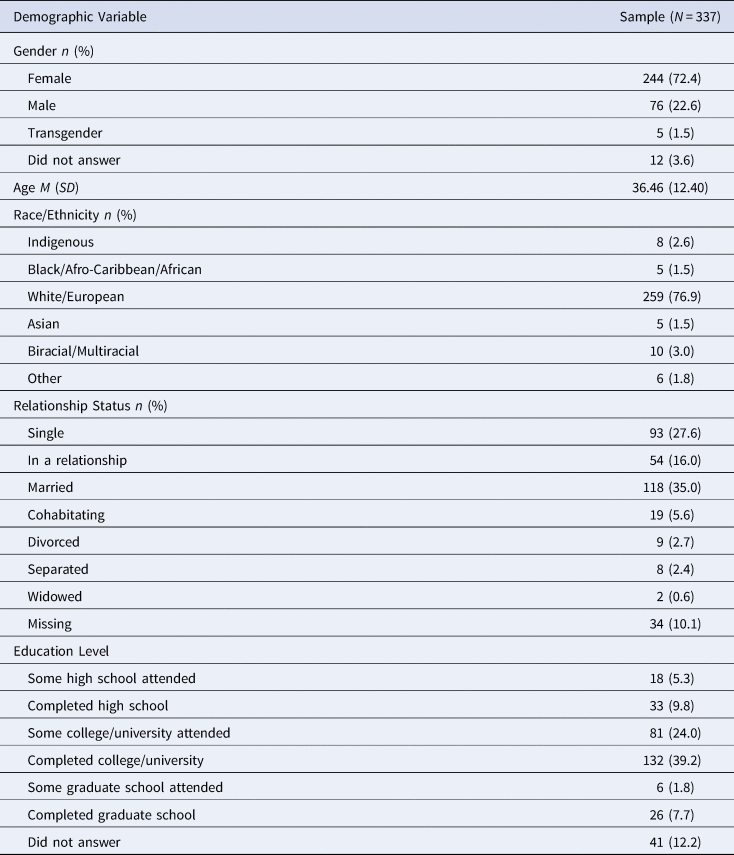
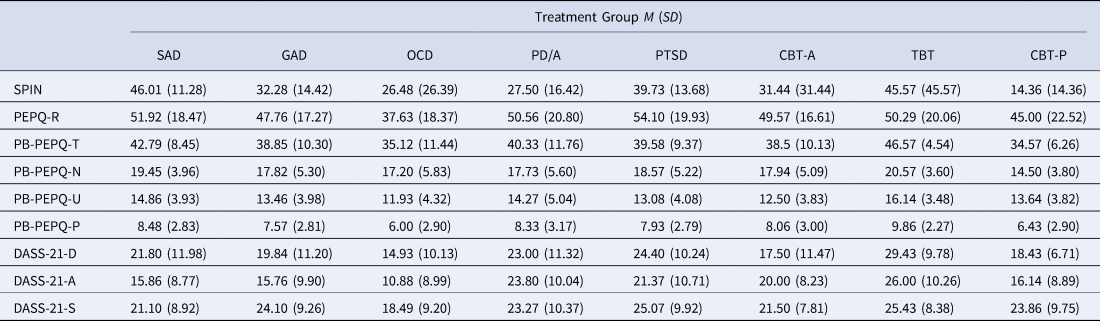
The total sample included 337 participants, 266 of whom completed study questionnaires at week 2, and 51 of whom completed the SPIN at week 3. The sample characteristics are presented in Table 1. Means and standard deviations (SDs) of study variables are presented by group in Table 2. No outliers (defined as scores falling 3 SDs above or below the mean for each scale or subscale) were identified in the pretreatment, week 2, or week 3 datasets. In instances where variables were non-normally distributed, results were confirmed using the 95% bias-corrected (BCa) confidence interval (CI) Bootstrapping procedure in SPSS.
Demographic Characteristics of Sample

Pretreatment Group Characteristics Stratified by Treatment Group

Note: DASS-21-A = Depression Anxiety Stress Scales-21 (Anxiety); DASS-21-D = Depression Anxiety Stress Scales-21 (Depression); DASS-21-S = Depression Anxiety Stress Scales-21 (Stress); CBT-A = general cognitive-behavioural therapy for anxiety; CBT-P = cognitive-behavioural therapy for perfectionism; GAD = generalised anxiety disorder; OCD = obsessive-compulsive disorder; PB-PEPQ-N = Positive Beliefs about Post-Event Processing Questionnaire (Negative); PB-PEPQ-P = Positive Beliefs about Post-Event Processing Questionnaire (Positive); PB-PEPQ-T = Positive Beliefs about Post-Event Processing Questionnaire (Total); PB-PEPQ-U = Positive Beliefs about Post-Event Processing Questionnaire (Understand); PD/A = panic disorder or agoraphobia; PEPQ-R = Post-Event Processing Questionnaire Revised; PTSD = post-traumatic stress disorder; SAD = social anxiety disorder; SPIN = Social Phobia Inventory; TBT = transdiagnostic behaviour therapy.
Factor Analysis
CFA was performed on the full pretreatment sample using R software. Based on the findings of the EFA reported by Fisak and Hammond (Reference Fisak and Hammond2013), we assessed the proposed unidimensional model of the 23 PB-PEPQ items. Multiple indices were used to examine adequacy of fit (Hooper, Coughlan, & Mullen, Reference Hooper, Coughlan and Mullen2008; Kline, Reference Kline2016), including the comparative fit index (CFI; Bentler, Reference Bentler1990), Tucker–Lewis Index (TLI; McDonald & Marsh, Reference McDonald and Marsh1990), root mean square error of approximation (RMSEA; Raykov, Reference Raykov1998), and the standardised root mean square residual (SRMR). Recommended cut-off values indicating good fit for these indices are as follows: CFI ≥ 0.95; TLI ≥ 0.95; RMSEA < 0.08; SRMS < 0.08 (Hooper et al., Reference Hooper, Coughlan and Mullen2008; Kline, Reference Kline2016). CFA results indicated that adequacy of fit was not achieved based on these evaluative criteria (CFI = 0.70, TLI = 0.67, RMSEA = 0.14, SRMR = 0.09). Furthermore, a review of the factor loadings revealed that several items had standardised structure coefficients lower than the accepted cut-off of 0.9. Accordingly, we reran the CFA, this time omitting poorly loading items (i.e., those with a standardised structure coefficient of <0.7). The unidimensional model based on the abridged, 14-item PB-PEPQ passed only one of the four evaluative criteria (CFI = 0.84; TLI = 0.81; RMSEA = 0.15; SRMR = 0.06).
Given the inadequate fit of the unidimensional model, the decision was made to return to EFA to determine whether an alternative factor structure might be more appropriate. Following Fisak and Hammond (Reference Fisak and Hammond2013), we conducted an EFA using a principal axis analysis extraction method with oblimin rotation. The EFA was justified by an obtained value of 0.93 on the Kaiser–Meyer–Olkin measure of sampling accuracy and a statistically significant result (p < .001) on Bartlett's Test of Sphericity.
The EFA yielded four factors with Eigenvalues above Kaiser's criterion of one, which cumulatively explained 66.91% of the variance in the scale. The factors were conceptually distinct from one another. Factor 1 (Negative) items assessed engaging in PEP to review whether negative events had occurred. Factor 2 (Understand) items assessed engaging in PEP to better understand one's social anxiety. Factor 3 (Positive) items assessed engaging in PEP to review whether positive events had occurred. Two items loaded onto Factor 4 (Appearance). Like the items loading onto Factor 1, both of these items assessed engaging in PEP to review whether negative events had occurred. However, unlike the items loading onto Factor 1, the items loading onto Factor 4 were specifically related to aspects of an individual's physical appearance (i.e., clothing or body language). Seven items demonstrated substantial cross-loading (Items 7, 9, 13, 15, 18, 20, and 23) and were consequently pruned. These items did not represent a unique theme, but rather mostly represented items that could have reasonably been conceptualised as fitting under either the ‘Negative' or ‘Understand' subscales.
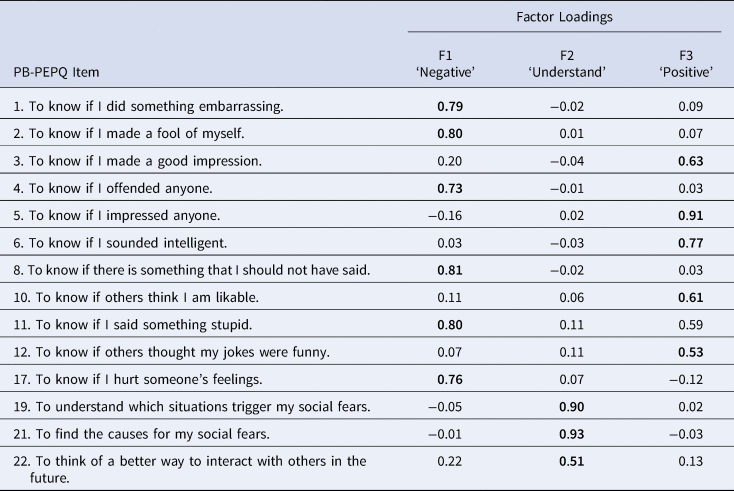
We conducted a second EFA using the remaining 16 PB-PEPQ items. Results yielded three factors with Eigenvalues above one, corresponding to Factors 1 (Negative), 2 (Understand), and 3 (Positive), above. The two items that had previously loaded onto Factor 4 (Items 14, 16) demonstrated weak factor loadings and were consequently pruned. Accordingly, we conducted a final EFA analysis using the remaining 14 PB-PEPQ items. Results (both Eigenvalues and the scree plot) supported the three-factor structure of PB-PEPQ, with these factors cumulatively explaining 70.13% of the variance in the scale. Factor loadings, presented in Table 3, show that each remaining item loaded strongly onto only one of the three factors.
Item Loadings from Pattern Matrix for Nondiscarded Items of the PB-PEPQ

Note: Factor loadings >0.50 are in bold.
Reliability
Tests of reliability were conducted among individuals in the SAD group only (n = 71). Within this subsample, results indicated good to excellent internal consistency at pretreatment for the PB-PEPQ Negative (α = 0.84), Understand (α = 0.83), and Positive (α = 0.85) scales. Test–retest reliability was supported by a strong, positive correlation between scores on the PB-PEPQ Negative (r = 0.78, p < .001), Understand (r = 0.71, p < .001), and Positive (r = 0.65, p < .001) scale scores from pretreatment to week 2.
Convergent and Criterion Validity
Linear regression was used to examine the relationships between the three PB-PEPQ scales, PEP, and social anxiety symptoms. We conducted these analyses in two ways. First, to replicate the analyses conducted by Fisak and Hammond (Reference Fisak and Hammond2013), we conducted a series of linear regression analyses using pretreatment data only. We then conducted a second series of linear regression analyses using pretreatment data for the predictor variables and week 2 data for the outcome variable, as a measure of criterion (more specifically, predictive) validity. Since the measure of PEP administered at week 2 asked about PEP over the past week only, this analysis allows us to explore the extent to which positive beliefs about PEP predicts real PEP following a social anxiety-provoking situation (i.e., the first group CBT session).
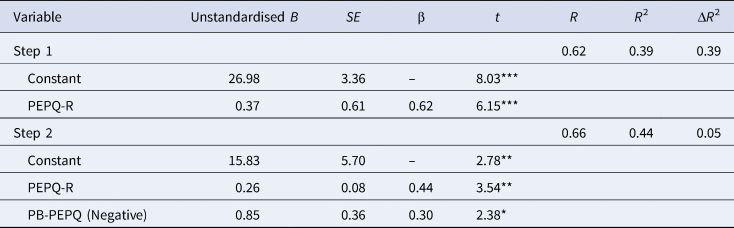
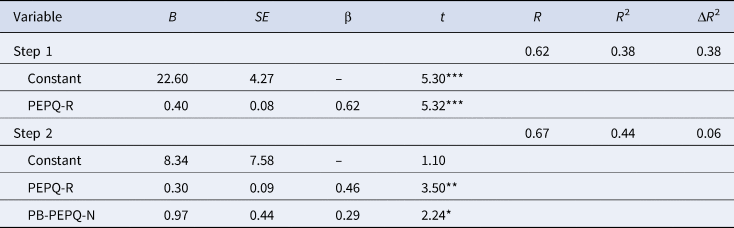
Results from the first series of linear regression analyses indicated that the Negative PB-PEPQ scale, but not the Understand or Positive PB-PEPQ scales, emerged as a unique predictor of PEP (results of regression analyses are presented in Table 4). Similarly, only the Negative PB-PEPQ scale uniquely predicted social anxiety symptoms, though the predictive capacity of the Understand subscale approached statistical significance (p = .069; Table 5). Next, a hierarchical regression analysis was conducted to determine whether the Negative PB-PEPQ scale predicted additional variance in social anxiety symptoms above and beyond what was accounted for by PEP. The hierarchical regression model revealed that at Stage one, post-event processing emerged as a significant predictor of social anxiety symptoms. Introducing the Negative PB-PEPQ scale in Stage two explained an additional 5.4% of variation in social anxiety and this change in R 2 was statistically significant, F(1, 59) = 5.65, p = .021 (Table 6).
Results of Linear Regression Analysis Predicting Post-Event Processing

Note: PB-PEPQ-N = Positive Beliefs about Post-Event Processing Questionnaire (Negative); PB-PEPQ-P = Positive Beliefs about Post-Event Processing Questionnaire (Positive); PB-PEPQ-U = Positive Beliefs about Post-Event Processing Questionnaire (Understand).
*p < .05, **p < .01, ***p < .001.
Results of Linear Regression Analysis Predicting Social Anxiety Symptoms

Note: PB-PEPQ-N = Positive Beliefs about Post-Event Processing Questionnaire (Negative); PB-PEPQ-P = Positive Beliefs about Post-Event Processing Questionnaire (Positive); PB-PEPQ-U = Positive Beliefs about Post-Event Processing Questionnaire (Understand).
*p < .05, **p < .01, ***p < .001.
Results of Hierarchical Regression Analysis Predicting Social Anxiety Symptoms

Note: PB-PEPQ-N = Positive Beliefs about Post-Event Processing Questionnaire (Negative); PB-PEPQ-P = Positive Beliefs about Post-Event Processing Questionnaire (Positive); PB-PEPQ-U = Positive Beliefs about Post-Event Processing Questionnaire (Understand); PEPQ-R = Post-Event Processing Questionnaire Revised.
*p < .05, **p < .01, ***p < .001.
Similarly, the second series of linear regression analyses indicated that only the Negative PB-PEPQ scale emerged as a unique predictor of experienced PEP (i.e., PEP following the initial group CBT session; Table 7) or social anxiety symptoms (Table 8) at week 2. The hierarchical regression model revealed that at Stage one, post-event processing significantly predicted week 2 social anxiety symptoms. Introducing the Negative PB-PEPQ scale in Stage two explained an additional 6.2% of variation in week 2 social anxiety, and this change in R 2 was statistically significant F(1.45) = 5.00, p = .03 (Table 9).
Results of Linear Regression Analysis Predicting Experienced Post-Event Processing at Week 2

Note: PB-PEPQ-N = Positive Beliefs about Post-Event Processing Questionnaire (Negative); PB-PEPQ-P = Positive Beliefs about Post-Event Processing Questionnaire (Positive); PB-PEPQ-U = Positive Beliefs about Post-Event Processing Questionnaire (Understand).
*p < .05, **p < .01, ***p < .001.
Results of Linear Regression Analysis Predicting Social Anxiety Symptoms at Week 2

Note: PB-PEPQ-N = Positive Beliefs about Post-Event Processing Questionnaire (Negative); PB-PEPQ-P = Positive Beliefs about Post-Event Processing Questionnaire (Positive); PB-PEPQ-U = Positive Beliefs about Post-Event Processing Questionnaire (Understand).
*p < .05, **p < .01, ***p < .001.
Results of Hierarchical Regression Analysis Predicting Social Anxiety Symptoms at Week 2

Note: PB-PEPQ-N = Positive Beliefs about Post-Event Processing Questionnaire (Negative); PB-PEPQ-P = Positive Beliefs about Post-Event Processing Questionnaire (Positive); PB-PEPQ-U = Positive Beliefs about Post-Event Processing Questionnaire (Understand); PEPQ-R = Post-Event Processing Questionnaire Revised.
*p < .05, **p < .01, ***p < .001.
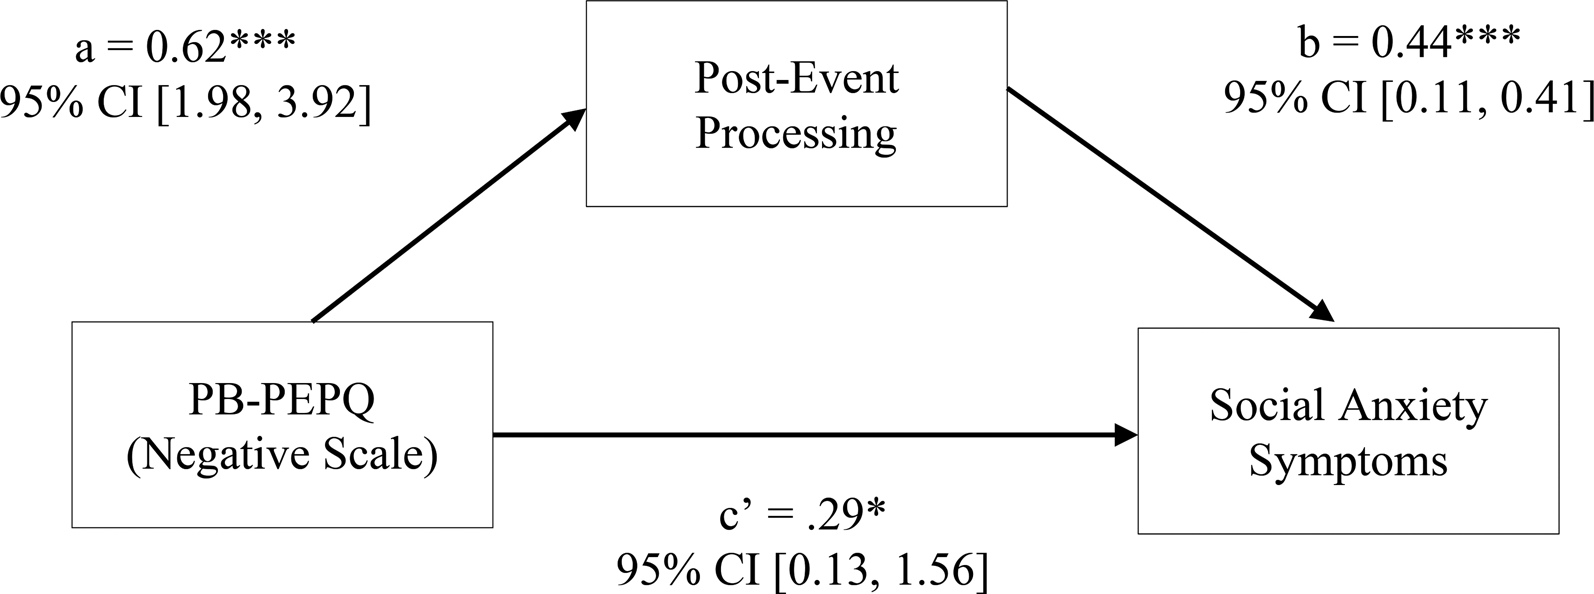
Following the initial PB-PEPQ validation study (Fisak & Hammond, Reference Fisak and Hammond2013), we also conducted mediation analyses to determine whether PEP mediates the relationship between positive beliefs about PEP and social anxiety symptoms. However, given that the Negative PB-PEPQ scale emerged as the strongest predictor of PEP and social anxiety symptoms, we conducted the mediation analysis using this scale as the IV. Mediation analysis was conducted using Hayes’ PROCESS macro for SPSS (Hayes, Reference Hayes2012), which calculates 95% confidence intervals of the indirect effect using bootstrapping. The mediation model included pretreatment data only given our intention to replicate findings reported by Fisak and Hammond (Reference Fisak and Hammond2013). As expected, the relationship between PB-PEPQ (Negative Scale) and social anxiety symptoms was partially mediated by PEP, as evidenced by a significant indirect effect, B = 0.78, SE = 0.30, 95% CI [0.28, 1.47], see Figure 1.
Post-event processing as a partial mediator of the relationship between positive beliefs about post-event processing and social anxiety symptoms. Note: Standardised coefficient values are reported. PB-PEPQ = positive beliefs about post-event processing questionnaire. Post-event processing was assessed using the PEPQ-R. Social anxiety symptoms were assessed using the SPIN. All variables included in the model were assessed at pretreatment. *p < .05, **p < .01, ***p < .001.

Discriminative Validity
Given the diagnostic heterogeneity of the TBT, CBT for Anxiety, and Perfectionism groups, discriminative analyses were conducted using pretreatment data from individuals in the SAD, GAD, OCD, PD/A, and PTSD groups only. To examine group differences on the three PB-PEPQ scales, we conducted a series of three one-way ANOVAs with multiple comparisons.
The first ANOVA examined whether PB-PEPQ Negative scale scores differed between individuals in each group. Results of the ANOVA revealed a significant main effect of group, F(4,295) = 2.44, p = .047. Subsequent planned comparisons revealed that, as anticipated, PB-PEPQ Negative scale scores were higher among the SAD group than the other groups, t(295) = 2.42, p = .016, d = 0.28. No other groups differed significantly from one another (all ps > .05). Next, a second ANOVA was analyzed to examine group differences in scores on the PB-PEPQ Understand scale. The analysis yielded a significant main effect of group, F(4,295) = 4.22, p = .002. Planned comparisons again revealed that PB-PEPQ Positive scale scores were higher among the SAD group than the other groups, t(295) = 2.90, p = .004, d = 0.34. Furthermore, there was a significant group difference in PB-PEPQ Positive scale scores between the OCD and PD/A group participants, t(295) = 2.71, p = .007, d = 0.32, with the OCD group scoring lower. No other significant differences emerged between any two groups (all ps > .05). Finally, a third ANOVA was analyzed to examine group differences in scores on the PB-PEPQ Positive scale. The ANOVA revealed a significant main effect of group, F(4,295) = 5.62, p < .001. Planned comparisons indicated that the SAD group scored higher on this scale than did the other groups combined, t(295) = 2.51, p = .013, d = 0.29. In addition, the OCD group scored significantly lower than each of the GAD, t(295) = 2.83, p = .005, d = 0.33, PD/A, t(295) = 3.31, p = .001, d = 0.39, and PTSD, t(295) = 3.63, p < .001, d = 0.42, groups.
Discussion
The purpose of this study was to examine the psychometric properties of the PB-PEPQ in a clinical sample. Contrary to hypotheses, the results of the CFA did not support Fisak and Hammond's (Reference Fisak and Hammond2013) unidimensional model. Rather, the results of the present EFA support the retention of 14 PB-PEPQ items with three underlying factors representing thematically distinct types of beliefs. The PB-PEPQ demonstrated good predictive validity, significantly predicting baseline SAD symptoms and PEP, and having a significant indirect effect on SAD symptoms through PEP at baseline. As expected, the total scale and its factors demonstrated good reliability and discriminative validity. Overall, findings provide additional psychometric support for the PB-PEPQ while raising additional questions about its structure and criterion validity.
Given that Fisak and Hammond (Reference Fisak and Hammond2013) reported a single-factor solution using responses from a non-clinical undergraduate sample, the three factors observed in the present study suggest that the PB-PEPQ performs differently in a clinical sample. The final 14-item PB-PEPQ in the present study yielded factors that were subsequently labelled as Negative, Understand, and Positive. The items in each factor illustrate different motivations for, or beliefs about, the benefits of engaging in PEP. Items in the Negative factor, such as ‘To know if I said something stupid’, all presumed that one performed negatively, whereas items in the Positive factor, such as ‘To know if I impressed anyone’, demonstrate a motivation to recall positive aspects of their social performance. In contrast, items in the Understand factor such as ‘To understand which situations trigger my social fears’ represent a desire to better understand one's anxiety. Seven of the nine pruned PB-PEPQ items demonstrated substantial cross-loading on two factors (in most instances, the Negative and Understand factors). Given this finding, it will be important for subsequent CFA of the PB-PEPQ items to examine which of two competing models represents a better fit to the data, either the three-factor model presented herein, or a bifactor model that includes both a general factor and three orthogonal group factors (i.e., subscales).
The finding that the factor structure of the PB-PEPQ appears to differ when administered in a non-clinical (Fisak & Hammond, Reference Fisak and Hammond2013) versus clinical sample is perhaps unsurprising, as individuals with clinically significant anxiety symptoms are likely to have a more extensively developed and nuanced set of metacognitive beliefs about their anxiety symptoms. Similarly, it is plausible that the factor structure of the scale may further differ when administered in a homogeneous SAD sample (i.e., in contrast to the heterogeneous anxiety disorder sample on which the present factor analysis was based), as individuals with SAD may demonstrate further specificity in the types of metacognitive beliefs about PEP that they possess.
Fisak and Hammond (Reference Fisak and Hammond2013) found that total scores on the PB-PEPQ predicted PEP and social anxiety symptoms. In the present study, these analyses were conducted using each of the three PB-PEPQ scales. Interestingly, the Negative scale emerged as the sole unique predictor of both PEP and social anxiety symptoms (both at baseline and week 2) and explained unique variance in social anxiety symptoms above and beyond what was explained by PEP alone. These findings suggest that individuals who are motivated to engage in PEP as a means of discerning whether undesirable social behaviours occurred appear to be at particular risk of maintained PEP behaviour and social anxiety symptoms. This finding is unsurprising, as these individuals are likely to recall social interactions in search of potential faux pas, leaving them susceptible to confirmation bias. In contrast, individuals who are motivated to engage in PEP as a means of either recalling positive social behaviours (as measured by the Positive scale) are more likely to find evidence that disconfirms maladaptive beliefs concerning their own social competence. Similarly, individuals who are motivated to engage in PEP as means of better understanding their social anxiety (as measured by the Understand scale) may draw more helpful conclusions even when they do recall having behaved in a socially undesirable manner. For example, they may view this information as representing an opportunity to learn from the past and improve, rather than perceiving a social faux pas as an indicator of an unchangeable social inadequacy.
Although these findings are interesting, they are indeed preliminary, and future research will be needed to replicate these findings and further explore the utility of each of the PB-PEPQ scales in predicting PEP and social anxiety symptoms. Furthermore, although the present study found that PEP mediated the relationship between Negative PB-PEPQ scores and social anxiety symptoms, this analysis was based on cross-sectional data. Accordingly, more research is needed to examine temporal relationships between positive beliefs about PEP, PEP, and SAD symptoms.
As anticipated, the PB-PEPQ scales demonstrated good psychometric characteristics, such as internal consistency and test–retest reliability. They also showed good discriminative properties, with participants in the SAD group scoring significantly higher than all other groups on each of the three PB-PEPQ scales, though effect sizes were small. These findings are in line with prior research demonstrating that PEP (particularly, negative PEP) is uniquely elevated in those with principal or comorbid SAD relative to other disorders (Dannahy & Stopa, Reference Dannahy and Stopa2007; Edwards, Rapee, & Franklin, Reference Edwards, Rapee and Franklin2003; Perera, Rowa, & McCabe, Reference Perera, Rowa and McCabe2015). For the most part, PB-PEPQ scales scores did not differ significantly between the other treatment groups. The one exception to this finding was the OCD group, which demonstrated lower scores than some of the other groups on both the Positive and Understand subscales, with small effects. This finding, though unexpected, suggests that PEP in OCD may primarily be experienced as an intrusive phenomenon as described by Rachman et al. (Reference Rachman, Grüter-Andrew and Shafran2000). Although studies have found similar levels of PEP in individuals with OCD and SAD (Laposa, Collimore, & Rector, Reference Laposa, Collimore and Rector2014), the present study's findings suggest that unique metacognitive processes, in this case positive beliefs about PEP, may promote PEP across disorders.
The main limitation of the current study is the correlational nature of the design, which precludes causal inference. Future studies should experimentally manipulate positive and perhaps negative beliefs about PEP in order to examine causation. Another limitation of the present study is the restricted assessment timeframe. Given that changes in PEP resulting from treatment are associated with changes in SAD symptoms (e.g., McEvoy et al., Reference McEvoy, Mahoney, Perini and Kingsep2009; Price & Anderson, Reference Price and Anderson2011), future studies should further investigate positive beliefs about PEP, PEP, and SAD symptoms over the course of treatment to better grasp the temporal relationships as well as the treatment mechanisms involved. In addition, findings are limited in their specificity due to the heterogeneity of the sample and because analyses did not control for depression and general anxiety sensitivity symptoms. PEP, depressive rumination, and worry all share considerable overlap and have been conceptualised as the transdiagnostic construct repetitive negative thinking (Arditte, Shaw, & Timpano, Reference Arditte, Shaw and Timpano2016; McEvoy et al., Reference McEvoy, Mahoney and Moulds2010). Relatedly, many of the patients included in our sample had comorbid psychological disorders, thus somewhat blurring distinctions between groups. However, it is notable that, in the real world, rates of comorbidity are indeed high among individuals with SAD, thus our study benefits from ecological validity. Furthermore, given the diagnostic heterogeneity of our sample, it will be important for subsequent research to examine the factor structure of the PB-PEPQ in a homogeneous SAD sample, given the unique relevance of that diagnostic presentation to the construct measured by the scale. Finally, recent studies have begun to examine the role of negative beliefs about PEP in the maintenance of PEP and SAD pathology (Rodriguez, Kissell, Lucas, & Fisak, Reference Rodriguez, Kissell, Lucas and Fisak2017; Yoshinaga, Takaoka, & Kobori, Reference Yoshinaga, Takaoka and Kobori2019). It would therefore be interesting to explore the role of both positive and negative beliefs about PEP as well as other metacognitive beliefs in a clinical sample in the same study.
In conclusion, this study is the first to examine the psychometric qualities of the PB-PEPQ in a clinical sample. The present study extended previous research on positive beliefs about PEP and their measurement, providing further evidence for relationships between positive metacognitions about PEP and SAD symptoms. Importantly, the findings reveal the multifactorial structure of the PB-PEPQ in clinically anxious participants and suggest the unique importance of the Negative PB-PEPQ in maintaining PEP and SAD.
Funding
This research received no specific grant from any funding agency, commercial, or not-for-profit sectors.
Declaration of interest
The authors declared that they have no conflict of interest.