INTRODUCTION
Perennial ryegrass (Lolium perenne L.) is one of the most commonly sown grass species in Northwest Europe and is utilized for both forage and amenity purposes (Humphreys et al. Reference Humphreys, Feuerstein, Vandewalle, Baert, Boller, Posselt and Veronesi2010). Since the start of grass-breeding programmes, new varieties have been developed using natural landraces and ecotypes as well as by the creation of valuable gene banks. However, the intensification of forage production combined with progressive breeding based on the current European gene pool have resulted in reductions in the natural diversity of managed grasslands (Humphreys et al. Reference Humphreys, Feuerstein, Vandewalle, Baert, Boller, Posselt and Veronesi2010). Several studies have reported a lack of genetic variability among different cultivars and ecotype populations but high genetic variation within them (Bolaric et al. Reference Bolaric, Barth, Melchinger and Posselt2005a , Reference Bolaric, Barth, Melchinger and Posselt b ; McGrath et al. Reference McGrath, Hodkinson, Charles, Zen and Barth2010; Hu et al. Reference Hu, Li, Li, Sun and Fu2011). Considering the trend of current breeding methods, it might be assumed that only a limited amount of breeding progress can be expected. In recent decades the estimated improvement in, e.g., annual dry matter yield or quality traits of perennial ryegrass has been comparatively low (van Wijk & Reheul Reference van Wijk, Reheul, den Nijs and Elgersma1991; Humphreys Reference Humphreys, Buchanan-Smith, Bailey and McCaughey1999; Casler Reference Casler2001; Wilkins & Humphreys Reference Wilkins and Humphreys2003; Sampoux et al. Reference Sampoux, Baudouin, Bayle, Béguier, Bourdon, Chosson, Deneufbourg, Galbrun, Ghesquière, Noël, Pietraszek, Tharel and Viguié2011; McDonagh et al. Reference McDonagh, McEvoy, O'Donovan and Gillilan2014) compared to other crops (Fischer & Edmeades Reference Fischer and Edmeades2010). The wide range of genetic resources, such as the ecotype populations maintained by European gene banks (Marum et al. Reference Marum, Thomas, Veteläinen, Maggioni, Marum, Sackville Hamilton, Thomas, Gass and Lipman1998) or in permanent grasslands, may enable further expansion of the genetic pool and thereby contribute to prospects for genetic improvements.
The annual yield of forage grasses such as perennial ryegrass, when assessed under cutting management, is mainly determined by the yield harvested at the first cut and thus by the reproductive growth phase (Herrmann et al. Reference Herrmann, Kelm, Kornher and Taube2005). Daily growth rates increase with jointing, which marks the beginning of stem elongation, and they attain maximum levels close to heading (Taube Reference Taube1990; Taube et al. Reference Taube, Wulfes, Kornher and Pulli1992). During this phase, non-structural carbohydrates are accumulated in the stem internodes, reaching peak values when the flag leaf is fully expanded (Matthes Reference Matthes1986; Pollock et al. Reference Pollock, Cairns, Sims, Houseley, Zamski and Schaffer1996; Wulfes et al. Reference Wulfes, Nyman and Kornher1999). Thus, heading seems to be an appropriate date for harvesting, in terms of fulfilling both the yield (Wulfes et al. Reference Wulfes, Nyman and Kornher1999) and quality trait requirements (Taube Reference Taube1990; Herrmann Reference Herrmann1999). Accordingly, significant correlations between the date of ear emergence and dry matter yield and feeding value have been reported (Sampoux et al. Reference Sampoux, Baudouin, Bayle, Béguier, Bourdon, Chosson, Deneufbourg, Galbrun, Ghesquière, Noël, Pietraszek, Tharel and Viguié2011). In contrast, studies by Burns et al. (Reference Burns, Gilliland, Grogan, Watson and O'Kiely2013) and Gilliland et al. (Reference Gilliland, Barrett, Mann, Agnew and Fearon2002) detected no or low effects of maturity group on annual dry matter yield and forage quality.
Since the above-mentioned studies provide no clear evidence for the effect of heading date on crop performance, it can be assumed that other phenological traits have a significant influence and these should be considered further. Thus, it may be supposed that perennial ryegrass genotypes would show wide variability in phenological traits, including significant genotypic variation in the length of the critical phase, i.e. the period between the onset of stem elongation (i.e. jointing) and heading. The term ‘critical phase’ is derived from a plant physiology perspective, indicating that this phase combines optimum source–sink relationships for the highest net assimilation rates and maximum accumulation levels of highly digestible energy reserves (Schnyder Reference Schnyder1993). It is hypothesized that the length of the critical phase may be considered as a new approach for plant-breeding processes and could be used as a selection criterion for improving yield and quality parameters as well as for specific purposes such as drought escape, adaptation to cool spring conditions or the usage for cutting or grazing. Therefore, the objectives of the present study were to determine: (i) the presence of phenotypic and genotypic variation in the phenological traits, especially in the length of the critical phase, and (ii) the relational patterns among the phenological traits in the first reproductive growth of single plants of perennial ryegrass genotypes representing eight ecotype populations that occur in Northern Germany.
MATERIALS AND METHODS
Collection of plant material
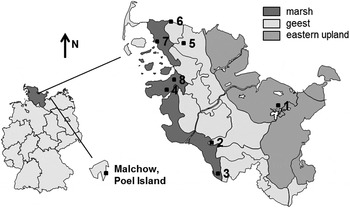
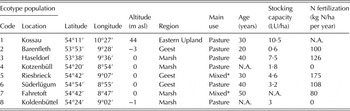
The set of plant material used in the present study comprised 300 perennial ryegrass genotypes, representing eight different ecotype populations. Each population consisted of 26–44 single plants. The plant material was collected in spring 2010 from eight permanent grassland swards throughout Schleswig-Holstein, Northern Germany (Fig. 1 and Table 1). The sites were characterized by having different soil types, ranging from very fertile clay soils (marsh) and loamy soils (eastern upland) to poor sandy soils (geest). Sampling was limited to swards that were known to be at least 20 years old, with no reseeding having taken place during this time. Information about the cultivars originally sown was not available due to the age of the swards. The swards had been used mainly as pastures, with different levels of management intensity. Plant samples were removed as entire single plants using a spade and later split into single culms.
Geographic distribution of the eight ecotype populations in Schleswig-Holstein and location of the experimental site on Poel Island, Northern Germany.

Site characterization of the eight ecotype populations collected throughout Schleswig-Holstein, Northern Germany

LU, livestock unit; N.A., data not available.
* 1–2 silage cuts followed by grazing.
Experimental setup and management
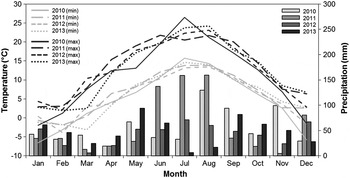
The genotypes were evaluated in three unreplicated field trials conducted in three successive years (2011–13) on Poel Island (53°59′N, 11°28′E; 5 m asl), Northern Germany. The experimental site is characterized by stagnic luvisol soils (IUSS Working Group WRB 2014) and has a predominantly maritime climate. The experimental design was a randomized complete block design with one replicate per year, where block and year effects were confounded and thus replication was ensured. The trials were newly established at different areas of the experimental site in each experimental year. To this end, clones of the genotypes were planted in the preceding autumn (11 October 2010; 20 September 2011; 17 September 2012) to adapt and to vernalize the plant material. In 2011 only one clone per genotype was planted, whereas in 2012 and 2013 three single clones per genotype were available. The distance between individual plants was 0·35 m in 2011 and 0·4 m in 2012 and 2013. The three trial areas (2011: 3 × 18 m2; 2012: 6·5 × 40 m2; 2013: 9 × 20 m2) were prepared by conventional tillage, i.e. ploughing and seedbed preparation, and were previously managed as arable land. In early spring, the areas received mineral nitrogen (N), phosphorus (P) and potassium (K) fertilizer at the rate of 80 kg N/ha, 24 kg P/ha and 44 kg K/ha in 2011 and 60 kg N/ha, 18 kg P/ha and 33 kg K/ha in 2012 and 2013. Weeds were removed manually. Additionally, herbicides were applied in autumn 2011 (0·1 l/ha Primus (i.e. 50 g/l Florasulam); Dow AgroSciences, Munich, Germany), spring 2012 (3·0 l/ha Basagran DP (i.e. 333 g/l Bentazon and 233 g/l Dichlorprop-P); BASF, Limburgerhof, Germany) and spring 2013 (1·5 l/ha FOX OS (i.e. 480 g/l Bifenox); ADAMA Deutschland, Cologne, Germany) against annual dicotyledonous weeds. To avoid drought stress in spring 2012, the plants were irrigated once (30 mm) at the end of May. The weather conditions, in terms of precipitation and temperature, are summarized in Fig. 2. Meteorological data were obtained from the local Deutscher Wetterdienst (DWD) weather station at Poel Island (c. 2 km north of the experimental site).
Mean monthly minimum and maximum temperatures and total monthly rainfall recorded at local meteorological DWD weather station on Poel Island, Northern Germany for the years 2010–13.

Characterization of plant material
The phenological development in the reproductive first growth of each genotype was quantified according to the grass developmental scale of Gustavsson (Reference Gustavsson2011). The following phenological traits were recorded: jointing (stage 31; first node is palpable), heading (stage 50; first spikelet of the inflorescence just visible above the leaf sheath of the flag leaf) and flowering (stage 61; first anther visible), provided as number of days after 1 April. For single plants, a phenological trait was considered to have been achieved when at least three stems showed the appropriate stage. The critical phase of stem elongation was calculated for each genotype on the basis of the date of jointing and heading.
Statistical analysis
Data were analysed by the statistical software R 3·0·2 (R Development Core Team 2013) and PLABSTAT 3A (Utz Reference Utz1993), assuming they were normally distributed. First, a moving average adjustment was conducted for each experimental year to adjust the genotype observations for spatial variation in the unreplicated field trials (Kempton Reference Kempton1984; Kempton & Gleeson Reference Kempton, Gleeson, Kempton, Fox and Cerezo1997). Therefore, for each genotype, the observed values of the four neighbouring genotypes to its right and left as well as the one above and below were averaged and used as covariates to adjust the genotype observations according to the following Eqn (1):
 $$y_{i{\rm, adj}} = y_{i{\rm, obs}} + b\;(\bar x - x_i )$$
where y
i,obs is the observed value of the ith genotype, x
i
the moving average of the ith genotype,
 $\bar x$
the mean of all moving averages and b the regression coefficient of the regression between observed values and moving averages. The resulting adjusted genotype observations were used for further analyses.
Using a mixed-effect model, quantitative genetic parameters were estimated for phenological data by assuming genotype as a random effect and year as fixed. The lack of replications within a year due to the unreplicated design meant that the genotype × year-interaction was confounded with the residual error (see Eqn (3); for validity of unreplicated designs in multi-environmental trials see Moehring et al. Reference Moehring, Williams and Piepho2014). The phenological data (y) were analysed according to following model (Eqn (2)):
 $$y_{ij} = \mu + G_i + S_j + e_{ij} $$
 $$e_{ij} = {\rm GS}_{ij} + \varepsilon _{ij} $$
where μ is the general mean, G
i
the effect of the ith genotype (i = 1–300), S
j
the effect of the jth year (j = 1,2,3) and e
ij
the error term which is composed of the genotype × year-interaction GS
ij
and the residual error ε
ij
. In accordance with the method of Comstock & Robinson (Reference Comstock and Robinson1952) genotypic
 $\left( {\hat \sigma _g^2} \right)$
and phenotypic
 $\left( {\hat \sigma _p^2} \right)$
variance components were obtained from an analysis of variance (ANOVA) table using the following Eqns (4) and (5):
 $$\hat \sigma _g^2 = \displaystyle{{{\rm MS}1-{\rm MS}2} \over s}$$
 $$\hat \sigma _p^2 = \displaystyle{{{\rm MS}1} \over s}$$
where MS1 is the mean square of genotype, MS2 the mean square of error term and s the number of years. Significances were checked with an F-test. Broad sense heritability (h 2) was estimated as the ratio of genotypic to phenotypic variance according to Falconer (Reference Falconer1989) using Eqn (6):
 $$h^2 = \displaystyle{{\hat \sigma _g^2} \over {\hat \sigma _g^2}} $$
The inherent 95th percentile confidence interval (CI) was computed corresponding to Knapp & Bridges (Reference Knapp and Bridges1987) (Eqns (7) and (8)):
 $${\rm CI}_{{\rm lower}} = 1-F_{\alpha /2;{\rm df1\!; df2}} \times \left( {\displaystyle{{{\rm MS}2} \over {{\rm MS}1}}} \right)$$
 $${\rm CI}_{{\rm upper}} = 1-F_{1 - \alpha /2;{\rm df1\!; df2}} \times \left( {\displaystyle{{{\rm MS}2} \over {{\rm MS}1}}} \right)$$
where F is the F value out of F distribution, α the probability of error (α = 5%), df1 the degrees of freedom of the genotype, df2 the degrees of freedom of the error term, MS1 the mean square of genotype and MS2 the mean square of the error term. The genotypic coefficient of variation (GCV) was calculated according to Singh & Chaudhary (Reference Singh and Chaudhary1985) using Eqn (9):
 $${\rm GCV} = \; \displaystyle{{\sigma _g} \over \mu} $$
where μ is the general mean and σ g the square root of genotypic variance component (genotypic standard deviation). The genetic advance (GA) also referred to as response to selection and the genetic advance as percentage of general mean (GA%) (Singh & Chaudhary Reference Singh and Chaudhary1985) were determined using Eqns (10) and (11):
 $${\rm GA} = \; \; i_\alpha \times \sigma _g \times h$$
 $${\rm GA}\% = \left( {\displaystyle{{{\rm GA}} \over \mu}} \right) \times 100$$
where i
α
is the intensity of selection (at α = 5% i is 2·06), σ
g
the square root of genotypic variance, h the square root of heritability and μ the general mean. The genotypic
 $(\hat \rho _g )$
and phenotypic
 $(\hat \rho _p )$
coefficients of correlations of phenological data were calculated in accordance with Mode & Robinson (Reference Mode and Robinson1959) (Eqns (12) and (13)) and include the total genotypic and phenotypic variance, respectively:
 $$\hat \rho _g = \displaystyle{{\hat \sigma _{g{\rm ^{\prime}}g^{\prime\prime}}} \over {\sqrt {(\hat \sigma _{g{\rm ^{\prime}}}^2 {\rm \; \times \;} \hat \sigma _{g^{\rm \prime\prime}} ^2 )}}} $$
 $$\hat \rho _p = \displaystyle{{\hat \sigma _{\,p{\rm ^{\prime}}p{\rm ^{\prime\prime}}}} \over {\sqrt {(\hat \sigma _{\,p{\rm ^{\prime}}}^2 {\rm \; \times \;} \hat \sigma _{\,p{\rm ^{\prime\prime}}} ^2 )}}} $$
where
 $\hat \sigma _{g{\rm ^{\prime}}g{\rm ^{\prime\prime}}} $
is the genotypic and
 $\hat \sigma _{p{\rm ^{\prime}}p{\rm ^{\prime\prime}}} $
the phenotypic covariance between the two traits.
The effect of the origin of ecotype populations and of the year as well as of their interaction on phenological development was estimated by an ANOVA according to following model (Eqn (14)). Both factors were assumed as fixed effects.
 $$y_{ij} = \mu + O_i + S_j + OS_{ij} + \varepsilon _{ij} $$
where μ is the general mean, O i the effect of the ith origin (i = 1–8), S j the effect of the jth year (j = 1, 2, 3), OS ij the effect of origin × year-interaction and ε ij the residual error. Differences among the sites of origin and years were estimated using pairwise multiple comparisons of means with a Tukey test.
RESULTS
Distribution of phenological data
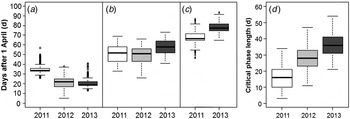
Based on a visual presentation of the data (Fig. 3), the 300 perennial ryegrass genotypes showed a high level of variation in the phenological traits (no data analysis for flowering can be reported for 2012 due to missing values). Jointing, heading, flowering and the critical phase covered a wide range of about 30–40 days in all 3 years and included very early up to very late types, as a comparison with an adjacent trial confirmed (data not shown), which comprised registered cultivars belonging to all nine maturity groups as classified by the German Federal Plant Variety Office (2011). In jointing and flowering, the interquartile range was relatively small, which led to some outliers. The critical phase showed a similar distribution but increasing values for the 3 years. This effect resulted from differences in jointing and heading among the years.
Distribution of the phenological traits of jointing (a), heading (b), and flowering (c) in days after 1 April, and critical phase (d) length in days of 300 perennial ryegrass genotypes in the years 2011–13. Flowering was analysed for 2 years only (2011, 2013).

Quantitative genetic parameters
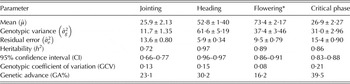
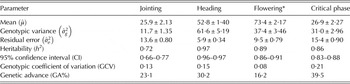
For a more specific characterization of the variation detected in the phenological data, estimators of quantitative genetic parameters were calculated (Table 2). The estimated genotypic variance was significant for all tested traits (P < 0·001). Based on the genotypic coefficients of variation, the highest estimated genotypic variance was found for the critical phase. For jointing, the estimated variance of error term was higher than the genotypic variance component. The estimated heritability was moderate in jointing and very high in the other traits combined with narrow CI. The corresponding theoretical genetic advance within a selection intensity of α = 5% ranged from 16 to 40% and it was highest in the critical phase.
Estimators of quantitative genetic parameters provided with their standard errors (± s.e.) for the phenological traits of jointing, heading, flowering and the critical phase analysed for 3 years (2011–13). Means are provided in days after 1 April or as critical phase length in days
* Analysed for 2 years only (2011, 2013).
When differentiating plant material with respect to the origin of ecotype populations it was found that plants from all eight origins showed significant genetic variance in all phenological traits (P < 0·001; data not shown). The critical phase exhibited the highest estimated genotypic coefficients of variation. Except for origins 6 and 8, data analysis revealed generally high heritability in heading and the critical phase combined with narrow CI. For jointing, moderate heritability in combination with broad CI were detected.
Phenotypic and genotypic coefficients of correlations, which provide some indication of relations among the phenological traits, are presented in Table 3. All phenological traits exhibited significant positive correlations with each other. The estimators of phenotypic coefficients of correlation were significant at P < 0·01, whereas the absolute values of genotypic coefficients of correlation were greater than the doubled s.e. Heading, flowering and the critical phase revealed very close relationships. In contrast, low to moderate genotypic and phenotypic correlations showed less-close relationships of jointing with heading, flowering and the critical phase.
Estimated phenotypic (
 $\hat \rho _p $
above the diagonal) and genotypic (
 $\hat \rho _g $
below the diagonal) coefficients of correlation for the phenological traits of jointing, heading, flowering and the critical phase analysed for 3 years (2011–13)

* Analysed for 2 years only (2011, 2013).
Relational patterns among phenological traits
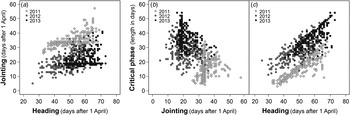
As there were low to high genotypic and phenotypic correlations among the phenological traits, the interdependency of heading, jointing and the critical phase was analysed in detail (Fig. 4). Irrespective of heading, most genotypes exhibited early onset of jointing. With delayed heading date, late jointing genotypes occurred. The combination of late jointing and early heading also occurred, but less frequently. In contrast, the length of the critical phase showed a clear positive relationship with heading and tended to increase for later heading dates. However, there were also genotypes that showed a short critical phase in the intermediate- and late-heading range. The relationship between the critical phase and jointing was more diverse and allowed classification into four categories to describe the relational patterns among the phenological traits: (C1) early onset of jointing coupled with a short critical phase and early heading; (C2) early onset of jointing linked to a long critical phase and late heading; (C3) late onset of jointing combined with a short critical phase and an intermediate heading; and (C4) late onset of jointing connected with a long critical phase and late heading. This classification into the four categories was based on the quadrants formed by the annual mean values of the variables critical phase and jointing. Most genotypes belonged to the first or second category. A proportion of about 86% of all genotypes remained stable in their quadrants over at least 2 years.
Relationship between the phenological traits of jointing and heading (a), and the critical phase in relation to jointing (b) and heading (c) of 300 perennial ryegrass genotypes for the years 2011–13.

Differences among ecotype populations
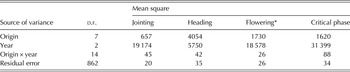
To quantify potential differences among the ecotype populations, the impact of the site of origin of ecotype populations and of the year was investigated by an ANOVA (Table 4). Both factors revealed significant (P < 0·001) effects for all phenological traits. Significant interactions between origin and year were detected for jointing (P < 0·01) and the critical phase (P < 0·001). The factors explained 72% of the variation in jointing and in the critical phase, 68% in flowering and 57% in heading. The mean squares imply a stronger influence of year than of the site of origin.
Analysis of variance for the phenological traits of jointing, heading, flowering and the critical phase effected by the origin, i.e. the ecotype population, and the year (2011–13)

d.f., degrees of freedom.
* Analysed for 2 years only (2011, 2013) (Year 1 d.f.; Origin × year 7 d.f.; Residual error 568 d.f.).
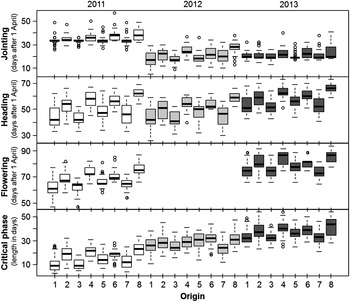
The quantification of differences among the ecotype populations (Fig. 5) revealed an obvious pattern, where origins seemed to form two significantly different groups. Origins 1, 3 and 7 exhibited the lowest mean values in all phenological traits, no significant differences were detected among them. In contrast, origins 4, 6 and 8 achieved the highest values for all traits. Between origins 8 and 4, and 4 and 6, respectively, no significant differences were detectable. Between origin 8 and 6 various significant differences were found. Origins 2 and 5 showed inconsistent patterns.
Box plots of the phenological traits of jointing, heading, flowering and the critical phase for the eight origins of perennial ryegrass ecotype populations for the years 2011 (white), 2012 (light grey) and 2013 (dark grey). Flowering was analysed for 2 years only (2011, 2013).

DISCUSSION
Since the mid-20th century there has been widespread agricultural improvement of grasslands in Europe, which has been achieved by changes in management and also by re-seeding of semi-natural swards with new cultivars to replace the long-established ecotype populations (Posselt Reference Posselt2000; Emanuelsson Reference Emanuelsson2008). The use of more uniform cultivars is likely to have reduced the amount of variation. Permanent grassland can be regarded as having an essential role in the preservation of genetic diversity and, at the same time, it provides a valuable resource for the enhancement of existing gene pools that can be used for breeding new cultivars (Rognli et al. Reference Rognli, Fjellheim, Pecetti and Boller2013). However, due to poor phenotypical characterization of genetic resources, their utilization is restricted (Humphreys Reference Humphreys2003). The present study investigated the variability in phenological traits of various ecotype populations. The origin of these populations had a significant impact on the overall variance that was detected, but in the case of jointing and the critical phase, significant interactions of origin and growing season revealed a non-stable influence. These effects could not be attributed to differences in adaption to environmental conditions, management or method of utilization (grazing v. cutting). The absence of re-seeding or re-establishment of swards could have led to the development of new population structures over time (Cashman et al. Reference Cashman, Gilliland, O'Donovan and McEvoy2014). Therefore, the significant differences among the ecotype populations suggest the presence of genetic diversity, at least in the case of permanent grasslands of Northern Germany. The different environmental conditions of single plants compared with swards, especially with regard to the level of interplant competition, may limit the validity of observations. However, good transferability from single plant observations to swards is shown by traits that are only slightly affected by genotype × environment interactions (Casler Reference Casler2001; Casler & van Santen Reference Casler, van Santen, Boller, Posselt and Veronesi2010) such as phenological traits (Cooper Reference Cooper1959).
The observed genotypic and phenotypic variation in the whole plant material was, as expected, rather high. The lowest estimated genotypic variation was detected in jointing, because the onset of floral transition depends essentially on vernalization, critical temperatures in spring, and photoperiodism (primary and secondary induction) (Cockram et al. Reference Cockram, Jones, Leigh, O'Sullivan, Powell, Laurie and Greenland2007; Colasanti & Coneva Reference Colasanti and Coneva2009). Moderate heritability in jointing confirms the predicted large environmental effect. However, since vernalization requirement, as the most important factor in primary induction of perennial ryegrass (Aamlid et al. Reference Aamlid, Heide and Boelt2000), is obligatory and large (Cooper Reference Cooper1960; Evans Reference Evans1960), the detected variation and heritability in jointing suggest that the genotypes differ in their vernalization response. Early-jointing genotypes seem to be less sensitive to vernalization than late-jointing genotypes. These differences might have been caused by varying climatic and agronomic origins of the ecotype populations (Cooper Reference Cooper1960; Halligan et al. Reference Halligan, Forde and Warrington1993). High heritability in heading, flowering and the critical phase indicates the qualitative genetic nature of these traits, which is almost independent of environmental influences. In the case of heading and the critical phase, high heritability linked with high theoretical genetic advance implies further additive genetic effects and simple heritable traits. The genotypic variation in heading is attributable to its strong genetic fixation (Hayward et al. Reference Hayward, McAdam, Jones, Evans, Evans, Forster, Ustin, Hossain, Quader, Stammers and Will1994; Armstead et al. Reference Armstead, Turner, Farrell, Skøt, Gomez, Montoya, Donnison, King and Humphreys2004). After successful transition, environmental influences have only slight effects on genes related to the flowering pathway, as indicated by Amasino & Michaels (Reference Amasino and Michaels2010). This should also apply to flowering, but if high temperatures in late spring are combined with water shortages, flowering will be affected and this in turn leads to lower genotypic variation. This kind of abiotic stress, for example, can cause premature flowering (Levitt Reference Levitt1972; Jones et al. Reference Jones, Turner, Osmond, Paleg and Aspinall1981). The greatest extent of genotypic variation was detectable in the critical phase, because the physiological processes of both heading and jointing play a crucial role. Additionally, the relationship of jointing and heading influences the extent of variability of the critical phase. The lower the correlation between jointing and heading, the higher the variation in the critical phase. In this case, however, the correlation between heading and the critical phase will also decrease, while the correlation between jointing and the critical phase would be negative.
In the case of the above-described phenological traits there are strong genetic relationships. Estimated genotypic coefficients of correlation close to unity between heading, flowering and the critical phase were attributable to the same genetic background. Most genes involved in flowering pathways have a crucial impact on timing of flowering, but play no role during floral transition (Casler & van Santen Reference Casler, van Santen, Boller, Posselt and Veronesi2010). Other genetic pathways (i.e. vernalization, light-dependent, gibberellin and autonomous pathway) have an effect on developmental regulations during jointing (Cockram et al. Reference Cockram, Jones, Leigh, O'Sullivan, Powell, Laurie and Greenland2007), which in turn are of minor importance after successful transition. The estimated genotypic correlation with jointing was, therefore, even lower.
The relational patterns of phenological traits revealed some striking features. The onset of jointing is commonly assumed to be late in varieties that are classified as belonging to the late maturity group, as indicated by several studies (Taube Reference Taube1986; Petersen Reference Petersen1989; Wulfes Reference Wulfes1993) that monitored the phenological development of the older perennial ryegrass cultivars Gremie (early maturity) and Vigor (late maturity). This assumption was also made by Cooper (Reference Cooper1951, Reference Cooper1952), who observed ear initiation and ear emergence of strains of the cultivars Aberystwyth S.24 (early flowering) and S.23 (late flowering). This resulted in the hypothesis that the critical phase is of approximately equal length, irrespective of heading date, but due to higher photoperiodic threshold and delayed development it may be longer for late types (Cooper Reference Cooper1952). The present study does not fully support these conclusions. Most of the genotypes that were classified as belonging to the late heading types had the same date of jointing as the early ones. Therefore, late heading genotypes did not reveal more or less equally short critical phases, as expected, but relatively long critical phases. For previously described categories C1 and C2, which were characterized by early jointing coupled with early or late heading, heading date had a large effect on the critical phase, as confirmed by high coefficients of correlation. Nevertheless, there was also slight variation for late jointing linked with intermediate and late heading, respectively (categories C3 and C4). In this case, the length of the critical phase was not crucially affected by heading date, although the association between phase length and heading also had a positive correlation. However, late occurrence of jointing led unavoidably to intermediate or late heading, irrespective of the length of the critical phase. This implies that the occurrence of jointing had an equally determinative effect on phase length, possibly due to the moderate coefficients of correlation. Summarizing these results with respect to the heading date (maturity) groups, the highest variation in the length of the critical phase was found within the late heading group. A long critical phase predominated, but short to intermediate critical phase lengths were abundant. In the intermediate heading group, the variance decreased. There was some variation for short critical phases (category C3) as well as for long critical phase length. In the early heading group, the length of the critical phase was always short.
The four ideotypes which have arisen from the classification of relational patterns may be useful for different approaches and strategies in forage crop production, especially with regard to prevalent weather conditions and future climate change scenarios. Genotypes belonging to category C1, for instance, could be used for the so-called escape strategy in the context of global warming. The rapid transition and fast reproductive development during the first growth would allow such genotypes to escape the effects of decreasing water availability in summer, as has been discussed for arable crops (Araus et al. Reference Araus, Slafer, Reynolds and Royo2002; Bueckert et al. Reference Bueckert and Clarke2013) and which has been shown for winter annual crops in the Mediterranean region (Kigel et al. Reference Kigel, Konsens, Rosen, Rotem, Kon and Fragmann-Sapir2011). Moreover, a prevalence for cutting is likely to be appropriate. In contrast, the extended vegetative developmental phase that occurs before jointing, as shown for genotypes of categories C3 and C4, may be advantageous for forage production in regions of the northern hemisphere which are characterized by cool temperatures in spring and a short summer season. Furthermore, it can be assumed that genotypes with a prolonged critical phase (especially genotypes of category C2) could exhibit higher contents of non-structural carbohydrates as well as higher growth rates. In this context, and combined with a high tillering capacity, a prevalence for grazing is likely to be appropriate.
In conclusion, the present study has revealed the existence of large variation in the phenological traits of jointing, heading, flowering and the critical phase. A high amount of this variability is heritable and may be used for different breeding purposes in perennial ryegrass. Significant differences among the ecotype populations imply that at present there is genetic diversity in perennial ryegrass in permanent grassland, at least for grasslands of Northern Germany. The high correlations between heading and the critical phase indicate that further analysis of this diversity may be justified, especially if an extended critical phase leads to a benefit in yield and quality parameters. Therefore, the next stage will be to conduct an analysis of the relational patterns between the phenological traits and yield and quality traits, respectively.
Financial support for the current research was obtained from the founding programme ‘University – Economy – Transfer’, financed by the Innovationsstiftung Schleswig-Holstein of the Ministry of Science, Economic Affairs and Transport, Schleswig-Holstein, Germany, and the Norddeutsche Pflanzenzucht Hans-Georg Lembke KG, Germany, which are gratefully acknowledged. Special thanks go to C. Klinggraff-Gessulat, W. Luesink and B. Ingwersen for all their valuable support during data acquisition and to A. Hopkins for linguistic editing of the manuscript. The Deutscher Wetterdienst is also acknowledged for providing weather data.