1. Introduction
Suppose Pam wants to buy a cat at the pet store. She goes to the counter and asks: “Is the calico cat still available?” As she speaks, Pam belatedly realizes that she has been ambiguous, so she adds: “The one with brown streak on its paws.” In contexts such as this one, speakers’ ability to produce a sentence that adequately resolves ambiguity for listeners often hinges on careful advance planning. Previous research has demonstrated that the scope of advance sentence planning − that is, the sizes of the chunks speakers prepare while planning speech − can shift in response to external circumstances such as time pressure (Ferreira & Swets, Reference Ferreira and Swets2002, Reference Ferreira, Swets and Cutler2005) and task complexity (Fuchs, Petrone, Krivokapic, & Hoole, Reference Fuchs, Petrone, Krivokapic and Hoole2013; Wagner, Jescheniak, & Schriefers, 2010). In this paper, we demonstrate that the scope of sentence planning is responsive not just to external pressures, but also to the internal constraint of working memory capacity. We do so by directly associating measures of advance sentence planning with a measure of individual differences in working memory capacity. We introduce two accounts of how working memory capacity might support variability in advance planning − a simple capacity account and an efficient capacity account − and then use our findings to support the efficient capacity account.
1.1. external influences on the scope of sentence planning
Models of language production generally share the assumption that speech planning functions incrementally (Bock & Levelt, 1994; Kempen & Hoenkamp, 1987; Levelt, Reference Levelt1989). This incrementality entails that when planning, for example, at the level of grammatical encoding, speakers do not plan the entire surface structure of an utterance before beginning to articulate the utterance. Some accounts of language production have held that planning at each level of representation is rigid and automatic, and that only chunks of certain sizes are developed within each level of representation. For example, whereas grammatical encoding might be computed on a clause by clause basis (as theorized by, e.g., Ford & Holmes, 1978), phonological encoding might create plans of smaller grain size (as theorized by, e.g., Schriefers & Teruel, 1999).
However, discrepancies in the literature concerning the planning units at these various levels of representation led some researchers to posit an alternative view of speech planning: the flexibly incremental view. On this view, the amount of information prepared by the language production system not only varies from one level of representation to the next (as more rigidly incremental systems also allow), it also varies in response to situational pressures and speaker goals (Costa & Caramazza, 2002; Damian & Dumay, 2007; Ferreira & Swets, 2002, Reference Ferreira, Swets and Cutler2005; Fuchs et al., Reference Fuchs, Petrone, Krivokapic and Hoole2013; Konopka & Meyer, 2010; Korvorst, Roelofs, & Levelt, 2006; Schriefers & Teruel, 1999; Wagner et al., Reference Wagner, Jescheniak and Schriefers2010). This view has prompted researchers to investigate the factors that determine the scope of planning during sentence production, and to examine the implications of these factors for theories of language production architecture. This research has demonstrated a broad range of external circumstances that can alter the scope of utterance planning, with such circumstances ranging from time pressure (Ferreira & Swets, 2002, Reference Ferreira, Swets and Cutler2005), to priming (Konopka & Meyer, 2010), to sentence complexity (Fuchs et al., Reference Fuchs, Petrone, Krivokapic and Hoole2013; Korvorst et al., Reference Levelt2006; Levelt & Meyer, 2000).
1.2. resource costs of planning
One explanation for the variation in planning scope is that these external pressures tax a limited pool of cognitive resources available for utterance planning. Researchers have disagreed about the extent to which speech planning relies upon a limited pool of cognitive resources such as working memory. Although it is largely assumed that the highest levels of planning, such as message planning or conceptualization, require working memory, models of language production have often assumed that grammatical and phonological encoding are automatic (Levelt, Reference Levelt1989; see Garrod & Pickering, 2007, for a review). One tenet of automaticity in cognition is that automatic processes operate independently of limited working memory resources (Garrod & Pickering, 2007). But evidence has mounted suggesting that all higher-level planning, including grammatical encoding, is invested in these limited resource pools (Hartsuiker & Barkhuysen, 2006; Horton & Spieler, 2007; Kellogg, Oliver, & Piolat, 2007; Kemper, Herman, & Lian, 2003; Kemper & Sumner, 2001; Mortensen, Meyer, & Humphreys, 2008; Power, Reference Power1985; Schriefers & Teruel, 1999; Slevc, Reference Slevc2011).
In one study, Hartsuiker and Barkhuysen (Reference Hartsuiker and Barkhuysen2006) found that memory load interacted with working memory span to affect the kinds of utterances speakers produced. The researchers used a dual-task paradigm, in which participants engaged in secondary tasks while speaking. Those secondary tasks involved either a high or low cognitive load. Hartsuiker and Barkhuysen also measured participants’ working memory capacity. Results showed that speakers with low working memory made more subject−verb agreement errors under high load, whereas speakers with high working memory showed equal error rates under both load conditions. The evidence from such studies indicates that working memory is an important resource involved in higher levels of language production.
This earlier research did not examine the link between cognitive resources and flexibility in the scope of planning. Subsequent research by Wagner et al. (Reference Wagner, Jescheniak and Schriefers2010), however, is suggestive of such a link. Wagner et al. manipulated the presence of cognitive load on speakers in a picture−word interference task. In earlier work, Meyer (Reference Meyer1996) had speakers produce simple sentences such as “The frog is next to the mug”. Before they began their utterances, the speakers heard distractor words (e.g., toad for frog or cup for mug). Initiation times slowed when toad was presented with frog, indicating that speakers were planning the first noun before beginning to speak. But cup similarly interfered with mug, indicating that the speakers extended the scope of their planning to the entire sentence.
Wagner et al. (Reference Wagner, Jescheniak and Schriefers2010) replicated these effects in their Experiment 1a, then examined whether additional cognitive load could reduce the scope of planning. When more complex sentences, such as “the blue frog is next to the red mug”, were preceded by interfering words in Experiments 1b and 1c, there was a smaller interference effect for the second noun phrase than had been observed for simpler sentences. This result suggested that the additional load of planning the color terms reduced the scope of advance grammatical planning. Wagner et al. tested this possibility in two subsequent experiments. In Experiment 2, the researchers left speakers unaware in advance whether they would be producing simple or complex sentences which, in effect, added cognitive load. In this experiment, neither simple nor complex sentences showed evidence of advance grammatical planning for the second noun phrase. Experiment 3 used a more standard dual-task paradigm such that speakers performed a working memory task concurrently with planning. However, the dual task failed to produce a reduction in planning scope.
Wagner et al.’s (Reference Wagner, Jescheniak and Schriefers2010) work implies that limits on working memory might help explain variability in the scope of utterance planning. However, the data can only tentatively support that hypothesis. To start, the lack of reduction in scope from the standard dual-task paradigm of Experiment 3 raises some questions about the general importance of working memory. In addition, the manipulation in Experiment 2 that showed evidence of reduced scope was an external manipulation of task demands like those we summarized earlier (such as time pressure and utterance complexity). This external manipulation was only indirectly associated with working memory capacity. One way to provide additional evidence to strengthen the claim that internal working memory constraints help explain flexibility in advance planning would be to show that individual differences in working memory capacity predict individual differences in the scope of advance planning.
Prior research has found evidence for individual differences in planning efficiency (Mortensen et al., Reference Mortensen, Meyer and Humphreys2008) and scope (Schriefers & Teruel, 1999), but no research has linked individual differences in working memory in particular with individual differences in planning scope. Wagner et al. (Reference Wagner, Jescheniak and Schriefers2010) provided the closest precedent in post-hoc analyses that they intended to argue against alternative explanations for their results. Wagner et al. used average initiation times to divide their participants into ‘slow’ responders and ‘fast’ responders. The average speed with which speakers initiated articulation predicted the scope of planning. In general, fast responders showed reduced interference effects at the second noun position compared to slow responders, implying that they were less likely to plan very far ahead. Other research from sentence comprehension has shown that participants with higher working memory capacity tend to create larger implicit prosodic chunks while reading silently (Swets, Desmet, Hambrick, & Ferreira, 2007). It is possible that this tendency during comprehension is similar to the manner in which chunks of information are prepared during production.
The primary goal of this paper is to provide strong evidence in favor of a resource-based explanation for flexibility in the scope of speech planning. To do so, we turn our attention to individual differences in working memory capacity. We test the hypothesis that speakers with greater working memory capacity are more likely to prepare information with a longer scope in advance of articulation than speakers with less working memory capacity. Previous studies have demonstrated that working memory plays a role in planning processes in general (Hartsuiker & Barkhuysen, 2006; Kellogg et al., Reference Kellogg, Oliver and Piolat2007; Slevc, Reference Slevc2007; Wagner et al., Reference Wagner, Jescheniak and Schriefers2010), and that there are individual differences in the extent to which speakers plan incrementally (Mortensen et al., Reference Mortensen, Meyer and Humphreys2008; Schriefers & Teruel, 1999; Wagner et al., Reference Wagner, Jescheniak and Schriefers2010). However, additional evidence is required to support the possibility that individual differences in planning scope can be attributed to individual differences in working memory.
Our project also contrasts two accounts of how and why working memory capacity could have an impact on the flexibility of individual speakers’ utterance planning. The simple capacity account emerges from discussions by Just and Carpenter (Reference Just and Carpenter1992) and Hartsuiker and Barkhuysen (Reference Hartsuiker and Barkhuysen2006), who presented arguments that working memory primarily aids language processing by providing greater total activation and storage, allowing for increased abilities to comprehend (Just & Carpenter, 1992) and produce (Hartsuiker & Barkhuysen, 2006) complex sentences that require larger storage and processing capacities. According to the simple capacity account, greater working memory capacity may help set the scope of planning simply because increased capacity allows for the storage of larger message plans. This account predicts that low-span speakers would neglect to take the time to plan more information in advance because of a lack of capacity to keep the plan around long enough to articulate the whole utterance. As a result, low-span speakers should tend to forge ahead with what little is planned. By contrast, high-span speakers should take the time to develop larger chunks.
On the other hand, the efficient capacity account proposes that working memory not only allows greater capacity for storing utterance plans, but also allows greater temporal efficiency in creating the plans. This possibility emerged from two sources. First, in a previous project from our laboratory, participants described arrays of images containing ambiguous tangrams with or without a co-present addressee (Swets, Jacovina, & Gerrig, 2013). Speakers with addressees provided longer, more helpful tangram descriptions than speakers without addressees, and did so without a corresponding increase in planning time. In short, speakers planned utterances more efficiently in the presence of an addressee. It is therefore possible that, just as external pressures can produce circumstances under which planning can be accomplished more or less efficiently, so might the relative availability of internal resource constraints. This efficient capacity account also emerges from proposals that individual differences in working memory capacity are largely a function of differences in domain-general executive attention (for summaries, see Kane, Conway, Hambrick, & Engle, 2007, and Conway et al., 2005), and from findings in this literature that high-span individuals can gather and use more information in equivalent time windows compared to low-span individuals (Heitz & Engle, 2007).
According to this efficient capacity account, high-span speakers would plan more material prior to speech than low-span speakers by increasing attentional resources devoted to critical information, and inhibiting attention to less critical information. On this view, high-span speakers are able to use each segment of time they spend planning an utterance more efficiently to create larger plans. Hence, high-span speakers might create and store larger chunks compared to low spans, but do so without a temporal cost. In essence, then, both accounts would suggest that high-span speakers plan more in advance than low-span speakers. The question is whether they require additional time to do so. We will provide evidence that favors this efficient capacity account.
1.3. the current study
To explore the relationship between working memory and planning flexibility, we monitored speakers’ eye-movements while they described arrays of images (Griffin, Reference Griffin2001; Griffin & Bock, 2000; Meyer, Reference Meyer1996; Smith & Wheeldon, 1999). This task allows us to determine the timecourse with which speakers with different working memory capacities gather information to plan an utterance. We adapted our paradigm from work by Brown-Schmidt and Tanenhaus (2006), in which speakers described a target object highlighted among an array of objects. In that project, speakers described the objects for partners whose job was to move target objects on the computer screen to another location. The variable of interest was whether the target object had a matching object of a different size in the array. Results showed that if a target object had a contrast object, speakers were more likely to modify the noun phrases prenominally (e.g., “the small triangle”) as long as the participant fixated the contrast early on in the trial. When the contrast was fixated later in the trial, speakers would adjust their utterances either by preceding the prenominally modified noun with a disfluency (e.g., “the … uh … small triangle”) or by modifying the noun postnominally (e.g., “the triangle … small one”).
In the present paradigm, the timing of modification early or late in the utterance provides an indication of the scope of the speaker’s advance planning. The aspect of planning that is the focus of the current study was also the focus of Brown-Schmidt and Tanenhaus (2006): the interface between message-level planning (i.e., the development of a message to be conveyed), and utterance planning (in this case, the development of referring expressions; see also Brown-Schmidt & Konopka, 2008). Smith and Wheeldon (Reference Smith and Wheeldon1999, Reference Smith and Wheeldon2001) have termed this ‘high-level’ planning because it involves both message-level planning and grammatical encoding but excludes lower-level aspects of planning such as phonological encoding. Because message information, apprehended via eye-movements, was integrated so rapidly into speech plans on the fly in their experiments, Brown-Schmidt and Tanenhaus (2006) concluded that message planning and utterance planning interface in a way that reflects a very short scope of incrementality. We are convinced by the results of this work that messages certainly can be mapped in an incremental manner. However, we will provide evidence that this message-level interface with utterance planning is flexible in response to internal resource constraints.
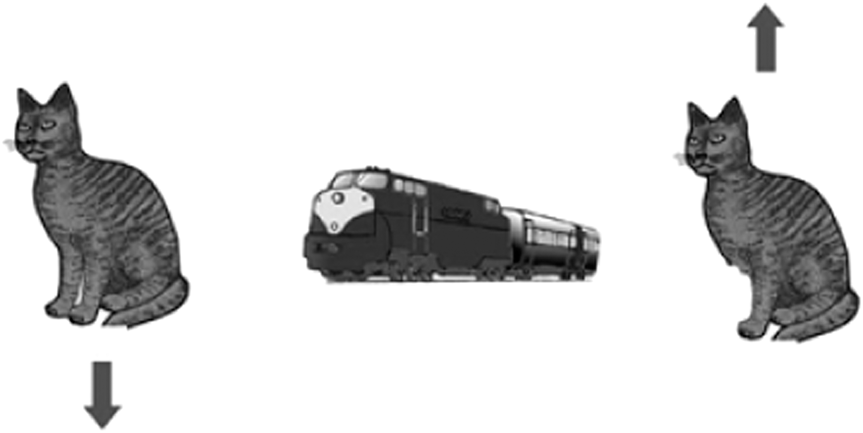
Toward this end, our experiment also manipulated the presence of an object that contrasted with another object in a display. We asked participants to describe arrays of objects, as in Figure 1, to addressees whose own displays had parallel ambiguities. The addressees then had to move their corresponding objects correctly into their new positions. In experimental conditions, we presented, for example, a cat with four legs in the first position, and a cat with three legs in the third position. Under these circumstances, a long scope of message planning would allow a speaker to gather information about both cats early enough to linguistically specify a particular cat for the addressee. For example, a speaker might begin their utterance with a description that modifies the first cat being described, such as by saying “the four-legged cat” or “the cat with all legs intact” rather than the ambiguous description of “the cat”. Our hypothesis was that individual differences in working memory would predict individual differences in the extent to which speakers engaged in such advance sentence planning.
Example of a contrast display from Phase II of the experiment. The target utterance for this display is The four-legged cat moves below the train and the three-legged cat moves above the train.

We follow the lead of Brown-Schmidt and Tanenhaus (2006) by framing our hypotheses with respect to temporal analysis of speech initiation, eye-movement data, and qualitative analysis of natural speech. Our first measure was initiation time to begin speaking. This measure allowed us to examine whether speakers slowed down to plan for the more complex contrast condition, in which two cats were present and needed to be distinguished. Initiation time will help distinguish between two possible accounts of the relationship between working memory and planning scope. According to the simple capacity account, speakers with more working memory capacity (high-span speakers) would take longer to begin speaking in the presence of a contrast than speakers with lower working memory (low-span speakers) because they are engaging in more advance planning that consumes time. According to the efficient capacity hypothesis, high-span and low-span speakers would show equivalent initiation times, leaving other measures of advance planning to reveal an extended planning scope for high-span speakers.
Our second measure was eye-movements during very early (initiation time) and very late (articulation of the third noun) time windows. Analyses of eye-movements allowed us to examine what message information participants were apprehending during different intervals of planning. We specifically measured the proportion of time speakers gazed at the first object and the third object. We suggest that speakers who gazed, for example, at the second cat in Figure 1 for a higher proportion of initiation time (the cat with three legs) were gathering detailed message information at the earliest moments of the planning process. Although such eye-movement behavior arguably aids the local goal of producing an adequate description of the first object, we maintain that it suggests a longer scope of planning in that it requires additional gathering and planning of downstream information that benefits global sentence quality. On the other hand, if speakers were more likely to look back to the first object while articulating a description of the third object, this would provide evidence of initial planning with a narrow scope. We predicted that high-span individuals would be more likely to look ahead to the third region of the display on contrast trials during initiation time, and less likely to look back to the first region while articulating a description of the third region. Both patterns of eye-movement would suggest a longer scope of planning.
A third key measure of advance planning was the frequency with which participants modified the first noun phrase. As we noted earlier, if speakers had successfully interfaced a larger message plan with a larger utterance plan, they would have provided information to the addressee that allowed rapid and unambiguous identification of the object to be moved. That is, they might say “the four-legged cat” at the outset of their utterance. We predicted that high-span speakers would be more likely to integrate contrast information early into an utterance plan by modifying the first noun description.
Taken together, these three measures allow us to provide a nuanced view of the relationship between working memory capacity and high-level advance speech planning. We have suggested that both the simple capacity and efficient capacity accounts support our predictions for the impact of working memory capacity on eye-movements and noun modifications. The measure of initiation time will distinguish whether speakers with higher working memory capacity are able to use that capacity more efficiently.
2. Method
The experiment had two phases. In Phase I, participants completed a task that assessed their working memory. In Phase II, a subset of participants from Phase I returned and acted as Directors in a game that allowed us to determine how far ahead speakers plan their utterances. In the game, a Director produced verbal commands based on visual displays shown on a computer (see Figure 1). The visual displays contained three objects aligned horizontally across the screen. Participants produced utterances that mentioned the three objects and the direction of movement (as indicated by the arrows). For example, in response to Figure 1, a participant might say: “The four-legged cat moves below the train and the three-legged cat moves above the train.” The speakers understood that the purpose of their utterances was to allow Matchers to manipulate items on a grid displayed on the Matchers’ own computer.
2.1. participants
Participants were Stony Brook University undergraduates who received course credit or $8 for their participation. We tested a total of 116 participants. We prescreened 92 participants in Phase I of the experiment. Twenty-six of those participants returned to participate as Directors in Phase II. We recruited another twenty-six participants to act as Matchers in Phase II.
2.2. phase i
2.2.1. Materials and procedure
We used a reading span task to measure verbal working memory in groups of one to twelve participants. The task consisted of 36 total items, which we divided into 8 sets of trials. Each set of trials consisted of 3, 4, 5, or 6 individual items, and participants saw each set size twice. All participants viewed the items in the same order to ensure as similar an experience as possible.
The 36 reading span items were taken from Swets et al. (Reference Swets, Desmet, Hambrick and Ferreira2007), in which the authors modeled their items on those found in Daneman and Carpenter (Reference Daneman and Carpenter1980) and then modified the items based on Turner and Engle (Reference Turner and Engle1989). Each item consisted of a sentence and a single to-be-remembered word presented in red underneath the sentence. Half of the sentences made sense (e.g., The woman planted flowers on her patio), while the other half lacked semantic plausibility (e.g., After dinner the couple had a glass of tree). A question mark appeared after each sentence to indicate to participants that they were required to answer whether the sentence made sense.
Experimental sessions began with participants reading instructions explaining the reading span task. We gave each participant an answer packet to mark their responses. Participants used two pages of the answer packet for each trial. The first page of the answer packet had six lines where participants circled either YES or NO to indicate whether each sentence made sense (participants only filled out all six items on trials with a set-size of six). The second page of the answer packet contained six blank lines where participants could write down the to-be-remembered words. We displayed each item for 5 seconds on a large screen where all participants could easily see the sentence and the to-be-remembered word. During this time, participants indicated if each sentence made sense using their answer packet. After all items in a given trial had been displayed, a recall prompt (???) appeared. The duration of the prompt varied depending on how many items were in the trial it followed: We gave participants 4 seconds per item in the trial (so, the recall prompt lasted 24 seconds for trials with six items, 20 seconds for trials with five items, and so on). During this time, participants wrote down the to-be-remembered words.
2.2.2. Analysis
The working memory task was scored as follows. An item was considered correct only if: (a) a participant correctly responded to the processing component (i.e., knowing whether a sentence made sense), and (b) a participant correctly indicated the word-to-be-remembered (and this had to be done in the correct serial order). We considered the total number of correct items (range: 0 to 36) in the reading span task to be a measure of verbal working memory.
2.3. phase ii
For Phase II, we recruited Directors with a wide range of working memory scores. We asked twenty-six participants from Phase I to return as Directors for Phase II, based on their performance on the reading span task. Our primary goal was to include samples of participants from the full spectrum of reading span scores, even though we intended to leave these scores as a continuous predictor variable in statistical analyses. To do this, we recruited heavily from the extreme ends of the reading span distribution, and recruited less heavily from participants who scored in the middle range. The final characteristics of the sample can be found in Table 1 in the ‘Results and discussion’ section. We also recruited twenty-six new participants to act as Matchers for the returning Directors. Note that we did not collect working memory measures from either Directors or Matchers in Phase II. The Phase II session occurred during the same semester as Phase I.
Reading span data. Phase I figures are calculated based on the reading span scores of all ninety-two participants tested in Phase I. Phase II figures are calculated based on only the Phase I reading span scores of participants who acted as Directors in Phase II. Means are on a scale of 36

Each Director and Matcher engaged in a matching game consisting of 8 rounds. Each of the 8 rounds included 2 experimental utterances and 6 filler utterances that enabled Matchers to move objects around in an image grid.
2.3.1. Materials: Directors
The stimuli in this experiment were meant to elicit utterances in the form of, The N1 moved above the N2 and the N3 moved below the N2, with N1, N2, and N3 being three different noun phrases used to describe images of objects on a computer monitor. In this experiment we used all real-world objects. We chose a total of forty-eight objects from a database of color images courtesy of Michael J. Tarr, Center for the Neural Basis of Cognition and Department of Psychology, Carnegie Mellon University (http://www.tarrlab.org), and selected objects that had elicited labels that were one syllable long with high naming accuracy (M = 94.7%) and low reaction times (M = 771 ms) as reported in the norming database available in Rossion and Pourtois (Reference Rossion and Pourtois2004).
We created sixteen experimental arrays, each with three objects that aligned horizontally across the screen. We used each of the arrays to create two types of experimental display: control displays had three unique objects, while contrast displays had similar objects in the first and third positions. Each participant saw eight control displays and eight contrast displays. We created two lists to counterbalance the control and contrast displays between participants. We split the sixteen experimental displays from each list into eight pairs that each had one contrast display and one control display.
To create contrast sets, we paired an original object from the Roisson and Pourtois (Reference Rossion and Pourtois2004) database with a graphically altered version of that object. We used Adobe Photoshop to make these changes to the original objects. In all cases, we placed the original object in the first position, and the altered version in the third position. Figure 1 shows an example of a contrast display. We set two main criteria in selecting objects for these contrasts. First, we wanted the difference between an object and its contrast to be easily discernable for Directors. In the example shown in Figure 1, although the two cats are exactly alike in most ways, it is easy to see that one cat does not have its full complement of limbs. The objects in a contrast set also had to allow for two different kinds of modification of the noun phrase, giving Directors the option to describe each object in the contrast set either prenonimally (e.g., “the four-/three-legged cat”) or postnominally (e.g., “the cat with four/three legs”).Footnote 1 Pilot testing revealed that some of the contrast sets we created were not easily distinguishable by Directors. Other contrast sets did not elicit both types of modification, or elicited unbalanced proportions of one modification type or the other. We amended contrast sets that did not meet our criteria before beginning Phase II of our data collection. Figure 1 also exemplifies the arrows that appeared in each display as cues for Director’s motion descriptions. Half the displays had the first image moving above the center image and the third below, as suggested by the directions of the arrows. The other half had the opposite pattern. We also created ninety-six fillers (48 for each list) to make the Directors’ speech planning more diverse and to make the game less predictable for the Matchers. Approximately half of the filler displays included the directional commands next to (rather than above or below). In addition, sixty-four of the fillers required utterances that were only one clause long (e.g., “the corn moves below the cat”).
The content of the fillers and their placement provided extra moves for the matching game played by the Director and Matcher (see below for more details on Matcher stimuli). Filler items only contained an experimental object (i.e., an object that has a contrast, or the contrast object itself) if the experimental trial involving that object had already appeared. This ensured that the Director had not already modified their description of the object prior to the experimental trial involving that object.
We also created five practice displays using one-syllable real-world objects that were not present in the experimental displays. These practice trials included examples of all possible movements (above, below, and next to).
2.3.2. Materials: Matchers
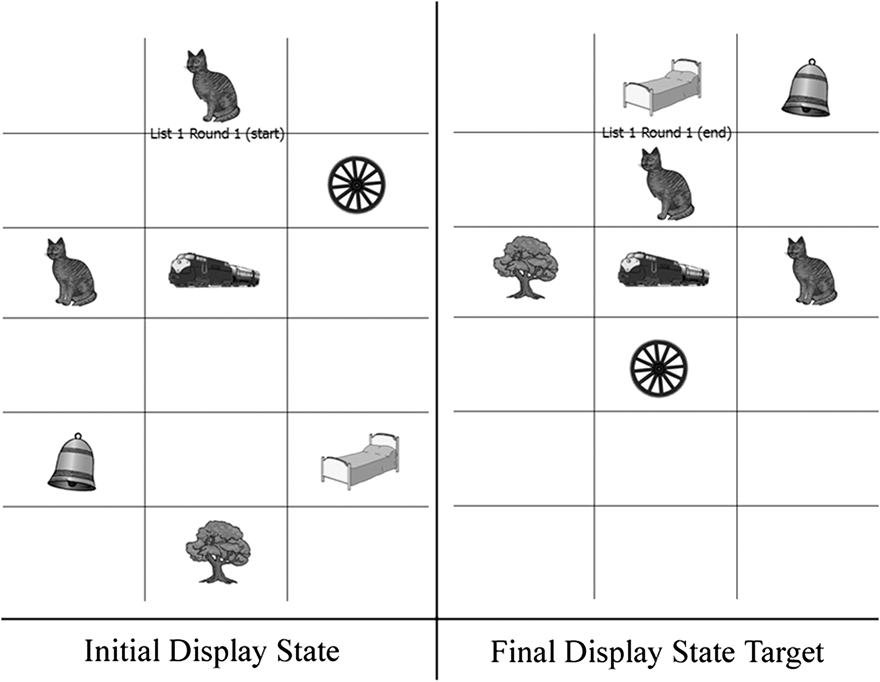
For both lists of experimental arrays and fillers, we created an image grid for each of the eight rounds of the game the Matcher played. Each was a three (horizontal) by two (vertical) grid created in PowerPoint (see Figure 2 for an example). We combined individual objects from two sets of experimental displays into each grid. Importantly, we only included the contrast object on the game grid if that same object appeared in one of the Director’s commands. We did this to ensure that the Matcher did not receive too little information to make a successful move on their game grid: that is, if the Director saw a control display, they would have no reason to modify their description of an object since there is no contrasting item, yet it might be necessary for the Matcher to complete the command. Each grid therefore contained six objects and one contrasting object. These image grids allowed for the movement of each individual image from one slot to another by clicking and dragging it to an empty slot using a mouse.
Examples of matcher displays. The left side shows the initial state of a display before the beginning of a given round. The right side shows target state of the display after all commands had been given for a round.
2.3.3. Apparatus
We collected eye-movement data using the EyeLink II eye-tracking system. The EyeLink II sampled eye position data every 2 ms. Directors used a Dell computer and a Dell monitor to view the visual displays. Experiment Builder software presented the displays on screen, recorded Directors’ speech, and also defined invisible interest areas on the displays that helped in data analysis. Matchers used a Dell laptop to manipulate their game grids, which were presented via PowerPoint.
2.3.4. Design and procedure
The experiment employed a mixed design in which display type (i.e., whether a display had a contrasting item in the third position) was manipulated within subjects. The working memory variable was left as continuous in data analyses, and is to be regarded as a correlational variable.
Participants returning from Phase I acted as Directors in this experiment. Directors sat in front of a computer monitor and an experimenter helped place the EyeLink II eye-tracker on their head. The experimenter then calibrated the eye-tracker: this involved asking the Directors to focus their eye gaze on fixation crosses that jumped around the screen. Directors also wore a headset microphone that recorded their speech. After reading written instructions and receiving clarification from the experimenter, Directors described five practice displays. These practice displays oriented the Director to produce the desired utterances in response to displays. The experimenter also showed Directors what the Matchers’ game grid looked like.
Each trial began with a fixation cross located on the left side of the screen. We required the Directors to be looking at this cross when pressing the space bar to begin the trial. If the Directors were not looking at the cross, the computer would beep, and they would have to try again. After successfully pressing the space bar, a three-object array appeared that filled most of the screen, centered both vertically and horizontally. The experimenter asked Directors to produce utterances in the expected sentence frame. Large subversions of the frame were discouraged. The experimenter also told the Directors to give the Matchers time to move the objects on their image grid before moving to the next trial.
The Matchers sat at a laptop across the table from the Directors. Matchers could not see Directors’ faces from this vantage point. The experimenter showed Matchers how to move objects around the PowerPoint game grids based on the utterances of the Directors. The experimenter also told Matchers that the Directors would tell them when to move on to the next image grid. Finally, the experimenter encouraged Matchers to feel free to ask questions of Directors if any of the movement instructions seemed unclear.
3. Results and discussion
3.1. phase i working memory scores
Working memory scores collected from all potential Directors in Phase I displayed a fair amount of variability. Table 1 shows descriptive statistics from this phase of data collection. In general, the Stony Brook University population showed a range similar to that observed in a previous study performed on a population sample at Michigan State University (Swets et al., Reference Swets, Desmet, Hambrick and Ferreira2007). Table 1 also displays Cronbach’s alpha reliability estimates (i.e., coefficient alphas, or α, in which all possible split-half reliabilities among items are computed and aggregated). Reliability among items on the reading span task was very high (αs > .80), indicating that the measure had excellent internal consistency.
3.2. phase ii working memory scores
Descriptive statistics of working memory scores for the twenty-six participants who returned for Phase II can be seen in Table 1. Although the means shifted slightly as the sample size was reduced from Phase I to Phase II, standard deviations, minimum/maximum figures, and coefficient alphas were similar.
3.3. picture description task analyses
We used three different measures to examine speech planning: temporal measures, eye-tracking measures, and qualitative measures of how speakers modified noun phrases. Before presenting results, we will briefly describe the manner in which we collected these measures.
3.3.1. Speech analysis: temporal measures
We chose three different utterance sections for analysis of temporal data (see Table 2). Initiation time provided information about how long speakers took to begin speaking, which is a measure of advance planning for the contrast between N1 and N3. We also measured the durations of the descriptions offered for the nouns at positions N1 and N3. The duration of the description of N1 in contrast conditions offers data regarding the extent to which speakers had planned ahead and noted the contrast between N1 and N3 prior to its description. However, because these durational description measures turned out to be redundant with a measure of modification likelihood, which is also a more informative measure, we will not report them. We will also report durational measures for the section between N2 articulation and N3 articulation, an utterance section during which speakers would be engaged in local planning for the N3 description (Griffin & Bock, 2000). Three coders were trained to use Praat software to find these durations. Each coder was responsible for coding data from different participants.
Method for division of target utterances into analysis sections

3.3.2. Eye-tracking data time-locked with speech
We used eye-tracking data to examine the scope of the Directors’ planning. For each experimental display, we divided the screen horizontally into three spatial regions. Each of the three regions contained one of the three objects on the display. Using the eye-tracking samples, we determined which spatial region of the display the Director was looking at for any given time (recall that the EyeLink II samples once every 2 ms). We entered each individually measured utterance section length (see Section 3.3.1 for how we measured this) into an Excel file that we programmed to time-lock Directors’ speech with the eye-tracking data. We then determined what percentage of each individually produced utterance section under analysis (each of which were different lengths) was spent looking in each display region. The utterance sections for which we report such analyses below are the Initiation Time, N1, and the and the utterance sections bracketed in Table 2. As an example, we calculated what percentage of the time Directors spent looking in each of the three spatial regions before uttering the first word of their sentence (i.e., during their initiation time). We suggest that spending relatively more time looking ahead on the display implies a greater tendency to plan further in advance.
3.3.3. Speech analysis: qualitative measures
Research assistants transcribed all of the Directors’ utterances in their entirety and coded whether and how participants modified the contrast item.
3.3.4. Statistical analysis
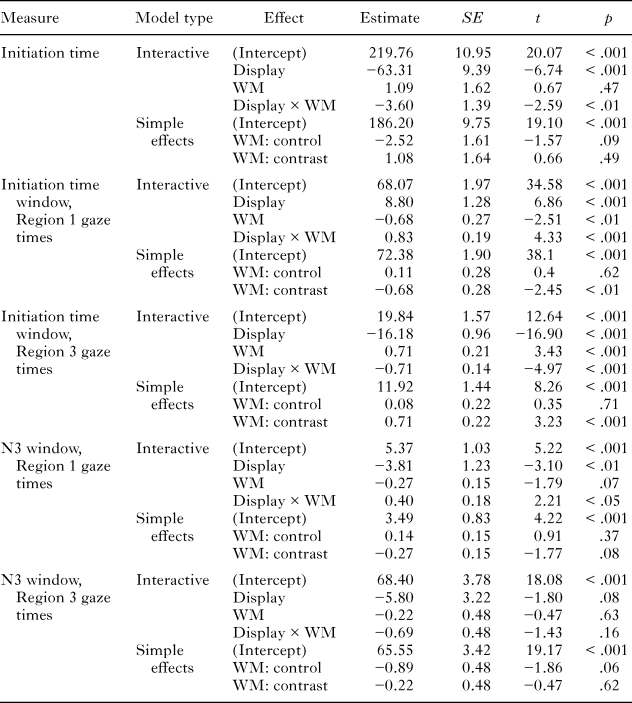
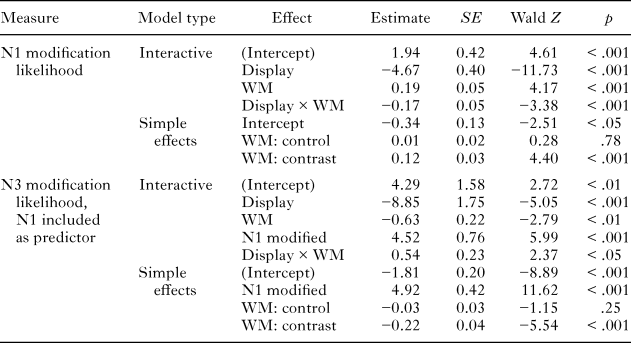
To analyze results from these measures we used mixed models from the lme4 package (Bates, Maechler, & Bolker, 2012) in R. For analyses of continuous measures such as initiation time we fitted the data using linear mixed effects models (Baayen, Davidson, & Bates, 2008). For analyses of dichotomous variables we fitted the data using mixed logit models (Jaeger, Reference Jaeger2008). With these approaches we simultaneously modeled participants and items as random factors, and centered the working memory variable keeping it as a continuous predictor. Results from linear mixed effects models can be found in Table 3, and results from mixed logit models can be found in Table 4. To help explain interactions between display type (contrast vs. control) and working memory, we tested the simple effect of working memory at each level of the categorical display type variable. We did so in both the linear mixed effects and mixed logit models, and those results are also presented in Tables 3 and 4, respectively.
Fixed effects for the linear mixed models predicting continuous dependent variables. WM = reading span score
Fixed effects for the mixed logit models predicting categorical measures
We will present results that parallel the order in which speakers proceeded through the planning and articulation of sentences. To illustrate the results, we present by-subject plots of our various dependent variables linearly regressed onto the working memory measure, separately for control and contrast displays. We begin by presenting results for speakers’ pre-articulation durations and gaze patterns.
3.4. pre-articulation data
There were two questions to address from the pre-articulation data. The first question was: To what extent did working memory influence the time speakers took to begin speaking in the different display conditions? The second question was: During that time, where within the displays were speakers looking to gather message information? According to a simple capacity account, high-span speakers should take longer to begin speaking. According to an efficient capacity account, initiation time to begin speaking should not differ between high-span and low-span speakers during contrast trials. Both accounts predict that high-span speakers would spend more of the initiation time window looking at the third item in the display than low-span speakers.
3.4.1. Initiation time
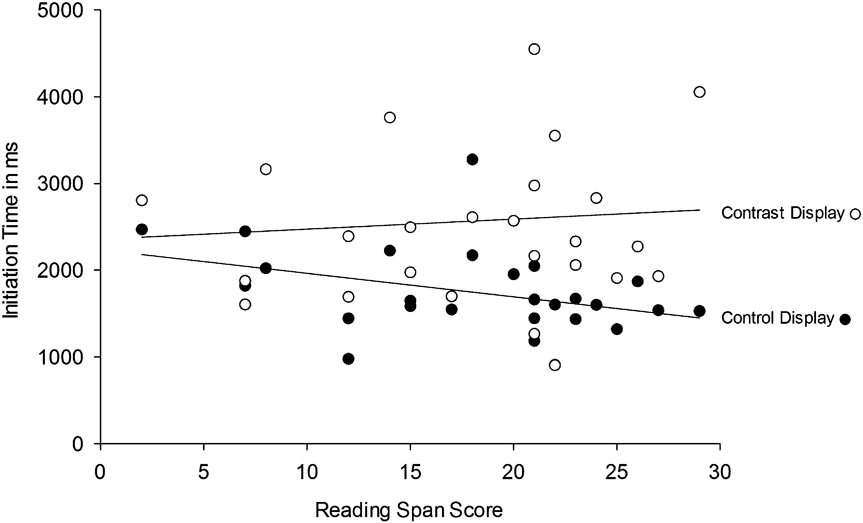
We defined initiation time as the time that elapsed from the onset of the display to articulation of the first word of the target utterance (The). Figure 3 shows that speakers took a longer time to begin articulation if the first object in the display required discrimination from the third object, leading to a main effect of display type. The figure also suggests that reading span scores were not good predictors of initiation times for contrast displays, but did somewhat predict initiation times for control displays.
Initiation time as a function of display type and working memory.
The mixed effects results (see Table 3) showed a significant main effect of display type, showed no main effect of reading span, and revealed a significant interaction between display type and reading span. The model testing the simple effect of reading span at each level of the display type variable showed that when displays contained contrasts, reading span did not predict initiation time, but when displays did not contain contrasts, reading span had a marginal negative association with initiation time. Although the effects are not strong, it appears that in the control condition, speakers with high reading span scores were faster to initiate articulation than speakers with low reading span scores.
The most important effect from initiation time analyses is that working memory did not predict initiation times for contrast displays. This finding is consistent with an efficient capacity account, but not a simple capacity account. We also note that the control trial data are also consistent with the efficient capacity account. In those control trials, when the task did not demand extensive advance planning, high-span speakers began speaking sooner than low-span speakers, although the effect was only marginal. A simple capacity account would predict that, in such circumstances, when planning distance is the same between speakers, initiation times should not differ among the groups. That the high-span speakers may have planned the same content in less time would support the claim that working memory indeed facilitates efficiency in the planning of that content. However, to demonstrate that high-span speakers planned more efficiently than low-span speakers, we need evidence that they had an extended planning scope despite taking the same amount of time to begin speaking as low-span speakers in contrast displays.
3.4.2. Fixation patterns
We measured the proportion of time speakers spent fixating different regions of the display screen prior to speech onset. Specifically, our analysis measures the proportion of time speakers spent gazing in regions of interest during the utterance window defined as initiation time. This time window offers the best chance to observe whether speakers gathered visual information from well downstream very early on, and whether working memory predicted that tendency. We will focus on two spatial regions of interest: Region 1, in which the first object to describe was located, and Region 3, which in contrast trials contained an object that was visually similar to the object in Region 1. Both simple capacity and efficient capacity accounts of working memory predict that high-span speakers will spend less time gazing at Region 1 and more time gazing at Region 3 prior to speech onset, reflecting an extended planning scope.
In Region 1, we found a significant interaction between display type and reading span (see Table 3) and a main effect of display type (control: M = 77.14, SD = 10.34; contrast: M = 68.11, SD = 9.63). Region 3 also showed a significant interaction between display type and reading span in addition to a main effect of display type (control: M = 3.86, SD = 7.86; contrast: M = 19.74, SD = 9.11).
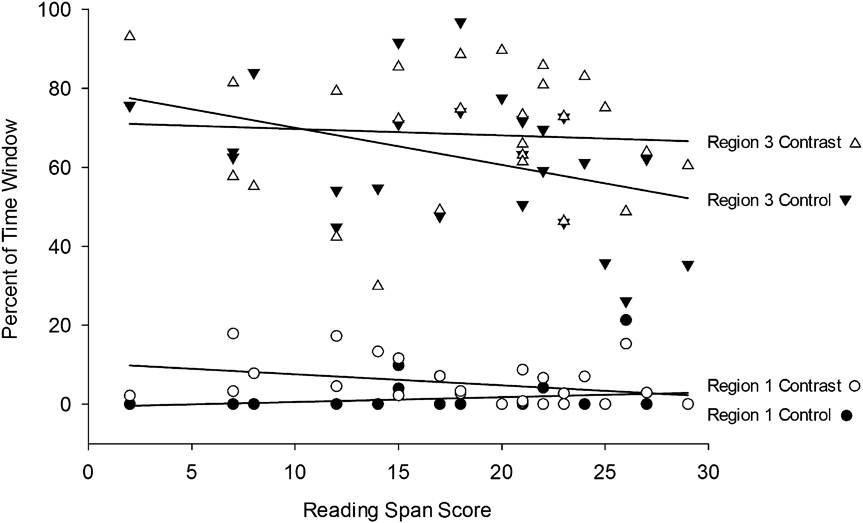
Figure 4 illustrates these effects and supports the prediction that high-span speakers were more likely to engage in long-distance look-ahead. Specifically, in contrast trials, high-span speakers spent a lower percent of the available time looking at Region 1 and a higher percent of the available time gazing at Region 3 than low-span speakers. However, in control trials, working memory did not account for significant variation in gaze patterns.
Percent of pre-speech time window spent gazing at Region 1 and Region 3 as a function of display type and verbal working memory.
Simple effects models supported this interpretation. When displays contained contrasts, there was a significant negative association between reading span and Region 1 fixation percent and a significant positive association between reading span and Region 3 fixation percent. Reading span did not predict fixation patterns during control trials for either measure.
These results suggest that speakers with high verbal working memory capacity were more apt to gather information about potential contrasts before articulation than speakers with low verbal working memory capacity. During contrast trials, high-span speakers spent more of the initiation time period looking at the contrasting item than did low-span speakers, implying more advance planning. Recall that high-span speakers did not take any longer to begin speaking than low-span speakers during those trials. The difference in results for control display descriptions across these two measures (initiation time and eye-movement patterns) is also rather striking. Whereas high-span speakers were marginally faster to begin speaking than low-span speakers, working memory played nearly no role in speakers’ looking patterns during this time window. In other words, speakers with high working memory seemed to gather the same amount of control display information as speakers with low working memory, but took less time to do so. Together, these results are consistent with an efficient capacity account. In the next analysis, we examine whether high-span speakers were able to integrate this additional information into their utterance plans.
3.5. n1 modification
We have already observed that speakers with high verbal working memory span are more likely to apprehend the contrast between the first and third objects prior to articulation. The next analyses help determine whether the extra information high-span speakers gained becomes integrated early on into an utterance plan. To test for this, we examine the likelihood that speakers modified N1. We consider higher N1 modifications as evidence of a longer scope of planning. Modifying N1 by describing a cat as a “four-legged cat” or a “cat with four legs” would indicate that a speaker has not only encoded that there is a similarity between N1 and N3, but also developed a plan to encode that difference linguistically quite early in sentence planning.
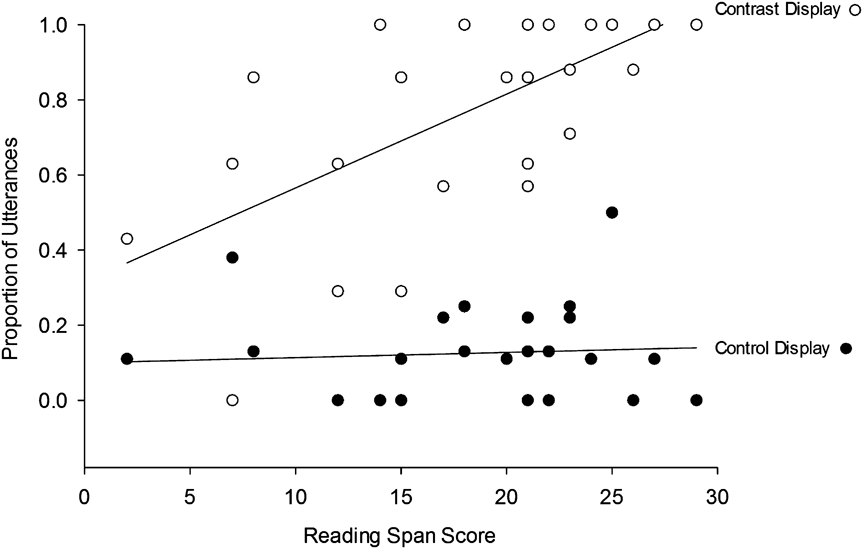
A mixed logit model (see Table 4) revealed significant main effects of display type and reading span and a significant interaction between reading span and display type. Figure 5 illustrates the interaction between reading span and display type. It shows that reading span is positively correlated with N1 modification rates for contrast trials, but does not explain variance in N1 modification rates for control trials.
Likelihood of N1 modification as a function of display type and reading span.
Analyses of simple effects support this interpretation. For control trials, there was no correlation between N1 modification and reading span. For contrast trials, there was a strong positive association between N1 modification and reading span.
The direction of the relationship between reading span and modification likelihood was such that speakers with more verbal working memory capacity were more likely to modify N1 to reflect a contrast between N1 and N3. It appears that greater working memory capacity allowed speakers to not only gather more information about contrasting objects, but to encode such differences early on into their utterance plans.
3.6. and the articulation
The articulation of and the is potentially of interest because it is the utterance section that occurs just prior to articulation of N3, the second object of the contrast. Hence, it may reveal effects of working memory and/or display type on local planning for that piece of the utterance.
3.6.1. Duration
Regarding the duration of uttering this particular utterance section, a linear mixed effects model showed a significant interaction between display type and reading span (t = 2.51, pMCMC < .05), and no main effects. However, because reading span was not significantly associated with and the duration in either control or contrast conditions in tests of simple effects, we will be cautious in interpreting this effect.Footnote 2
3.6.2. Fixation patterns
Neither reading span nor its interaction with display type predicted Region 1 or Region 3 fixation time percentages (ts < 1.82, pMCMCs > .07). Display type had no influence on looking patterns to the upcoming third region of the display (t < 1), but did influence looking times to Region 1: speakers in contrast conditions looked back to Region 1 more often (t = −2.48, pMCMC < .05), but this was not significantly more likely to be done by high- or low-span individuals. Such reading span interaction effects began to emerge with significance during articulation of N3.
3.7. n3 articulation
We have so far noted that increased reading spans allowed speakers to gather and encode contrast information early on in utterance plans. These extra resources allowed high-span speakers to give longer, more helpful N1 descriptions than low-span speakers. Analysis at the N3 region of modification likelihood and eye-movement patterns now allow us to examine the possible impact of this early planning on late-sentence planning processes. We present the description data prior to eye-movement data to continue the presentation of these results in the order which they occurred.
3.7.1. Modification likelihood
We tested two models predicting the likelihood of modifying N3. One model tested was of the same structure as all previous models reported, with the main effects and interaction of display type and reading span, with subjects and items as random intercepts. The other model had the same structure, but included the N1 modification data as a covariate, and did not include the items-specific random intercept. The inclusion of N1 modification likelihood allowed us to examine N3 modification patterns with variance due to N1 modification already accounted for.Footnote 3 This second model would not converge when N1 modification was included as an interactive effect with the other variables, nor did it converge if we included the random intercept associated with items, so both of these aspects of the model were left out. Because the likelihood ratio test revealed that the model including N1 modification as a covariate fit the data significantly better (X Footnote 2(0) = 22.51, p < .001), we will only discuss results from that model.
There is evidence that participants with higher working memory spans were less likely to modify N3, presumably because more of them had already noted the distinction while articulating N1. The results of the mixed logit model (see Table 4) support this interpretation. We found significant main effects of display type, reading span, and N1 modification, as well as an interaction between display type and reading span. Speakers were much more likely to modify N3 if it required discrimination from N1 (control: M = 0.07, SD = 0.09; contrast: M = 0.98, SD = 0.06). The association between N1 modification and N3 modification is related to this effect of display type: in contrast conditions, participants were likely to modify both N1 and N3, and in control conditions, they were unlikely to modify either N1 or N3.
The main effect of reading span is accounted for almost entirely by the effect of working memory during contrast trials, as seen in the tests of simple effects. Whereas working memory did not reliably predict N3 modification in control trials, there was a significant negative association between reading span and N3 modification likelihood in contrast trials.
This suggests that high-span speakers who had encoded contrasts early on in planning felt less pressure to further discriminate the contrast set later in the utterance, and that low-span speakers who had not planned as far in advance were more likely to include these modifications later.
3.7.2. Fixation patterns
Because working memory played a role in N3 modification likelihood, one might expect similar late-stage planning effects to emerge in the fixation patterns to Regions 1 and 3 during the articulation of N3. Indeed, we found that low-span speakers were more likely to need to recover from a lack of early planning than high-span speakers. In Region 1, linear mixed effects showed both a main effect of display type and a significant interaction between display type and reading span (see Table 3). There was a marginal effect of reading span.
Region 3 did not show significant effects of display type, reading span, or the interaction between those factors (see Table 3). Although there was a trend of an interaction between display type and reading span, that trend was not significant.
Figure 6 illustrates the results. The lower portion shows that reading span did not predict how long speakers inspected Region 1 during control trials. During contrast trials, however, it is apparent that speakers with lower reading span scores were more likely than high-span speakers to inspect Region 1. Here we note that unless the speaker had not yet fully encoded the difference between the objects in Regions 1 and 3, there was no reason to look back to Region 1. Fixation patterns of Region 3 showed a very different pattern. Whereas reading span did not predict time spent looking in Region 3 during contrast trials, it did seem to predict time spent looking at Region 3 during control trials.
Percent of N3 description time window spent gazing at Regions 1 and 3 as a function of display type and reading span.
Analyses of simple effects supported these interpretations. In Region 1, we found a significant negative association between reading span and percent of gaze time during contrast trials, but no relationship during control trials. In Region 3, we found a marginal negative association between reading span and percent of gaze time during control trials, but no relationship during contrast trials.
In looking at the results from this N3 section, including description lengths, modification likelihood, and gaze patterns, it is apparent that low-span speakers describing contrast displays used this time window to catch up to high-span speakers. Low-span speakers showed a greater tendency to go back and inspect contrast information in Region 1 compared to high-span speakers, implying that they had not yet fully encoded the contrast. Low-span speakers were also more likely to modify N3, after having produced fewer N1 modifications than high-span speakers earlier in articulation. These data further support the notion that speakers rely on working memory capacity for advance sentence planning. Speakers with high verbal working memory capacity do more planning up front than speakers with lower working memory capacity.
3.8. matcher performance
We calculated Matchers’ accuracy by comparing each of their completed PowerPoint display boards with the correct target display. Any item that was not in its correct place on the grid by the end of a round was considered an error. Each Matcher completed eight rounds, each of which had eight commands (including filler commands) given to them by the Director. Because we could only assess the accuracy of boards after a given round was completed, it was not possible to code the extent to which Directors successfully conveyed individual descriptions. Rather, we can only evaluate the overall performance of Matchers after an entire round was completed, given Directors’ individual differences in reading span. For that reason, it is not entirely surprising that reading span did not correlate significantly with Matcher performance (r = 0.18, p = .20).
4. Discussion
Our study demonstrated that individual differences in reading span are highly predictive of individual differences in the scope with which speakers plan sentences in advance. When speakers described pictures containing two similar objects, speakers with greater working memory capacity gathered more message information prior to speech onset. These high-span speakers also tended to integrate information about the contrast into their utterance plans earlier than low-span speakers. They gave longer descriptions of the first-described object, as demonstrated by their greater likelihood of modifying that description to note the contrast with N3. Once speakers reached the articulation of N3, there was a subtle cost to low-span speakers for not planning with the same advance scope as high-span speakers. Low-span speakers were more likely to gaze during that time window at Region 1, presumably to gather the contrast information and verbally encode the difference on the fly. Stated another way, it seems that speakers with high verbal working memory capacity were able to pay earlier for their planning, saving them effort later.
In performing the task of planning speech, the language production system must both create and store utterance plans. We proposed two separable explanations of a relationship between working memory and speech planning. The simple capacity account appeals to the manner in which storage capacity might limit the sizes of speech plans that can be maintained long enough for articulation. An efficient capacity account invokes the same capacity limitation, but also includes temporal efficiency as a function performed by working memory during speech planning. Our data provided evidence for the efficient capacity account. If working memory predicts planning scope due to storage restrictions alone, high-span speakers should plan sentences in larger chunks, but also take a longer amount of time to do so. But this pattern did not hold. In the contrast display trials, high-span speakers planned more in advance, but did not take any more time to do so than low-span speakers. On the other hand, during control trials, when the descriptions offered by high-span and low-span speakers did not differ, high-span speakers were faster to begin articulation. Hence, in accord with an efficient capacity account, it appears that working memory capacity allows larger utterance plans to be buffered for articulation, but it also makes the creation of those larger plans possible within restricted time windows. It seems that speakers with greater working memory capacity are able to take in additional visual information that is relevant to their utterance planning, and create longer pre-articulated sequences using that information.
There are a number of implications and further questions raised by this demonstration of planning efficiency by high-span speakers. For one, it calls into question, to some extent, the use of temporal measures of planning time as indicators of scope of planning. Although on the whole, as demonstrated by Wagner and colleagues (2010), time taken to plan predicts the scope of planning, the present study demonstrates that such measures are not predictive in every circumstance. Here, high-span speakers planned more without taking more time to do so. A further question raised by these results is why low-span speakers neglected to take additional time to plan their utterances in contrast conditions. As the Wagner et al. results indicate, it seems that additional time could have helped them prepare additional information. We offer two explanations. The first is the difference in task environments between the Wagner et al. experiments and the present study: speakers in the present study interacted with addressees. Based on prior research (Swets et al., Reference Swets, Jacovina and Gerrig2013), speakers with addressees accommodate to the simultaneous pressures of providing adequate detail to addressees and the implicit time pressure to speak quickly that is inherent to speech directed toward addressees (Jefferson, Reference Jefferson, Roger and Bull1989). The end result may be a normalization process whereby speakers in the present study tended to take roughly the same amount of time to begin speaking, regardless of working memory, and regardless of how much they had yet planned. Then, when low-span and high-span speakers started articulating around the same time, the high-span speakers were able to plan more within that window prior to articulation. The other explanation for why low-span speakers would not take additional time is that they do not have the capacity to store any additionally generated content. As a result, it is more difficult to keep those larger plans in storage prior to articulation, regardless of how much planning time is available.
One possibility that warrants careful consideration is that individual differences in processing speed might account for the observed link between working memory and advance sentence planning. Prior research (summarized in Salthouse, Reference Salthouse1994) has documented that age-related declines in working memory can be largely attributed to declines in processing speed. Extending this research to the present study, perhaps processing speed underlies both individual differences in working memory and the individual differences in advance planning scope. Heitz and Engle (Reference Heitz and Engle2007) ruled out a speed of processing explanation of the results of their study of visual attentional capacity by pointing out that high-span individuals were generally no faster than low-span individuals at gathering and using visual information − just more efficient in the time windows offered. Had high-span speakers in the present study only generated longer speech plans in equivalent time windows, as they did during contrast trials, we might offer a similar explanation. But because high-span speakers initiated speech marginally faster than low-span speakers in control trials, a speed of processing explanation is still viable. Hence, future research ought to include measures of processing speed separable from working memory capacity to sort out how these various facets of cognitive performance help facilitate the speed, fluency, and scope of planning in language production. Similarly, without any additional measures of working memory that may have demonstrated some divergent validity, we cannot rule out other explanations of the relationship such as effort (but see Heitz, Schrock, Payne, & Engle, 2008, for data arguing against effort-based explanations of individual differences in working memory).
Our study shows that individual differences in working memory predict individual differences in the scope of advance planning in language production. Recently, work has emerged that is consistent with our findings (Petrone, Fuchs, & Krivokapić, 2011). In that project, working memory span predicted the sensitivity speakers showed to a manipulation of sentence-initial subject length: high-span speakers were more likely to begin articulation of complex subject phrases at a higher F0 pitch than low-span speakers, although preparation time was equivalent. Our findings are consistent with arguments that planning scope is variable rather than fixed (Allum & Wheeldon, 2007; Ferreira & Swets, 2002, Reference Ferreira, Swets and Cutler2005; Fuchs et al., Reference Fuchs, Petrone, Krivokapic and Hoole2013; Wagner et al., Reference Wagner, Jescheniak and Schriefers2010). Our results further suggest that working memory is one of the sources of such variation. Although one can arrive at this conclusion in a fairly straightforward way from our data, it is important to discuss how the methodology that was used might place certain boundary conditions on interpretation of the emergent results. Both the working memory component and the sentence planning component of the methods deserve consideration here.
The most obvious of the boundaries on interpretation is the fact that the crucial working memory variable employed is correlational rather than experimentally manipulated. For this reason, we do not claim to have established a causal connection from verbal working memory capacity to the scope of utterance planning. Working in favor of such a causal connection, however, is the finding from Wagner and colleagues (2010) that manipulation of extrinsic load causes variability in the scope of planning. Suppose that the load induced by Wagner and colleagues’ Experiment 2 served to reduce among high-span speakers their verbal working memory capacity, which led to a shorter scope of utterance planning. If so, then we have presented some evidence from an individual differences approach that is consistent with the idea that working memory capacity is a cause of variation in the scope of planning.
Another question left unresolved is the nature of the working memory capacity that coincides with variation in advance planning tendencies. Although we used reading span as a measure that was designed to tap into verbal working memory capacity, prior research has shown that this measure correlates strongly with non-verbal measures of working memory (Kane et al., Reference Kane, Hambrick, Tuholski, Wilhelm, Payne and Engle2004; Swets et al., Reference Swets, Desmet, Hambrick and Ferreira2007). These inter-correlations have suggested to some that there is a more general working memory store that underlies abilities in both verbal and non-verbal domains (Kane et al., Reference Kane, Hambrick, Tuholski, Wilhelm, Payne and Engle2004). Because our study did not address this issue, we cannot distinguish whether it is verbal working memory or a more general working memory capacity that might share most of the variance with our measures of advance planning.
It is likely that future research will be able to test this question, but such research will be a practical challenge. The kinds of measures that are required to gauge advance planning, such as temporal measures and transcriptions and linguistic coding, are notably tedious and time consuming, and limit the number of participants whose data one can expect to extract. On the other hand, the kinds of statistical analyses, such as structural equation modeling, needed to tease apart the different kinds of working memory constructs, are generally very greedy about numbers of participants. In such research, one would prefer participants to number in the hundreds.
Another consideration to address is the view that human memory architecture has no separate store of working memory, but rather a limiting attentional component that interfaces directly with long-term memory (see, e.g., Cowan, Reference Cowan2001; Lewis, Vasishth, & van Dyke, 2006; McElree, Reference McElree and Ross2006). Such approaches are certainly compelling, and it may be possible to address in future studies whether it is the limiting capacity of such an attentional mechanism or the presence of interference during the creation and storage of larger utterance chunks that might explain these findings.
Finally, we must take up the issue of the kind of planning that is at stake. Our research focused on the extent to which individual differences predict variation in the scope with which speakers map message information onto utterance plans. Previous researchers have generally conceded that this level of planning is more likely than any other to be subject to working memory constraints (Brown-Schmidt & Tanenhaus, 2006; Levelt, Reference Levelt1989). Nonetheless, our findings are novel because they represent the first time such notions have been confirmed through results from individual differences techniques. They also open avenues for future research. One of the issues we would like to explore is the extent to which individual differences in working memory might predict variation in the scope of planning processes at lower levels such as pure grammatical and phonological encoding (see Petrone et al., Reference Petrone, Fuchs and Krivokapić2011, for some evidence that suggests a possible relationship between working memory and phonological encoding scope). Findings that demonstrate such a relationship would surely help resolve questions about the extent to which working memory predicts variability in the scope of planning at each possible level of representation.
4.1. conclusions
We conclude that working memory facilitates a larger scope of speech planning. Speakers with high verbal working memory capacity are able to not only gather more information about a message before speaking, but also integrate that message early on in utterance plans. On the other hand, speakers with low verbal working memory capacity are not as productive in using the time available to gather advance planning information. Working memory capacity seems to allow speakers to create larger utterance plans to store over time, and do so with temporal efficiency.