


Introduction
Endolymphatic hydrops (EH) is characterised by pathological distension of the membranous labyrinth due to excessive endolymph, the potassium-rich fluid contained within it. Affected patients experience recurrent episodes of vertigo, fluctuating sensorineural hearing loss, tinnitus and a sensation of aural fullness.Reference Gürkov1, Reference Venkatasamy and Péporté2 High-resolution 3T MRI with delayed post-gadolinium sequences now permits in vivo visualisation and grading of EH, assessing vestibular/cochlear ratios, herniation and perilymphatic enhancement patterns pertinent to Ménière’s disease (MD).Reference Liu, Pyykkö, Naganawa, Marques, Gürkov and Yang3–Reference Péporté, Gallix and Venkatasamy6 Traditionally dependent on clinical and audiometric criteria, EH diagnosis has evolved over the past decade by incorporating MRI findings into the latest Japan Society for Equilibrium Research Guidelines on Ménière’s disease.Reference Iwasaki, Shojaku, Murofushi, Seo, Kitahara and Origasa7
Normal pressure hydrocephalus (NPH) is a clinical syndrome of gait apraxia, cognitive impairment, and urinary incontinence (Adams–Hakim triad) due to communicating hydrocephalus with normal cerebrospinal fluid (CSF) pressure.Reference Hakim and Adams8 The mechanisms underlying NPH remain incompletely understood, with reported factors including diminished CSF outflow, reduced pulse pressure gradients across the cerebral aqueduct, decreased CSF production and turnover, compromised regional cerebral blood flow, glymphatic system dysfunction and accumulation of toxic metabolites.Reference Bradley9–Reference Silverberg, Mayo, Saul, Rubenstein and McGuire12 Diagnosis encompasses MRI biomarkers including callosal angle <90°, Evans index >0.3 (frontal horn width divided by biparietal brain diameter, indicating ventriculomegaly), white matter hyperintensities, sulcal crowding at the vertex and Sylvian fissure enlargement.Reference Pyrgelis, Velonakis, Papageorgiou, Stefanis, Kapaki and Constantinides13
While EH serves as the definitive histopathological hallmark of MD, emerging evidence has documented its occurrence in diverse neurological conditions, including intra-cranial pressure (ICP) disorders such as idiopathic intra-cranial hypertension (IIH) and spontaneous intra-cranial hypotension. Low cisternal CSF pressure induces perilymphatic hypotension and relative EH,Reference Gordon14–Reference Portier, de Minteguiaga, Racy, Huy and Herman20 while cisternal CSF hypertension similarly triggers secondary EH.Reference Péporté, Kostova, Berberat, Andreisek, Schön and Wagner21–Reference Tawfik, Stevens, Mihal, Costello, Cornelius and Samy25 NPH-related ICP changes may propagate to perilymph/endolymph via cochlear aqueduct and endolymphatic sac communication, causing saccular dysfunction or secondary EH.Reference Inui, Haginomori, Kajimoto, Kuriyama, Shirai and Kinoshita26–Reference Shulman and Strashun28 Normal pressure hydrocephalus may theoretically influence inner ear fluid dynamics via CSF–perilymph communication through the cochlear aqueduct and endolymphatic sac,Reference Swartz, Mukherji, Swartz and Loevner29–Reference Hughson32 where pressure transfer between CSF and intra-labyrinthine fluids has been demonstrated in both animal and anatomical studies. Notably, NPH-associated hearing loss and vertigo frequently improve post-shunting alongside core symptoms, supporting hydrodynamic links between CSF pressure and inner ear function.Reference Dixon and Jones33–Reference Varakliotis, Maspes, Rubbo, Cisternino, Lauriello and Vitti35
Investigating EH–NPH associations is clinically relevant, as NPH affects 1–5 per cent of older adult populationsReference Hiraoka, Meguro and Mori36 with overlapping otologic symptoms,Reference Varakliotis, Maspes, Rubbo, Cisternino, Lauriello and Vitti35 potentially identifying reversible inner ear pathology through CSF diversion while clarifying shared glymphatic/fluid dynamic pathways.Reference Naganawa and Taoka37 No prior studies have analysed the prevalence of NPH surrogate MRI markers among patients with EH. Given that lumbar puncture is not standard in EH evaluation, radiographic NPH signs served as surrogate markers in this study. This approach allowed the evaluation of NPH-related changes by assessing established MRI biomarkers without subjecting patients to invasive procedures.
Materials and Methods
Patient population
The study received Ethics Committee approval from Eastern Switzerland (Req-2024-01599 EKOS 24/236), with informed consent waived. A retrospective review of our institutional digital database was carried out for delayed contrast-enhanced MRI scans of the inner ear for hydrops imaging between 01/2020 and 06/2025.
Patients with local and systemic diseases directly involving the temporal bone were excluded. Further exclusion criteria were severe motion artefacts and incomplete MR imaging. Inclusion criteria were age > 18 years and available high-resolution 3T MRI scans encompassing the internal auditory canal (IAC) and including delayed post-gadolinium MRI sequences. The initial retrospective review of our institutional digital database for MRI of the inner ear revealed 132 potential participants with 144 MRI scans of the neck.
MRI scans were excluded for the following reasons: poor imaging quality due to severe image distortion (n = 7), severe motion artefacts (n = 11), incomplete imaging (n = 2) and local/systemic diseases directly involving the temporal bone (n = 4). From an initial retrospective review of 132 potential participants yielding 144 MRI scans, a cohort of 108 patients with MRI-confirmed EH previously described by Péporté et al.Reference Péporté, Kostova, Berberat, Andreisek, Schön and Wagner21, Reference Péporté, Kostova, Andreisek, Schön and Wagner22 met the inclusion criteria: age >18 years with high-resolution 3T MRI including delayed post-contrast sequences for inner ear assessment. The present study drew on the same MRI-confirmed EH cohort as the previous IIH analysisReference Péporté, Kostova, Berberat, Andreisek, Schön and Wagner21 and the previous morphometric study on cochlear and vestibular nerve volumesReference Péporté, Kostova, Andreisek, Schön and Wagner22; the present work represents a separate analysis of NPH surrogate MRI markers within this established imaging dataset.
Magnetic resonance acquisition
All participants underwent 3 Tesla MRI scanning (Siemens Magnetom Vida 3 Tesla, Philips Achieva 3 Tesla) using standardised protocols optimised to visualise inner ear structures, the vestibulocochlear nerve complex and the endolymphatic and perilymphatic spaces. Acquisitions included 3D high-resolution T2-weighted sequences and delayed post-gadolinium sequences (3D FLAIR and 3D T2w inversion recovery sequence 4 hours post-contrast) (Table 1).
MRI scanning parameters. Example of detailed scanning parameters of the specific sequences of our inner ear endolymphatic hydrops MRI protocol (3 Tesla MRI Scanner (Philipps Magnetom Achieva))

Table 1 Long description
The table presents three MRI sequences used in the inner-ear endolymphatic hydrops protocol on a 3-Tesla Philips Magnetom Achieva scanner. Each row corresponds to one sequence and includes the sequence name, imaging plane, field of view, echo time, repetition time, flip angle, and slice thickness. The T2 sequence is acquired as a three-dimensional transverse scan with a field of view of 150 by 150 millimetres, the shortest echo time, repetition time of 1500 milliseconds, flip angle of 90 degrees, and slice thickness of 0.8 millimetres. The FLAIR sequence performed four hours after contrast administration is a three-dimensional transverse acquisition with a field of view of 250 by 250 millimetres, echo time of 340 milliseconds, repetition time of 4800 milliseconds, flip angle of 40 degrees, and slice thickness of 1.0 millimetre. The T2 inversion recovery sequence four hours post-contrast is also three-dimensional transverse, with a field of view of 75 by 150 millimetres, echo time of 177 milliseconds, repetition time of 6000 milliseconds, flip angle of 180 degrees, and slice thickness of 0.8 millimetres. A footnote defines abbreviations for transverse and coronal planes and the units millimetres and milliseconds.
mm = millimetres; ms = milliseconds; tra = transverse.
Magnetic resonance imaging assessment and volumetry
Magnetic resonance imaging visual rating scale-based normal pressure hydrocephalus biomarkers
Brain MR images from EH patients were systematically assessed for NPH surrogate MR biomarkers by two raters – AP (a board-certified neuroradiologist holding the European Diploma in Head and Neck Radiology, with more than six years’ experience in head and neck imaging and more than eight years’ experience in diagnostic neuroradiology) and FS (a general radiologist with more than 10 years’ experience in general radiology) – using established visual rating scales and measurements as per NPH consensus guidelines.Reference Pyrgelis, Velonakis, Papageorgiou, Stefanis, Kapaki and Constantinides13, Reference Constantinescu, Ziegelitz, Wikkelsø, Kern, Jaraj and Rydén38 Disagreements between both readers were resolved by a third senior reader (FW, board-certified neuroradiologist and European Diploma in Head and Neck Radiology holder with more than 20 years’ experience in neuroradiology, head and neck and inner ear imaging). The callosal angle was measured on midline sagittal T2/FLAIR images at the posterior corpus callosum midpoint, with values <90° indicating ventriculomegaly disproportionate to sulcal atrophy. Evans index quantified ventricular enlargement as the maximal frontal horn width divided by maximal biparietal diameter (>0.3 threshold applied) with values above 0.3 commonly used as a simple marker of ventriculomegaly in NPH. Crowding of sulci at the vertex was defined as effacement of the sulci and subarachnoid spaces at the vertex and medial/parafalcine region and disproportionate gyral crowding on the convexity (axial and coronal views),Reference Shinoda, Hirai, Hori, Mikami, Bando and Shimono39–Reference Mori, Ishikawa, Kato, Kazui and MiyakeH41 while enlargement of the Sylvian fissure was graded as disproportionate widening relative to age-expected sulcal patterns (axial images).Reference Shinoda, Hirai, Hori, Mikami, Bando and Shimono39, Reference Kockum, Lilja-Lund, Larsson, Rosell, Söderström and Virhammar40 An example of NPH MRI biomarker assessment is given in Figure 1.
Example of visual rating scale-based normal pressure hydrocephalus (NPH) magnetic resonance (MR) markers assessment. Coronal (A, E) and axial (B–D) 3D T1w MR images. There is a reduced callosal angle with less than 90° measured at the level of the posterior commissure, elevated Evans index with 0.38, disproportionate widening of the Sylvian fissures and crowding of the gyri at the vertex in a patient with NPH.

Figure 1 Long description
This figure presents coronal and axial brain MR images illustrating key markers of idiopathic normal pressure hydrocephalus in a single patient. The coronal image in panel a highlights a reduced callosal angle, measured with two intersecting white lines and annotated as less than 90 degrees. Panel b shows an axial slice where a dashed horizontal line passes through the , drawing attention to posterior commissure, drawing attention to the point of measurement of the callosal angle.. Panel c displays an axial image with two white bars indicating frontal horn width and inner skull diameter, accompanied by the Evans index ratio. Panel d demonstrates bilateral Sylvian fissure enlargement marked by bold arrows. Panel e provides a coronal view of ventriculomegaly with compressed cortical sulci at the vertex, summarising the typical imaging pattern of normal pressure hydrocephalus.
Cranial nerve volumetric measurement
Cochlear and vestibular nerve volumes were quantified by AP (blinded to clinical data) using semi-automated segmentation (Syngo.via, Siemens Healthineers, VB80D). Bilateral cochlear nerve and vestibular nerve complex volumes were obtained by axis-corrected measurement from the cerebellopontine angle to the IAC fundus. Volume of interest regions were inserted throughout the course of the cranial nerves. The cumulative area of each MRI slice was then calculated by the software to obtain the entire nerve volume. The partial blurring seen at the margins of the reconstructed nerves (penumbra effect) was managed by delineating contours at the midpoint between the central low-signal area and the surrounding high-signal region.
The volume of the common vestibular nerve was measured, rather than measuring the superior and inferior vestibular nerve volumes separately. These two branches are often not completely anatomically separated throughout their course through the IAC. Anatomical studies have shown that the vestibular nerve divides into its superior and inferior branches only near the lateral end of the canal, typically at or just beyond the falciform crest. For most parts of their intra-meatal course, these divisions cannot be distinctly visualised or separated, either by cadaveric dissection or by imaging, because they are commonly fused. In many specimens, the superior and inferior vestibular nerves appear as a single structure (the common vestibular nerve), only becoming clearly distinguishable at the fundus of the IAC. Because of this anatomical continuity, volumetric measurements of the common vestibular trunk are most reliable, as attempting to distinguish and separately measure the individual branches would not be consistently feasible or reproducible and would not accurately reflect the true anatomy of the nerves.Reference Rubinstein, Sandberg and Cajade Law42, Reference Laine and Underhill43
Cranial nerve volumetry was defined a priori as a secondary, exploratory objective, designed to provide MRI-based reference values for cochlear and vestibular nerve volumes in patients with MRI-confirmed EH and to assess, in an exploratory fashion, whether nerve calibre showed any relationship to NPH surrogate markers. An example of cranial nerve volumetric measurement is given in Figure 2.
Example of volumetric measurement of the common vestibular nerve. Axial T2w SPACE image (A) at the level of the internal auditory canal (IAC) showing the orientation of the common vestibular nerve and location of the oblique sagittal 0.8 mm multiplanar reformat from which neural volumetric measurements were obtained. The corresponding oblique sagittal reformatted image (B) at the fundus of the IAC is positioned just lateral to the cochlear aperture. The facial nerve (1), cochlear nerve (2) and the common vestibular nerve (3) are marked. Panels (B) and (C) show sections of the volumetric drawing of the common vestibular nerve, one example in the intra-meatal segment (red ellipse) and one example in the cisternal segment (green ellipse).

Figure 2 Long description
This three-panel figure illustrates the workflow for semi-automatic or manual segmentation of inner-ear endolymph and perilymph on MRI. In panel a, an oblique multiplanar reconstruction of the temporal bone is shown, with coloured lines crossing the cochlea and vestibule to define the acquisition planes used for volumetric analysis; small coloured ellipses mark the approximate positions of cochlear and vestibular ROIs. Panel b, outlined in red, presents a zoomed axial view through the internal auditory canal. Three numbered white arrows identify key anatomical structures such as the facial nerve, the cochlear nerve, or the vestibular nerve complex, and a blue dotted polygon traces the vestibular nerve complex selected for volumetric measurement. Panel c, framed in green, shows a zoomed view through the cisternal segment with a similar blue dotted contour encircling the vestibular nerve complex. Together, the panels illustrate how measurement planes are chosen and how volumetric measurement of cranial nerve volumes is carried out.
Endolymphatic hydrops grading
Two readers (AP and FS) independently graded cochlear and vestibular EH, based on established MRI criteria.Reference Bernaerts, Vanspauwen, Blaivie, van Dinther, Zarowski and Wuyts44 Ears were categorised into one of four distinct grades (grade 0/no EH, grade 1, grade 2, and grade 3 vestibular EH; grade 0/no EH, grade 1 and grade 2 cochlear EH), as described by Bernaerts et al.Reference Bernaerts, Vanspauwen, Blaivie, van Dinther, Zarowski and Wuyts44 In vestibular EH, these grades reflect progressive distension and fusion of the saccule and utricle, whereas cochlear EH grades depict increasing obliteration of the scala vestibuli by the distended cochlear duct. Disagreements between both readers were solved by a third senior reader (FW). For grading vestibular EH, the saccule and utricle were assessed at the most inferior level of the vestibule to avoid artefactual fusion or apparent enlargement of these structures that can occur when evaluating more superior slices. All readers were blinded to clinical data. Control ears were those ears without any features of EH on MRI according to any EH grading system. An example of EH grading is given in Figure 3.
Examples of endolymphatic hydrops (EH) grading. Delayed post-gadolinium axial 3D T2 inversion recovery (A, C) and delayed post-gadolinium axial 3D FLAIR images. (A) There is enlargement of the saccule on the left (white arrow) without fusion with the utricle, consistent with a vestibular EH grade 1. (B) Nodular hypo-intensities in the periphery of the apical and midturn of the cochlea on the left (arrow heads). No bandlike hypo-intensities in the basal turn of the cochlea making this a cochlear hydrops grade 1. The left saccule is enlarged and is just confluent with the utricule with a remaining peripheral rim enhancement, making this a vestibular hydrops grade 2. (C) There is fusion of the utricle and saccule on the right and the perilymphatic enhancement is no longer visible (arrow), compatible with a vestibular hydrops grade 3. The scala vestibuli is fully obliterated due to the distended cochlear duct (arrow heads), cochlear hydrops grade 2. Overall, vestibular hydrops grades 1–3 correspond to increasing saccular–utricular enlargement and fusion, while cochlear hydrops grades indicate the extent to which endolymphatic distension narrows or obliterates the scala vestibuli.

Figure 3 Long description
This figure consists of three vertically aligned MR images focused on the inner ear. Each panel is labeled a, b, and c in the upper corner. In panel a, the endo- and perilymphatic spaces of the cochlea and vestibule are visualised on a inversion recovery sequence, and a thick white arrow points toward the enlarged saccule indicating vestibular hydrops grade 1. Panel b shows slight enlargement of the cochlear endolymphatic space marked by two triangular arrowheads indicating cochlear endolymphatic hydrops. The vestibular components such as the utricle or saccule are now fused marked by a thick arrow, suggesting vestibular hydrops endolymphatic hydrops grade 2. Panel c demonstrates another inner-ear slice, with one bold arrow indicating the vestibular component and two arrowheads highlighting cochlear structures, together illustrating how perilymphatic signal and endolymphatic space configuration vary with hydrops grade. The figure is intended to help readers recognise typical hydrops-related signal changes in cochlear and vestibular compartments.
Clinical data and symptom assessment
Data on clinical symptoms collected from patient records included the presence or absence of hearing loss, sudden hearing loss, right/left-sided hearing loss, bilateral hearing loss, sensorineural hearing loss (SNHL), vertigo, tinnitus and aural fullness. Formal audiometric data (e.g. pure tone thresholds) were available only for a subset of patients and in non-uniform formats, and were therefore not analysed systematically in this study.
Statistical analysis
Statistical analyses were conducted using SPSS (IBM Corp., Armonk, NY, USA) V 29.0.1.0. with ‘two-sided’ statistical tests and confidence intervals with standard significance and confidence levels α = 5 per cent and (100 per cent – α = 95 per cent), respectively.
The effects of NPH imaging signs [callosal angle <90° or callosal angle (degrees)], Evan’s index (>0.3 or index value), crowding of sulci at vertex and enlargement of Sylvian fissure) as well as clinical symptoms (hearing loss, sudden hearing loss, right/left-sided hearing loss, bilateral hearing loss, SNHL, vertigo, tinnitus and aural fullness) were compared with EH grading (grades: 1–3) using binary logistic regressions or multivariable linear regression. Adjusted odds ratios (OR) with 95 per cent confidence intervals were reported for included predictors. Pearson’s correlation was used to indicate whether a statistically significant linear relationship existed between the continuous variables.
Results
Patient population
A study cohort of 108 patients diagnosed with EH met the inclusion criteria. Mean age was 53.6 ± 15.8 years and there was a slight female predominance (61/108; 56.5 per cent).
Endolymphatic hydrops grading
In the vestibular system, grade 2 EH was observed in 71.3 per cent (77/108) of right and 60.2 per cent (65/108) of left vestibules, while grade 1 EH was seen in 15.7 per cent (17/108) on the right and 21.3 per cent (23/108) on the left. Only one participant (0.9 per cent) demonstrated grade 3 EH on the left side; no cases of grade 3 EH were identified on the right.
Similarly, in the cochlea, grade 2 EH predominated, affecting 42.6 per cent (46/108) on the left and 34.3 per cent (37/108) on the right. Grade 1 EH was present in 19.4 per cent (21/108) of right cochleae and 18.5 per cent (20/108) of left cochleae, while grade 3 EH was rare, observed in only one right-sided case (0.9 per cent) and none on the left. No correlation between the patient’s age or EH grading was found.
Endolymphatic hydrops grading vs image-based normal pressure hydrocephalus and clinical markers
Binary logistic regressions revealed no significant associations between NPH MRI markers (callosal angle, Evans index >0.3, sulcal crowding, Sylvian enlargement) and vestibular or cochlear EH grades (all p > 0.05).
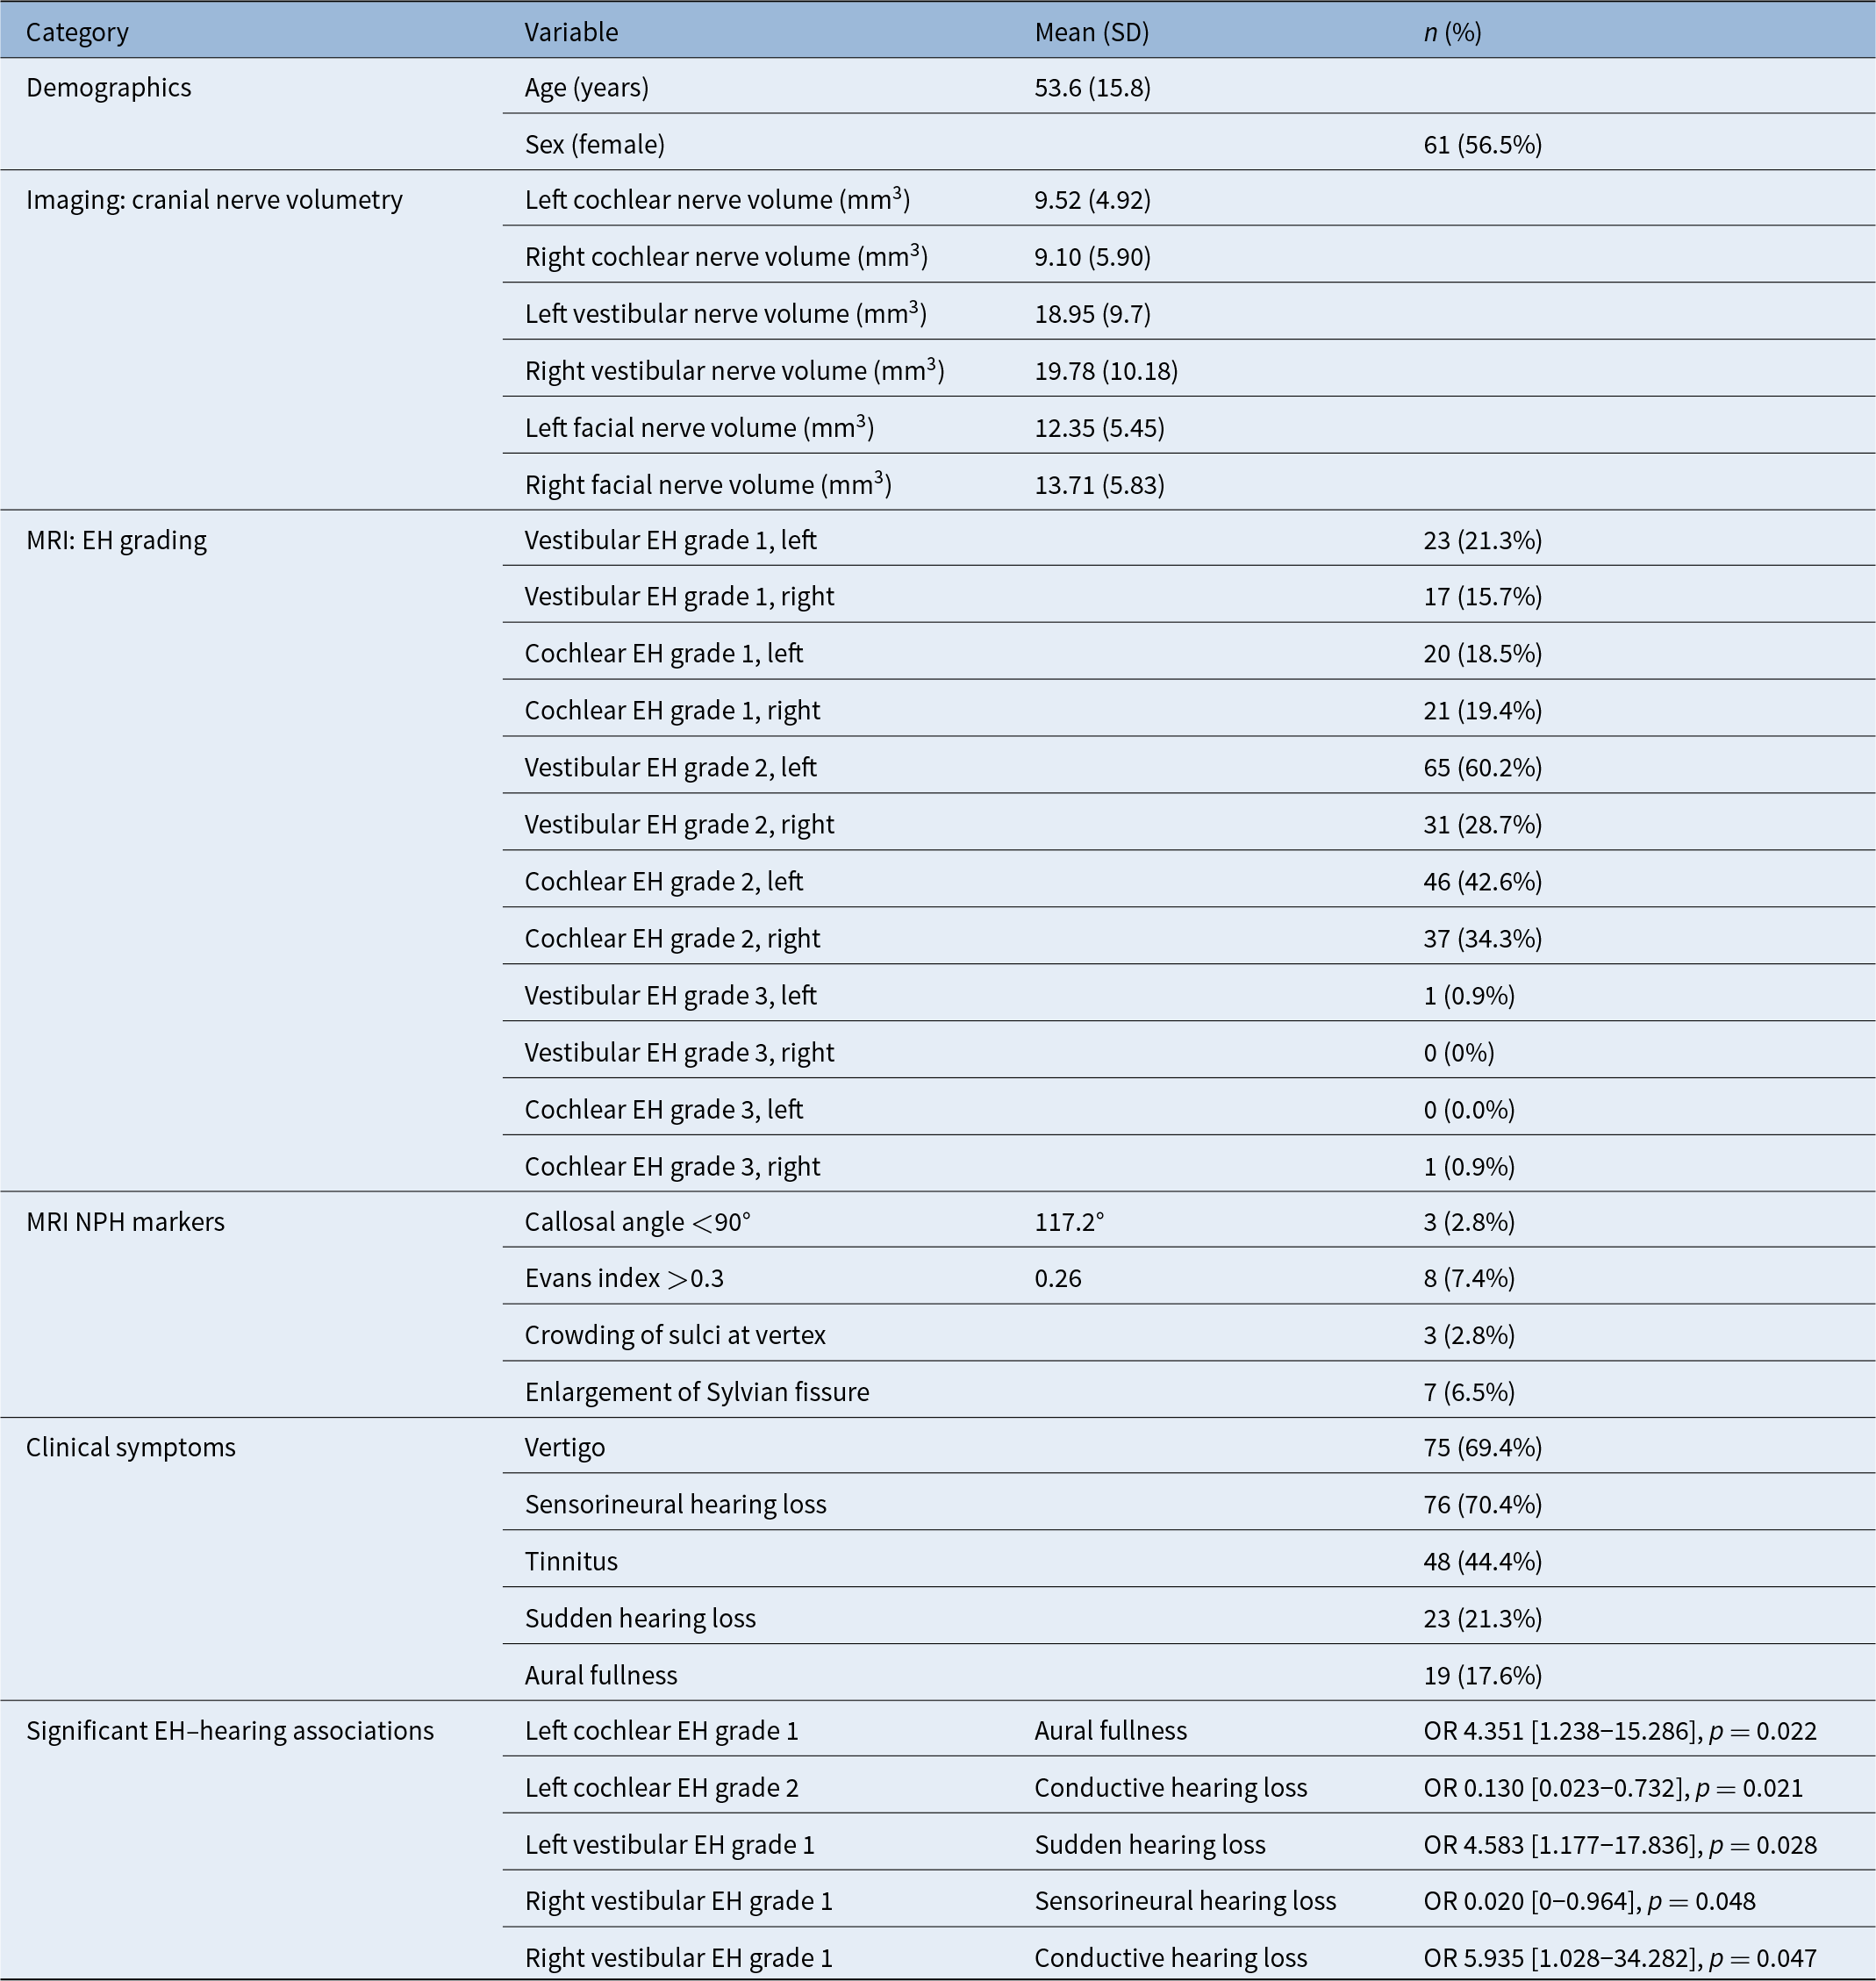
Significant clinical associations were observed between EH grades and specific auditory symptoms. Left cochlear EH grade 1 was associated with aural fullness (OR 4.35, 95 per cent CI 1.24–15.29, p = 0.022), while left cochlear EH grade 2 showed an inverse association with conductive hearing loss (OR 0.13, 95 per cent CI 0.02–0.73, p = 0.021). In the vestibular system, left vestibular EH grade 1 was associated with sudden hearing loss (OR 4.58, 95 per cent CI 1.18–17.84, p = 0.028), a finding that was replicated in an independent model (OR 5.21, 95 per cent CI 1.33–20.41, p = 0.018). Right vestibular EH grade 1 demonstrated divergent associations, showing lower odds of SNHL (OR 0.02, 95 per cent CI 0–0.96, p = 0.048) but increased odds of conductive hearing loss (OR 5.94, 95 per cent CI 1.03–34.28, p = 0.047). A summary of the results is presented in Table 2.
Summary of demographic characteristics, quantitative imaging findings and prevalence of clinical and radiological markers in 108 patients with endolymphatic hydrops. Data are presented as mean (standard deviation) for continuous variables and number (percentage) for categorical variables

Table 2 Long description
This table is structured by category and variable to describe the study cohort of 108 patients with endolymphatic hydrops. The demographics section reports a mean age of 53.6 years with a standard deviation of 15.8 and shows that 61 patients, corresponding to 56.5 percent, are female. The cranial nerve volumetry section lists mean volumes in cubic millimetres for left and right cochlear, vestibular, and facial nerves, reflecting variation in nerve size between sides and among nerves. The endolymphatic hydrops grading section presents the number and percentage of patients with vestibular and cochlear hydrops grades for each ear; grade 2 hydrops is most frequent, whereas grade 3 hydrops occurs rarely. MRI markers of normal pressure hydrocephalus include the callosal angle and the proportion of patients with values below 90 degrees, the Evans index with the proportion above 0.3, and qualitative features such as crowding of sulci at the vertex and enlargement of the Sylvian fissures, each given with counts and percentages. The clinical symptoms section lists vertigo, sensorineural hearing loss, tinnitus, sudden hearing loss, aural fullness, and conductive hearing loss with their respective prevalence, showing that vertigo and sensorineural hearing loss are the most common complaints. The final part of the table provides significant associations between specific cochlear and vestibular hydrops grades and hearing-related symptoms-aural fullness, sensorineural hearing loss, conductive hearing loss, and sudden hearing loss-expressed as odds ratios with 95% confidence intervals and p-values below 0.05. Abbreviations for standard deviation, cranial nerve, and endolymphatic hydrops are explained in a footnote.
EH = endolymphatic hydrops; MRI = magnetic resonance imaging; NPH = normal pressure hydrocephalus; OR = odds ratio; SD = standard deviation.
Discussion
In this retrospective analysis of 108 patients with EH, no significant association was observed between EH severity and NPH MRI biomarkers, despite theoretical CSF–perilymph hydrodynamic plausibility. The same MRI-confirmed EH cohort and high-resolution 3T inner ear protocol have previously been used to explore imaging markers of IIH, in which a relationship between EH and IIH-related biomarkers was demonstrated.Reference Péporté, Kostova, Berberat, Andreisek, Schön and Wagner21 In that earlier work, the emphasis was on features of sustained intra-cranial hypertension, whereas the present study focused on NPH surrogate MRI markers and cranial nerve volumetry in the same imaging dataset. Taken together, these complementary analyses suggested that EH was more closely linked to chronic ICP elevation than to the intermittent, low-amplitude pressure dynamics characteristic of NPH, helping to distinguish how different CSF pressure conditions may interact with inner ear fluid homeostasis.Reference Péporté, Kostova, Berberat, Andreisek, Schön and Wagner21
Cranial nerve volumetry, included here as a secondary exploratory objective, uses the same MRI-based segmentation approach and patient cohort as the dedicated morphometric study of cochlear and vestibular nerve volumes.Reference Péporté, Kostova, Andreisek, Schön and Wagner22 In the present analysis, these nerve volumes showed no association with NPH MRI markers, reinforcing the concept that EH is predominantly a peripheral labyrinthine fluid disorder rather than a condition characterised by altered cochlear or vestibular nerve calibre.
Beyond cochlear EH, our study revealed clinically significant associations between mild vestibular EH and hearing symptoms, challenging the conventional expectation that cochlear EH drives auditory dysfunction while vestibular EH predominantly causes vertigo. Specifically, left vestibular EH grade 1 was associated with sudden hearing loss (OR 4.58, 95 per cent CI 1.18–17.84, p = 0.028), which was replicated in an independent model (OR 5.21, 95 per cent CI 1.33–20.41, p = 0.018). Right vestibular EH grade 1, however, showed side-specific effects, with a very low odds ratio for SNHL (OR 0.02, 95 per cent CI 0–0.96, p = 0.048) and increased odds of conductive hearing loss (OR 5.94, 95 per cent CI 1.03–34.28, p = 0.047). Given the moderate sample size, the subgroup nature of these analyses, and the wide confidence intervals, these lateralised associations should be regarded as exploratory and may partly reflect random variation or statistical instability. Our data therefore do not justify firm conclusions about true right–left differences in vestibular EH–hearing relationships, and larger prospective studies with standardised audiometry will be needed to determine whether these patterns represent genuine physiological effects. In particular, the association between EH grades and conductive hearing loss is biologically implausible for a purely cochlear pathology and is more likely to reflect coexisting middle-ear disease, misclassification of hearing type or documentation artefacts; accordingly, we treat this as an exploratory, hypothesis-generating observation rather than a robust mechanistic finding.
Our results are supported by prior work on grading methodology and EH–hearing correlations. Han et al. conducted a retrospective MRI study using 3D-real inversion recovery sequences to compare vestibular EH grading methods and their association with hearing loss in MD. They found that specific grading criteria correlated significantly with hearing thresholds, whereas others yielded variable associations, emphasising that subtle vestibular EH can influence auditory function depending on detection and grading method.Reference Han, Huang, Xie, Liu, Gong and Yang45 Together, these data underscored the fact that vestibular EH is not purely a balance-related pathology, but may also modulate hearing, highlighting the importance of careful structural assessment even for mild EH.
Recent literature has clarified distinct pressure dynamics. A recent study established significant vestibular EH associations with IIH markers – optic nerve sheath dilation (p = 0.0368), tortuosity (p = 0.0309), slit-like ventricles (p = 0.0023) – but negative transverse sinus stenosis (ρ = −0.228, p = 0.017),Reference Péporté, Kostova, Berberat, Andreisek, Schön and Wagner21 supporting sustained ICP elevation disrupting endolymphatic sac absorption. IIH pathophysiology involves chronic cisternal hypertension directly transmissible via cochlear aqueduct/sac pathways, whereas NPH features normal mean CSF pressure (8–18 cmH₂O) with only intermittent B-waves and glymphatic stasis,Reference Relkin, Marmarou, Klinge, Bergsneider and Black46 insufficient to generate endolymphatic gradients observed in MD or IIH.
Cervical vestibular evoked myogenic potential findings require reinterpretation. Inui et al. found higher frequency responses in NPH patients (1.84 vs 1.03 in controls, p = 0.0047),Reference Inui, Haginomori, Kajimoto, Kuriyama, Shirai and Kinoshita26 suggesting inner ear pressure effects. However, our data failed to show any association between NPH MRI biomarkers and structural EH on detailed 3T MRI, indicating that there was no actual fluid buildup, despite functional changes. Methodological differences may explain these discrepancies. Inui et al. studied only 15 NPH patients using single-frequency bone-conduction sweeps (0.5–2 kHz) without structural imaging validation, risking central tuning artefacts mistaken for true saccular hydrops.Reference Inui, Haginomori, Kajimoto, Kuriyama, Shirai and Kinoshita26 Our study of 108 patients, the largest EH–NPH cohort to date, demonstrated superior rigour through comprehensive 3T MRI analysis – using high-resolution 3D-FLAIR sequences with delayed imaging optimised for EH detection, permitting direct visualisation – showing no association between NPH markers and structural EH. Shunt-responsive otologic symptoms,Reference Dixon and Jones33, Reference Varakliotis, Maspes, Rubbo, Cisternino, Lauriello and Vitti35 probably reflected central vestibular decompensation relief rather than perilymphatic pressure normalisation, as post-shunt EH imaging remains unreported.Reference Varakliotis, Maspes, Rubbo, Cisternino, Lauriello and Vitti35 The pressure difference may be the explanation for this. IIH’s continuous high pressure (>25 cmH₂O) causes endolymph overproduction, while NPH’s brief, low-amplitude pressure pulses cannot distend the membranous labyrinth.
This study has limitations inherent to its retrospective design. Lumbar puncture opening pressures were unavailable, preventing direct ICP quantification to correlate with EH severity, although mean ICP patterns are well characterised in NPH literature (approximately 12 cmH₂O). Functional vestibular testing was not systematically performed across the cohort. In addition, audiovestibular symptom data were extracted from routine clinical documentation rather than being obtained through a standardised research protocol; comprehensive pure tone audiometry was not available for all patients. This lack of uniform audiometric and functional data limits the precision of the symptom–EH grade associations reported and should be addressed in prospective studies incorporating standardised audiometry and vestibular testing.
Furthermore, the prevalence of radiological NPH markers in this EH population was very low (callosal angle <90° in fewer than 3 per cent of patients and Evans index >0.3 in just over 7 per cent), reflecting the fact that the cohort was not enriched for clinically suspected NPH. While this supports the clinical representativeness of the sample, it also limits the statistical power needed to detect modest associations between NPH surrogate markers and EH severity. Consequently, our null findings should be interpreted as hypothesis-generating and cannot entirely exclude a weak relationship between NPH and EH in other, more NPH-selected, populations. These gaps are addressable through prospective multicentre validations incorporating ICP monitoring, standardised vestibular protocols and diverse patient populations.
Routine NPH screening lacks utility in isolated EH with absent Hakim triad, conserving healthcare resources while redirecting focus to IIH evaluation (orbits included in MR field of view, lumbar puncture) in EH patients with suggestive features. The null result mechanistically resolves the EH–NPH paradox: NPH lacks sufficient pressure transmission to induce structural EH, distinguishing glymphatic (NPH) from endolymphatic (EH/IIH) disorders despite a 1–5 per cent older adult NPH prevalence and symptom overlap.
Conclusion
Future directions should include prospective CSF tap test cohorts correlating pre-intervention/post-intervention EH grading with intra-ventricular pressure monitoring, glymphatic contrast-enhanced MRIReference Ringstad, Vatnehol and Eide11 and serial post-shunt imaging to definitively exclude dynamic EH formation. Multimodal integration of otolith function, inner ear volumetry and aqueductal CSF flow quantification could elucidate subtle pressure–volume relationships below structural detection thresholds, refining the CSF–inner ear interface continuum.
Summary
What is already known on the subject
• Endolymphatic hydrops (EH) is the imaging hallmark of Ménière’s disease and can be visualised and graded on delayed post-gadolinium 3T magnetic resonance imaging (MRI).
• Normal pressure hydrocephalus (NPH) has characteristic MRI biomarkers (callosal angle, Evans index) and causes gait, cognitive and urinary symptoms.
• Cerebrospinal fluid (CSF)–perilymph pressure transmission has been shown experimentally and NPH shunting was shown to improve otologic symptoms in selected case reports.
What this paper adds to our understanding
• The prevalence of NPH MRI markers in patients with MRI-confirmed EH has not previously been defined.
• In 108 patients with EH, we found no association between EH severity and NPH MRI biomarkers or age, while mild cochlear and vestibular EH grades related specifically to hearing symptoms.
• These findings argue against routine NPH screening in isolated EH and support distinct glymphatic–endolymphatic mechanisms rather than simple CSF-driven secondary hydrops.
Acknowledgements
The authors would like to thank Susan Kaplan for her thoughtful assistance with manuscript editing.
Funding statement
This research received no specific grant from any funding agency, commercial or not-for-profit sectors.
Competing interests
The authors declare none
Ethical standards
The authors assert that all procedures contributing to this work comply with the ethical standards of the relevant national and institutional guidelines on human experimentation (please name) and with the Helsinki Declaration of 1975, as revised in 2008.



 Open access

