I. Introduction
Negative coverage in traditional media can impose substantial economic costs on firms. An extant body of research shows that negative media coverage can trigger regulatory intervention, reduce managerial compensation, and increase the likelihood of executive turnover (e.g., Dyck, Volchkova, and Zingales (Reference Dyck, Volchkova and Zingales2008), Liu, McConnell, and Xu (Reference Liu, McConnell and Xu2017), Love, Lim, and Bednar (Reference Love, Lim and Bednar2017), and Baloria and Heese (Reference Baloria and Heese2018)). Such costs make unfavorable traditional media coverage an important source of reputational and managerial pressure for firms. Firms, however, are not merely passive recipients of media coverage. Prior studies show that firms can actively influence media narratives through interactions with traditional media outlets, press releases, and strategic disclosures (e.g., Ahern and Sosyura (Reference Ahern and Sosyura2014), Edmans, Goncalves-Pinto, Groen-Xu, and Wang (Reference Edmans, Goncalves-Pinto, Groen-Xu and Wang2018), and Ru, Xue, Zhang, and Zhou (Reference Ru, Xue, Zhang and Zhou2020)). The rise of social media has further expanded firms’ ability to manage corporate narratives by providing rapid, widely accessible, and highly visible channels for reaching investors and other stakeholders.
Existing studies on firms’ use of social media to shape corporate narratives focus primarily on channels directly controlled by firms such as official corporate social media accounts (e.g., Blankespoor, Miller, and White (Reference Blankespoor, Miller and White2014), Blankespoor (Reference Blankespoor2018), and Jung, Naughton, Tahoun, and Wang (Reference Jung, Naughton, Tahoun and Wang2018)). Yet firms may also shape corporate narratives through an indirect channel: social media outlets that are not formally owned by the firm but are connected to the firm through ownership, investment, or personnel ties. Because these outlets appear as third-party intermediaries, their coverage may be perceived as less self-serving than direct corporate disclosure, making them potentially useful for proactive corporate narrative management during adverse events. Anecdotal evidence is consistent with the view that firms have strong incentives to manage unfavorable media exposure through indirect channels.Footnote 1 Little is known, however, about whether and how firms leverage connected social media outlets, or about the consequences and effectiveness of doing so.
In this study, we examine the role of connected social media outlets in shaping corporate responses to negative traditional media coverage. Specifically, we ask whether connected outlets portray firms more favorably than otherwise similar outlets, whether they become especially favorable following unfavorable traditional media coverage, and what incentives and consequences are associated with this form of indirect narrative management. To address these questions, we analyze social media coverage of publicly traded companies in China through WeChat Official Accounts. We focus on the Chinese setting for two reasons. First, in China, traditional and social media differ sharply in their institutional constraints. Traditional media are highly regulated, and corporations face explicit restrictions on investing in or controlling news organizations. Social media, by contrast, is more commercially oriented and less clearly regulated. This contrast creates a setting in which firms may influence corporate narratives through social media connections even when direct control of traditional media is restricted.Footnote 2 Second, China’s capital market is dominated by retail investors, who account for approximately 80% of stock trading volume.Footnote 3 These investors tend to be highly responsive to information disseminated through widely used platforms like WeChat, amplifying the potential impact of social media narratives. Introduced by Tencent in 2011 as an instant messaging tool, WeChat has since evolved into an integrated application with many features (e.g., messaging, social media functionalities, e-commerce capabilities, and mobile payment services) and has accumulated over 1.3 billion monthly active users.Footnote 4 In 2013, WeChat introduced Official Accounts, a social media platform allowing users to amass followers, distribute content to subscribers, engage with their audience, and offer various services.
As of 2023, there are over 20 million active WeChat Official Accounts, with news consumption as a primary reason for following accounts. Figure A1 in the Supplementary Material presents two prominent examples—36Kr and Wu Xiaobo Channel—both of which focus on financial and business news. We source WeChat articles from Datayes, a data vendor that collects articles from major financial media outlets via their WeChat Official Accounts and provides sentiment analyses using the attention-based convolutional neural network (CNN) model. Spanning from 2016 to 2023, the database covers over 1.25 million deduplicated WeChat news articles. These articles pertain to 5,274 Chinese A-share publicly traded companies, accounting for over 99% of the total market capitalization in China.
To identify corporate connections with social media outlets, we define a public firm as connected to a social media outlet if the public firm directly holds shares in, or has shares held by, the entity operating the WeChat Official Account (the “WeChat firm”); if the public firm and the WeChat firm share key personnel, such as the ultimate controller, large shareholders, legal representatives, or members of the top management team; or if they share common ownership through a third-party firm. We find that the fraction of Chinese public firms identified to have established a connection with social media outlets increases monotonically from 7.96% in 2016 to 14.96% in 2023, representing roughly 34% of the total market capitalization as of July 2023.
Our empirical analyses begin by examining the determinants of firms’ connections with social media outlets and whether firms with such connections are portrayed more positively across different information sources. We find that larger firms with stronger valuations are more likely to form connections, and that these connections are not driven by short-term responses to adverse media shocks. Coverage by connected outlets becomes more favorable following connection formation, and connected outlets exhibit a significantly more positive tone than unconnected outlets covering the same firm. This pattern is robust to controlling for firms’ own disclosure activities. Our findings indicate a systematic corporate narrative advantage associated with social media connections.
Next, we examine whether firms with social media connections combat negative traditional news coverage via social media outlets. As our baseline analysis, we identify 286 firm-date events where the average tone of traditional news articles covering a firm falls in the bottom decile. This generates a sample of 25,580 article-firm observations from 54 Chinese public firms with social media connections between 2016 and 2023. Focusing on WeChat articles published within the [−10, +10] event window, we apply a difference-in-differences (DiD) analysis, where the first difference compares pre- and post-event windows, and the second difference distinguishes articles published by social media outlets connected to the focal firm from those that are not.
We find that articles from connected WeChat accounts exhibit a more positive tone post-event compared to those from unconnected accounts, with the effect concentrated in the post-event period. This pattern is robust to alternative, less restrictive sample constructions, and is absent in placebo tests based on positive news events. To further validate these findings, we conduct a battery of robustness checks, including in-space and in-time placebo tests, alternative event definitions, variations in event windows and sample construction, stricter fixed effects, and controls for firms’ disclosures through alternative information channels. The estimated effects remain positive, statistically significant, and similar in economic magnitude.
We also examine whether the corporate narrative responses on social media outlets have real market consequences. We find that on days when firms are covered by at least one connected WeChat article following a negative news event, daily abnormal stock returns increase by approximately 0.3 percentage points relative to other days. These findings suggest that favorable narratives disseminated through connected outlets are associated with a partial mitigation of the adverse market reaction to negative news. This effect remains robust after controlling for firms’ direct disclosure channels, indicating that third-party social media outlets play a distinct role beyond direct corporate communication.
Furthermore, we examine how firms with social media connections combat negative traditional news coverage through social media outlets. Using machine-learning-based textual analysis, we label topics of traditional news articles on the event date and WeChat articles published within the [0, +10] window for each of the 286 events. We find that traditional news articles and unconnected WeChat articles tend to focus on similar topics, often highlighting short-term negative assessments of market reactions and financial performance. In contrast, connected WeChat accounts shift attention toward long-term firm development, including corporate strategy, R&D, cooperation, human resources, and CSR activities. This pattern is consistent with the “optimism shifting” mechanism in Cassella, Dim, and Karimli (Reference Cassella, Dim and Karimli2023). In particular, connected outlets do not primarily dispute unfavorable short-term information, but instead redirect attention toward more favorable, forward-looking aspects of the firm. In our setting, this optimism shifting operates through indirectly connected social media outlets rather than through firms’ own disclosure channels. Consistent with this interpretation, the narrative management effect is concentrated in events involving soft information, where ambiguity leaves greater room for interpretation, and is absent for hard-information events grounded in fundamentals.
We also explore firms’ incentives to counter negative traditional media coverage through social media. We find that our event study results are more pronounced when managers have greater incentives to stabilize stock prices, such as during an upcoming acquisition or when large shareholder/management interests are more closely tied to stock market performance (e.g., high ownership by large shareholders/management, share pledges by the ultimate controller, or high management options). Additionally, the effect is more pronounced when managers face more significant career concerns, as indicated by poorer firm performance, higher stock price volatility, and shorter-tenured CEOs.
Finally, we examine the effectiveness of corporate connections with social media outlets in stabilizing stock prices and protecting managerial careers. In particular, we investigate whether firms with social media connections perform differently than those without social media connections. Using firm-level regressions, we find that firms connected with social media outlets experience a more positive market reaction around acquisition events, higher insider trading profits, and a lower likelihood of executive turnover. The results indicate that through connections with social media outlets, firms can mitigate unfavorable traditional media coverage and protect managerial interests.
Our study contributes to two strands of the literature. First, our study contributes to the literature on the role of social media in capital markets. Much of this research characterizes social media coverage as an independent and decentralized source of investor-relevant insights that complements traditional intermediaries by uncovering overlooked information and enhancing market transparency (e.g., Chen, De, Hu, and Hwang (Reference Chen, De, Hu and Hwang2014), Ang, Hsu, Tang, and Wu (Reference Ang, Hsu, Tang and Wu2021)). A related strand of research considers social media as a firm-controlled disclosure channel. This literature typically focuses on official corporate accounts through which firms communicate directly with investors and other stakeholders. For example, Blankespoor et al. (Reference Blankespoor, Miller and White2014) show that firms’ use of Twitter to disseminate firm-initiated information can improve the firm’s information environment. Jung et al. (Reference Jung, Naughton, Tahoun and Wang2018) focus on firms’ strategic choice of whether to disseminate earnings news through Twitter, showing that this choice varies with the nature of the news. Wolfskeil (Reference Wolfskeil2023), by contrast, examines how firms use official Twitter accounts around earnings announcements and shows that the timing, tone, and content of firm-initiated tweets affect information diffusion and investor responses. These studies view social media primarily as a direct channel through which firms disclose information, broaden dissemination, and communicate with market participants.
We add to this literature by studying a different channel: social media outlets that are not formally owned by firms but are connected to them through ownership, investment, or personnel ties. This distinction is important because connected outlets can appear to operate as third-party information intermediaries while producing narratives that are systematically more favorable to connected firms. Our evidence therefore extends the literature by showing that social media can serve not only as an independent source of market information or a direct disclosure channel but also as an indirectly connected channel through which firms shape corporate narratives.
Second, we contribute to the literature on firms’ proactive management of media coverage and corporate narratives. Prior studies show that firms are not passive recipients of media attention but can take actions to influence how they are covered and interpreted by the market. One strand of this literature examines how firms shape media coverage through direct communication and disclosure activities, such as press releases, investor relations, and strategic information releases (e.g., Bushee and Miller (Reference Bushee and Miller2012), Ahern and Sosyura (Reference Ahern and Sosyura2014), and Ru et al. (Reference Ru, Xue, Zhang and Zhou2020)). Another strand of literature studies how firms influence media incentives through economic or institutional relationships, including advertising, cross-holdings, political connections, and business ties with media organizations (e.g., Gurun and Butler (Reference Gurun and Butler2012), Solomon (Reference Solomon2012), Gurun (Reference Gurun2020), Hossain and Javakhadze (Reference Hossain and Javakhadze2020), Yan, Wang, Wang, and Chan (Reference Yan, Wang, Wang and Chan2023), Xu (Reference Xu2024), and He, Xia, Zhao, and Zuo (Reference He, Xia, Zhao and Zuo2025)). This literature emphasizes that corporate media coverage can reflect not only the information environment surrounding firms but also firms’ incentives and ability to shape that environment.
We extend this literature by examining connected social media outlets as a distinct channel of indirect media management. Unlike press releases, investor relations, or official corporate social media outlets, connected outlets are not direct corporate disclosure channels. Unlike traditional media organizations, they operate in a social media environment in which content can be produced and disseminated rapidly, widely, and with less clearly defined institutional boundaries. This setting allows firms to influence corporate narratives through outlets that appear to function as third-party information intermediaries while being connected to the firm through ownership, investment, or personnel ties. Our evidence shows that such connected outlets become especially favorable following negative traditional media coverage, suggesting that firms can use social media connections to counterbalance unfavorable media narratives and manage reputational shocks.
II. Sample and Data
Our analyses combine novel data sets of financial news articles from both traditional media and social media in China, along with detailed information on Chinese listed firms. The sample spans January 2016 to July 2023, a period during which major Chinese social media platforms, notably WeChat, experienced significant growth. We provide a full explanation of the sample and data construction process in this section. For definitions of all variables used, please refer to Table A1 in the Supplementary Material.
A. WeChat Articles and Firms’ Connection to Social Media Outlets
Our analysis begins with a data set of financial news published on WeChat Official Accounts from Datayes, a leading data platform and information service provider in China. As China’s primary social media platform, WeChat introduced the Official Account (Gongzhong Hao) feature in 2013, which had achieved substantial market penetration by 2016.Footnote 5 Over the period from January 2016 to July 2023, Datayes collected over 5 million articles published by influential WeChat accounts.
Specifically, we focus on articles published by corporate-operated financial media accounts, excluding those from individuals, governments, or public firms’ own official accounts. This design allows us to capture firm–social media connections that operate through ostensibly independent intermediaries rather than direct corporate communication. Our final sample includes approximately 700 WeChat accounts covering 5,274 public firms, representing 99.15% of the total market capitalization in China as of July 31, 2023 (Table A2 in the Supplementary Material).Footnote 6 For simplicity, we refer to these corporate-operated WeChat entities as “WeChat firms” throughout the study. A public firm is considered “connected” if it is linked to at least one WeChat firm.
We define social media connections through three primary channels: i) direct investment relationships, where connections exist if a public firm holds shares in a WeChat firm or vice versa; ii) personnel-based connections, where the public firm and the WeChat firm share at least one key person, such as an ultimate controller, shareholder, legal representative, or member of the top management team; and iii) common ownership links, where both the public firm and the WeChat firm have ownership stakes in a third-party entity.
To determine whether a firm has the connections described previously with WeChat firms, we use data from Qichacha.com, one of China’s largest repositories of comprehensive business information. While mutual investment connections are directly accessible through a firm’s current and historical investment activity profile on Qichacha.com, identifying personnel-based and common ownership connections requires a more meticulous approach. We uncover these indirect connections through a manual procedure. Specifically, for both public firms and WeChat firms, we extract historical biographies of all their key personnel and collect information such as their positions in the firm, investment activities, as well as the starting and ending dates of each position/activity. We then cross-reference affiliations and dates to identify any overlapping periods.
To illustrate examples of social media connections, Graph A of Figure A2 in the Supplementary Material shows the connection between Wu Xiaobo Channel, a leading financial WeChat account, and Wufangzhai (stock ID: 603237.SH), a public firm specializing in traditional rice products. They have been connected through a shared independent director since March 2018. Graph B of Figure A2 in the Supplementary Material provides an example of an investment-based link: the connection between CRIC Real Estate Research, a leading real estate analytics media account, and the property developer Taihe Group (stock ID: 000732.SZ), established through Taihe’s direct investment in the parent company of CRIC.
For each public firm-year, we construct a binary variable Connect, which takes the value of 1 if the firm has established any of the three types of connections with at least one WeChat firm, and 0 otherwise. Once an initial connection is made, we assume it persists, even if there are temporary or permanent interruptions in the observable connection. For example, if a public firm was connected to a WeChat firm through personnel, we assume that a connection remains in place even if the key personnel resign. This assumption accounts for the possibility that other unobservable connections may emerge after the initial link is established.
Table 1 provides an overview of the prevalence and trends in firm-social media outlet connections. From January 2016 to July 2023, 14.66% of our sample public firms (730 out of 4,978) have established a connection with at least one WeChat firm. By July 2023, these connected firms collectively accounted for 33.91% of the total market capitalization of publicly traded firms in China. Over the sample period, the prevalence of social media connections significantly increased, rising from 7.96% in 2016 to 14.96% in 2023.

TABLE 1 Long description
The table consists of five columns: Year, Number of Connected Firms, Number of All Sample Firms, Percentage of Connected Firms, and Percentage of Total Market Cap.
* 2016 to 2023 (full sample): 730 connected firms out of 4,978 total firms (14.66 percent).
* 2016: 208 connected firms out of 2,612 total (7.96 percent), representing 20.36 percent of total market cap.
* 2017: 251 connected firms out of 2,877 total (8.72 percent), representing 24.40 percent of total market cap.
* 2018: 299 connected firms out of 3,308 total (9.04 percent), representing 27.10 percent of total market cap.
* 2019: 373 connected firms out of 3,548 total (10.51 percent), representing 32.99 percent of total market cap.
* 2020: 443 connected firms out of 3,733 total (11.87 percent), representing 29.07 percent of total market cap.
* 2021: 552 connected firms out of 4,088 total (13.50 percent), representing 28.02 percent of total market cap.
* 2022: 652 connected firms out of 4,566 total (14.28 percent), representing 30.79 percent of total market cap.
* 2023: 729 connected firms out of 4,874 total (14.96 percent), representing 33.91 percent of total market cap.
Table A3 in the Supplementary Material provides a detailed breakdown of the industry distribution for connected WeChat firms and for public firms connected to social media outlets. Notably, 67% of financial firms are connected to social media outlets, which is consistent with expectations given the involvement of investment firms that naturally form connections with numerous other entities. However, social media connections are also widespread across other industries. Specifically, real estate (33%), transportation, warehousing, and postal services (33%), and culture, sports, and entertainment (31%) emerge as the three most connected sectors. Additionally, over one-fifth of firms in electricity, heat, gas, and water production and supply (29%), education (25%), health and social work (24%), leasing and business services (24%), accommodation and food services (22%), and wholesale and retail trade (21%) are also connected to social media outlets. With a few exceptions, most other industries report social media connections exceeding 10%. These findings show how widespread social media connections are across industries.
Panel A of Table 2 reports characteristics of WeChat accounts in our sample. For connected and unconnected accounts at the account-year level, we report i) account age, ii) annual posting frequency, and iii) the breadth of firm coverage (i.e., the number of distinct firms covered). Connected accounts are only slightly older than unconnected accounts, but publish substantially more articles per year and cover a much broader set of firms. These comparisons indicate that our measure of social media connection captures firms’ links to active and influential media outlets, rather than to marginal or obscure platforms.

TABLE 2 Long description
The table is divided into three sections: Panel A, Panel B, and Panel C.
Panel A compares Connected versus Unconnected WeChat Accounts across three metrics:
* Account age: Unconnected mean 2.22, Connected mean 2.39, Difference -0.17, p-value 0.016.
* Annual posting frequency: Unconnected mean 569.03, Connected mean 1,286.35, Difference -717.32, p-value less than 0.001.
* Annual number of firms covered: Unconnected mean 191.55, Connected mean 391.01, Difference -199.46, p-value less than 0.001.
Panel B provides summary statistics for Event-Level Analyses including N, Mean, Standard Deviation, Minimum, Median, and Maximum for 11 variables. Key data points include:
* WeChat tone: Mean 0.055, N 25,580.
* Traditional news tone at day 0: Mean -0.137, N 2,031.
* Number of WeChat articles in the window -10 to +10: Mean 89.441, N 286.
* Number of connected WeChat articles in the window -10 to +10: Mean 13.832, N 286.
Panel C provides summary statistics for Article-Firm Level Analyses for 12 variables with N = 154,286. Key variables include:
* WeChat tone: Mean 0.063, Standard Deviation 0.121.
* Firm size: Mean 26.639.
* R O A: Mean 0.038.
* B H A R: Mean 0.132.
* S O E: Mean 0.474.
B. WeChat Article Sentiment
Most of our regression analyses are at the article-firm level, where the main dependent variable is the sentiment of the article toward the public firm in question. The article-firm sentiment scores are provided by Datayes, which employs a BERT-CRF model to identify firms mentioned in each article. Each article-firm pair is then assigned a relatedness score ranging from 0 (least relevant) to 2 (most relevant). We retain article-firm pairs that either focus exclusively on the focal firm (relatedness = two) or primarily discuss the firm while mentioning others (relatedness = one).
After identifying relevant firms for each article, Datayes applies a natural language processing (NLP) model—specifically, an attention-based CNN model—to assign a sentiment score to each article-firm pair. The score is calibrated on a scale from minus 1 (most negative) to 1 (most positive). In regression analyses, we weight the sentiment score by the relatedness score to reflect the extent to which readers receive information about the focal firm from the article.
C. Traditional News Articles and Negative News Events
Our investigation into whether and how public firms leverage their social media connections to counteract negative traditional media coverage focuses on events marked by particularly negative traditional media coverage. To identify such events, we utilize the Datayes data set that covers over 47 million deduplicated financial news articles from traditional media outlets. This data set’s structure, which mirrors that of the WeChat article data set, provides a key advantage in maintaining consistency and comparability in article-firm relatedness score and sentiment assessments across traditional and social media platforms.
We define firm-dates with particularly negative traditional media coverage (henceforth, “events”) as instances where the daily average relatedness-adjusted tone of traditional news articles falls within the bottom decile of that day. To improve the interpretative precision of our DiD analyses specified in Section IV.A, we focus on the [−10, +10] event window and require each event to include at least one connected WeChat article and one unconnected WeChat article in both the pre- and post-event windows. To avoid confounding effects, we further exclude events that occurred within 15 days of a prior event for each firm. This process yields 286 firm-date events from 54 public firms over 2016–2023, covering 2,031 traditional news articles on event dates and 25,580 WeChat article-firm observations within the [−10, +10] window.
Table A4 in the Supplementary Material compares the characteristics of the 54 firms in the event-study sample with those of other public firms. The sample firms are slightly larger and older, and exhibit higher leverage and book-to-market ratios, along with lower volatility and turnover, and a greater likelihood of institutional and state ownership. Panel B of Table 2 further reports the summary statistics for articles published around the event window. On the event date, the average firm receives 7.1 articles from traditional news outlets, with a tone score of −0.137, indicating generally negative sentiment. During the [−10, +10] window, the average firm receives 89.4 WeChat articles, including 13.8 from connected accounts (6.4 pre-event and 7.4 post-event) and 75.6 from unconnected accounts (34.0 pre-event and 41.6 post-event). The average tone of WeChat articles over this window is 0.055, likely reflecting the lack of consistently negative coverage in the pre-event window.Footnote 7 Figure A3 in the Supplementary Material revisits the case of Taihe Group and illustrates articles published around its negative traditional news coverage on August 14, 2020.
To address concerns that the baseline definition is overly restrictive and limits the sample size, we construct two additional, less restrictive samples of negative events. The first retains the bottom-decile cutoff but relaxes the requirement that both connected and unconnected articles be observed in both pre- and post-event windows, requiring such coverage only post-event. This relaxation expands the sample to 639 events covering 148 unique firms. The second further broadens the event definition from the bottom decile to the bottom quartile of daily traditional media tone while maintaining the post-only coverage requirement, yielding 1,401 events covering 222 firms.
D. Topics of News Articles
To investigate how connected firms counteract negative news coverage in traditional media through social media, we conduct a textual topic analysis on both traditional news articles and WeChat articles. For each article-firm pair, we use large language models (LLMs) to assign the most relevant topic based on the context in which the specific firm is mentioned.
We categorize news topics into the following nine categories: financial performance (e.g., net profits, cash flows, and debt conditions); investment/financing activities (e.g., acquisitions, asset restructuring, and capital-raising events); operating, production, and sales activities (e.g., inventory, raw materials, advertising expenditures, changes in core business scope, new product launches, and operational expansions); equity structure (e.g., shareholder pledges, dividends, and stock splits); market assessment and ratings (e.g., stock price changes, analyst evaluation, and rating agency updates); R&D, innovation, and human resources (e.g., patents, organizational restructuring, and executive hires); strategy, cooperation, and CSR (e.g., corporate alliances, partnerships, and charitable donations); regulatory, legal, and reputational shocks (e.g., regulatory warnings, lawsuits, and bankruptcy); and industry policies and macro-environment (e.g., industry trends, economic outlooks, and global market shifts). For detailed definitions and content of the news topic categories, please refer to Table A5 in the Supplementary Material.
E. Other Firm Characteristics and Activities
To construct stock market and firm-level variables, we obtain raw data from either the China Stock Market & Accounting Research (CSMAR) or the Chinese Research Data Service (CNRDS), two widely used databases for research on China’s financial markets. The variables we consider include firm size, firm age, book-to-market ratio, return on assets (ROA), leverage, buy-and-hold abnormal return (BHAR), stock volatility, stock turnover, institutional ownership, and a state-owned enterprise (SOE) indicator.
To examine firms’ motivations for establishing social media connections, we also analyze corporate acquisition, insider trading, and CEO/Chairman turnover activities. Specifically, data on acquisition activities are sourced from the China Listed Firm M&A and Restructuring Research Database by CSMAR; data on insider trading are obtained from the Insider Trading Database of Chinese Companies by CNRDS; and data on CEO/Chairman turnover come from the China Listed Firm’s Corporate Governance Research Database by CSMAR. Data construction and sample details are discussed in the relevant sections.
III. Connection Formation and Connected Social Media Tone
Before turning to our main analysis of how firms leverage these connections to counteract negative traditional media coverage, we first investigate the determinants of connection formation and then assess whether connected social media outlets differ systematically in tone.
In Table 3, we estimate logit models of connection formation, relating an indicator for whether a firm establishes a social media connection over the sample period to firm characteristics measured either in the fixed pre-sample year (2015) or in the year the firm enters the sample. We find that larger and older firms, those with lower book-to-market ratios, and SOEs are more likely to form such connections, suggesting that firms with greater market presence and stronger valuations are more inclined to engage with social media outlets.

TABLE 3 Long description
A table presenting logit regression results for the dependent variable Connect sub 2016 to 2023. The table has two columns of results. Column 1 uses characteristics in 2015 to predict later connection. Column 2 uses initial year characteristics to predict later connection.
* Firm size: 0.582 (0.080) in Column 1; 0.520 (0.059) in Column 2. Both significant at 1 percent.
* Firm age: 0.183 (0.093) in Column 1 (significant at 5 percent); 0.136 (0.076) in Column 2 (significant at 10 percent).
* B slash M: minus 1.215 (0.433) in Column 1; minus 1.148 (0.349) in Column 2. Both significant at 1 percent.
* R O A: 1.471 (1.222) in Column 1; 0.631 (0.910) in Column 2.
* Leverage: 0.309 (0.387) in Column 1; 0.245 (0.314) in Column 2.
* B H A R: 0.047 (0.127) in Column 1; minus 0.011 (0.081) in Column 2.
* Volatility: 4.349 (2.529) in Column 1 (significant at 10 percent); 2.257 (1.482) in Column 2.
* Turnover: 0.021 (0.042) in Column 1; 0.000 (0.032) in Column 2.
* Institutional ownership: minus 0.380 (0.826) in Column 1; minus 0.212 (0.582) in Column 2.
* S O E: 0.889 (0.135) in Column 1; 0.792 (0.109) in Column 2. Both significant at 1 percent.
Model Statistics:
* Number of observations: 2,600 in Column 1; 4,977 in Column 2.
* Pseudo R super 2: 0.162 in Column 1; 0.160 in Column 2.
* Year F Es: No in Column 1; Yes in Column 2.
* Industry F Es: Yes in both columns.
* Cluster by firm: No in both columns.
Because our later analysis focuses on whether connected firms use social media to counteract negative traditional media coverage, we also examine whether negative traditional media coverage affects connection formation. In Table A6 in the Supplementary Material, we include traditional media sentiment toward the firm as an additional determinant. The insignificant coefficient suggests that connections are not primarily formed as short-term responses to adverse media shocks but rather reflect more persistent firm strategies.
We next examine whether connected social media outlets are systematically more favorable toward affiliated firms. We begin by testing whether connection formation is associated with a change in coverage tone. In Table A7 in the Supplementary Material, we focus on firms that establish a connection during the sample period and compare the tone of articles published by the connected account before and after the connection is formed. The coefficient on Post connection formation is positive and statistically significant, indicating that tone becomes more favorable following connection formation.
We then examine whether this pattern holds relative to unconnected outlets covering the same firm. To ensure that connected and unconnected articles are compared against the same information environment, we construct a matched sample centered on each connected article. Specifically, for each article published by a connected WeChat account, we match articles from unconnected accounts covering the same firm within a [−10, +10] window. The resulting article-firm level sample contains 154,286 observations, of which 10.1% are connected articles (see Panel C of Table 2 for summary statistics).
Using this matched sample, we estimate regressions of WeChat tone, defined as the sentiment of the article toward the focal firm, on Connect, an indicator equal to 1 if the focal firm and the publishing WeChat account have a pre-existing connection measured in the year prior to the article publication date. We include year-month fixed effects and firm-WeChat account pair fixed effects. The latter absorbs all time-invariant heterogeneity at the firm-outlet level, so the coefficient is identified from within-pair changes in connection status and is less likely to reflect systematic differences across firms or outlets. The results, reported in Table 4, show that the coefficient on Connect lies between 0.019 and 0.023, depending on whether we include baseline controls, and is statistically significant at the 1% level. This represents approximately 30.2%–36.5% of the sample mean of WeChat tone (0.063), indicating an economically meaningful tone advantage of connected articles over unconnected ones covering the same firm.

TABLE 4 Long description
The table presents O L S regression results where the dependent variable is WeChat Tone. It consists of three columns: the variable name, Model 1, and Model 2.
* Connect: Model 1 shows 0.023 with a standard error of 0.006 (significant at 1 percent); Model 2 shows 0.019 with a standard error of 0.006 (significant at 1 percent).
* Firm size: Model 2 shows minus 0.014 (significant at 10 percent) with a standard error of 0.009.
* Firm age: Model 2 shows minus 0.006 with a standard error of 0.009.
* B / M: Model 2 shows 0.006 with a standard error of 0.018.
* R O A: Model 2 shows 0.007 with a standard error of 0.060.
* Leverage: Model 2 shows 0.054 with a standard error of 0.035.
* B H A R: Model 2 shows 0.002 with a standard error of 0.002.
* Volatility: Model 2 shows 0.065 with a standard error of 0.051.
* Turnover: Model 2 shows minus 0.006 with a standard error of 0.004.
* Institutional ownership: Model 2 shows minus 0.013 with a standard error of 0.033.
* S O E: Model 2 shows minus 0.007 (significant at 5 percent) with a standard error of 0.003.
Summary statistics for both models:
* Number of observations: 154,286.
* R-squared: 0.232.
* Year-month F Es, Firm-WeChat F Es, and Cluster by firm are all marked as Yes.
* Mean of the dependent variable: 0.063.
Variable name and coefficients are bolded to highlight the key variable of interest.
One concern is that the tone advantage of connected outlets may be confounded by firms’ own disclosure activities around the same period. To address this, Table A8 in the Supplementary Material augments the baseline specification in Table 4 by controlling for firms’ disclosures through alternative information channels, including clarification announcements, other corporate announcements, the firm’s own WeChat Official Account activities, online investor interactions, and roadshow or earnings briefing events.Footnote 8 Specifically, for each WeChat article, we include indicators for whether the firm engages in these channels within the [−5, 0] or [−5, +5] window around the article publication date. The coefficient on Connect remains positive, statistically significant, and quantitatively similar in magnitude, indicating that the role of connected outlets is not subsumed by firms’ direct disclosure responses.
Finally, while Table 4 compares connected with unconnected WeChat articles, we further compare connected WeChat articles with traditional news articles to characterize how connected outlets fit into the broader information environment. Following the same matching strategy as in Table 4, we match each connected WeChat article with traditional news articles covering the same firm within a [−10, +10] window and estimate an analogous regression. The results, reported in Table A9 in the Supplementary Material, show no statistically significant difference in tone between connected WeChat articles and traditional news articles in the unconditional sample.
IV. Whether Firms Counteract Negative Traditional News Coverage Using Social Media
In this section, we aim to address the key research question: do firms with social media connections use social media outlets to counteract negative news coverage in traditional media?
A. Event Study: Connected Outlets’ Response to Negative Traditional News Coverage
We use a DiD design to examine whether firms leverage their social media connections to counteract negative traditional news coverage. The event sample construction is detailed in Section II.C. We start our analysis with the most restrictive sample of 286 events and estimate the article-firm level DiD specification:

where the dependent variable is the tone of WeChat article i toward firm j, with a higher score indicating a more positive tone. The article publication date is denoted as t. The DiD variable follows a Treated × Post structure, where Treated is a Connect dummy equal to 1 if the article i is authored by a WeChat account connected to firm j, and 0 otherwise. Post is a dummy equal to 1 if the article i is published within the post-event window, and 0 otherwise.
This article-firm-level approach enables us to incorporate a granular set of fixed effects to control for covariates thoroughly. Specifically, we include: year-month fixed effects to capture variations in macroeconomic and market conditions; event fixed effects to control for event-specific factors, which absorb firm-level fixed covariates; relative-to-event-date fixed effects to account for distance-to-event covariates; and WeChat firm fixed effects to control for time-invariant characteristics specific to each WeChat account. We also cluster standard errors at the event level. Although the formation of firm–social media connections is inherently endogenous, our identification strategy helps alleviate this concern. By conducting article-level analyses within short event windows, we minimize the influence of potential selection bias associated with connection formation, making it unlikely to materially affect our results.
Our primary focus in this model is the estimated coefficient of Connect × Post, where a positive sign indicates that connected WeChat accounts publish articles with more positive sentiment than unconnected accounts following a highly negative traditional media event. The regression results reported in column 1 of Table 5 support our conjecture. Following negative traditional media coverage events, the tone of articles from connected accounts increases by 0.013 relative to unconnected accounts. The effect is economically meaningful, representing 23.6% of the sample mean WeChat tone (0.055). Additionally, the estimated coefficient of Connect is statistically insignificant, suggesting that connected articles do not consistently display higher tones in the pre-event window. That is, in the baseline event-study setting, the tone advantage of connected articles emerges after negative traditional media coverage.

TABLE 5 Long description
The table presents regression results for the dependent variable WeChat Tone. It is organized into four columns. Columns 1, 2, and 3 focus on Negative News Events, while Column 4 focuses on Positive News Events.
Row 1: Connect times Post.
- Column 1 (Bottom Decile, Pre and Post Required): 0.013 with three asterisks, standard error 0.005.
- Column 2 (Bottom Decile, Post Only): 0.016 with three asterisks, standard error 0.005.
- Column 3 (Bottom Quartile, Post Only): 0.014 with three asterisks, standard error 0.004.
- Column 4 (Top Decile, Pre and Post Required): 0.008, standard error 0.007.
Row 2: Connect.
- Column 1: minus 0.010, standard error 0.009.
- Column 2: minus 0.006, standard error 0.007.
- Column 3: minus 0.001, standard error 0.004.
- Column 4: 0.018, standard error 0.015.
Summary Statistics and Controls:
- Number of observations: 25,580 (Col 1), 39,247 (Col 2), 101,263 (Col 3), 11,594 (Col 4).
- R-squared: 0.225 (Col 1), 0.243 (Col 2), 0.216 (Col 3), 0.244 (Col 4).
- Fixed Effects (F E s): Year-month, Event, Event date, and WeChat F E s are marked ‘Yes’ for all columns.
- Cluster by event: ‘Yes’ for all columns.
- Number of events: 286 (Col 1), 639 (Col 2), 1,401 (Col 3), 234 (Col 4).
- Number of unique firms: 54 (Col 1), 148 (Col 2), 222 (Col 3), 49 (Col 4).
Variable name and coefficients are bolded to highlight the key variable of interest.
As detailed in Section II.C, the sample in column 1 is the most restrictive: the strict DiD design requires that connected and unconnected articles appear in both the pre- and post-event windows, which yields 286 events covering 54 unique firms. To assess robustness, we progressively relax this restriction. Column 2 retains the bottom-decile cutoff but requires connected articles only in the post-event window, expanding the sample to 639 events covering 148 firms. Column 3 further broadens the event definition by classifying events as firm-dates whose daily average relatedness-adjusted traditional news tone falls within the bottom quartile (rather than the bottom decile used in columns 1 and 2), while maintaining the post-only article requirement, yielding 1,401 events covering 222 firms (i.e., around 30% of sample firms with social media connections). Across all three samples, the Connect × Post coefficient remains positive, statistically significant, and quantitatively similar in magnitude, indicating that our results are not driven by the arbitrary choice of sample filters.
As a placebo test, column 4 of Table 5 examines the response of connected social media accounts to positive news events. These events are constructed symmetrically to our primary sample, defined as firm-dates where the average tone of traditional news articles falls within the top decile for that day. All other sample selection criteria, such as the event window and pre/post article requirements, are identical to those specified for negative events in column 1. The results show no discernible difference in tone between connected and unconnected articles around positive events. This suggests that the corporate use of connected media is primarily motivated by the need to counteract negative news, as the consequences of adverse coverage are particularly harmful to firms.
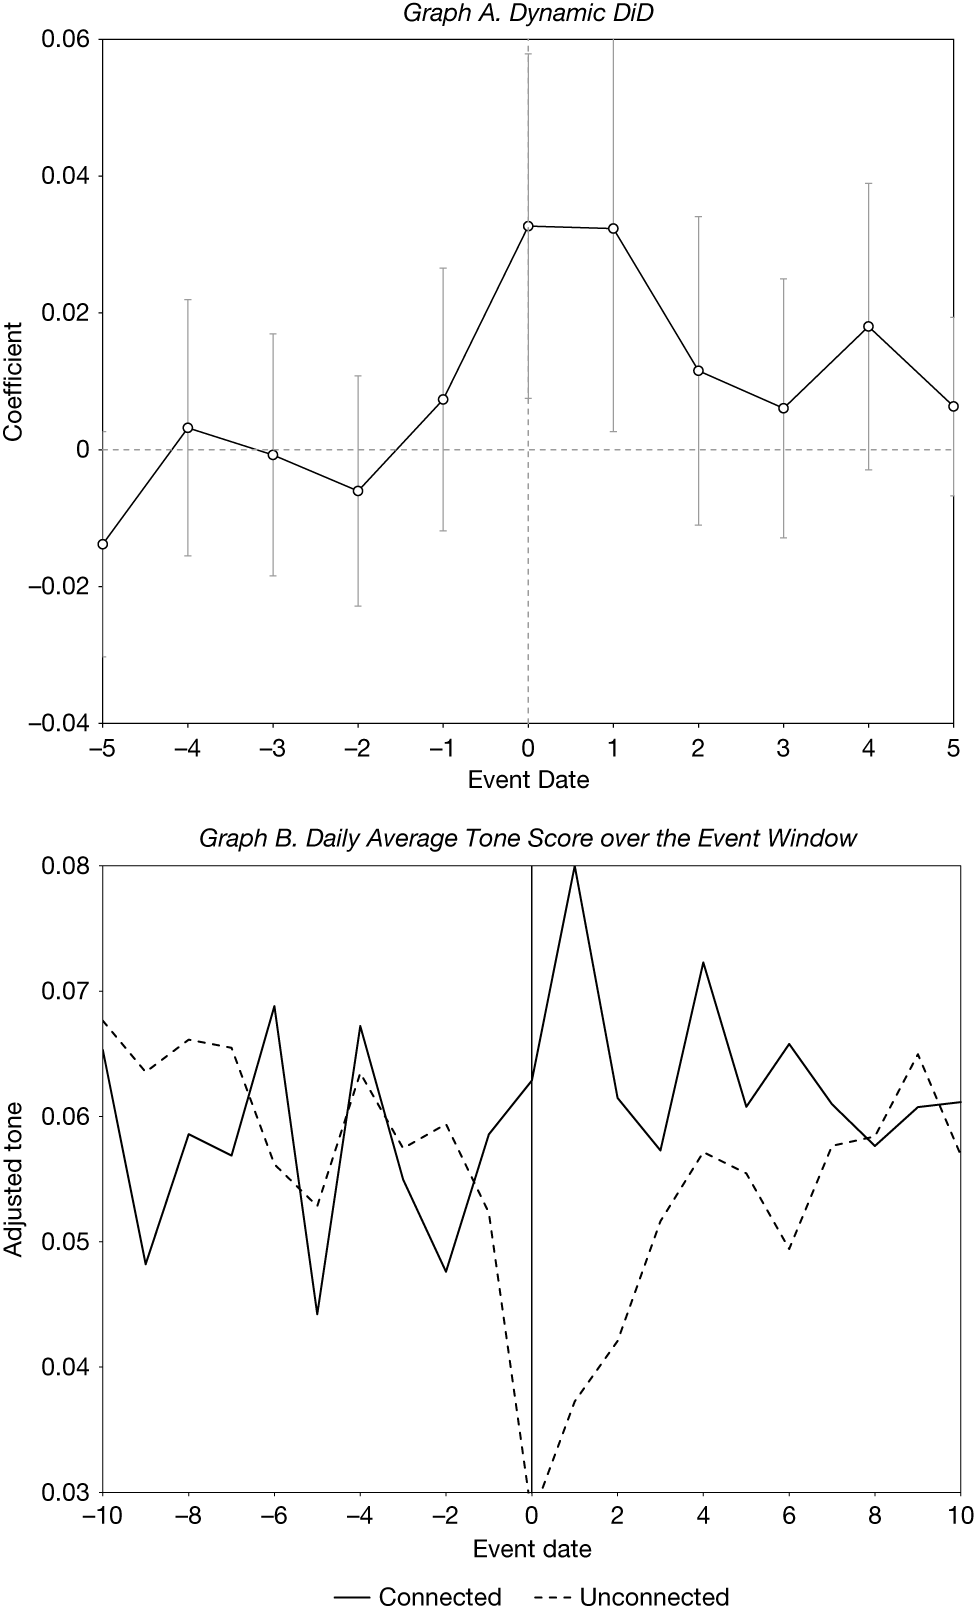
Based on the sample of 286 negative events, Graph A of Figure 1 depicts the coefficients of a dynamic DiD model, where we interact Connect with various relative-to-event-date dummies. The pattern validates the parallel trends assumption, indicating no significant differences in tone between connected and unconnected articles prior to the event date. On the event date, firms experience negative coverage in traditional news media, and the treatment effect becomes immediately significant on days 0 and 1. This finding suggests that connected social media outlets respond promptly to negative traditional media coverage by disseminating more favorable narratives. Such responses may help firms reframe adverse events, mitigate reputational damage, and dampen the adverse effects of negative traditional media coverage on stock prices and investor confidence.
Figure 1 presents the results of the parallel trends analyses. Graph A illustrates the estimated coefficients for the interaction between Connect and relative event time dummies in the dynamic DiD analysis, with 95% confidence intervals represented by dashed lines. Graph B displays the daily relatedness-adjusted tone scores over the [−10, +10] event window for both connected WeChat articles (solid line) and unconnected WeChat articles (dashed line).

FIGURE 1 Long description
A line graph with a vertical y-axis labeled Coefficient ranging from minus 0.04 to 0.06 in increments of 0.02. The horizontal x-axis is labeled Event date ranging from minus 5 to 5. A horizontal dashed line represents the zero baseline. A vertical dashed line is positioned at event date 0. The data is plotted as a solid line connecting circular points, each with vertical error bars representing 95 percent confidence intervals.
* From event date minus 5 to minus 2, the coefficients fluctuate slightly below the zero line, starting at approximately minus 0.015 and ending near minus 0.005.
* At event date minus 1, the coefficient rises to approximately 0.008.
* At event date 0 and 1, the coefficients peak and plateau at approximately 0.033.
* From event date 2 to 5, the coefficients remain positive but show a downward trend with fluctuations, ending at approximately 0.008 at event date 5.
* The error bars are notably wider for the post-event period (0 to 5) compared to the pre-event period.
Graph B of Figure 1 further illustrates the raw level of average daily relatedness-adjusted sentiment over the event window for both connected and unconnected articles. In particular, prior to the event date, tone scores for connected and unconnected articles are similar. On the event date, the tone of unconnected articles sharply declines, likely reflecting their alignment with the negative news content reported in traditional media. In contrast, articles from connected accounts display significantly higher sentiment scores immediately following the event. These sentiment scores gradually converge and intersect by day 8.
B. Robustness
To further mitigate concerns related to event sample identification and alternative explanations, we perform a battery of robustness tests. These tests follow equation (1) but apply several model variations, including assigning placebo treatments or event times, altering sample construction methods, adjusting event windows, modifying fixed effects, and controlling for alternative firm disclosure channels.
We first conduct an in-space placebo test by repeating the regression specified in equation (1) 500 times, randomly assigning the Connect indicator while maintaining the same proportion of connected articles as in the actual sample. Figure A4 in the Supplementary Material shows the histogram distribution of the estimated coefficients for Connect × Post. As illustrated, the distribution centers around 0 and rarely exceeds 0.01, whereas the actual coefficient is 0.013, as shown in column 1 of Table 5. This result suggests that the observed treatment effect is less likely driven by random chance or spurious correlations, reinforcing the validity of our findings.
In Panel A of Table A10 in the Supplementary Material, we conduct an in-time placebo test in which the event date is shifted backward, with placebo day 0 corresponding to days −5 to −1 in the original sample. Following standard in-time placebo testing, we exclude articles in the post-event window to ensure only unaffected observations are used. The results show that the estimated coefficient of Connect × Post becomes small and statistically insignificant, indicating that the timing of positive articles published by connected accounts is nonrandom. This timing pattern is consistent with connected outlets responding to periods of heightened negative traditional media coverage by publishing more favorable narratives.
In Panel B, we modify the event selection criteria. In column 1, we identify negative events using all firm-article observations with bottom-decile tone over the full sample period, rather than selecting the bottom-decile sample within each day. The results remain consistent with the baseline finding, with an effect size larger than that reported in column 1 of Table 5. In column 2, we adopt a more firm-specific approach: a firm-day is classified as experiencing a negative traditional media coverage event if the daily average tone of traditional news articles covering the firm falls more than 1-standard-deviation below the firm’s average tone in the previous year. Unlike the previous approaches that compare news sentiment across firms, this method focuses on deviations from the firm’s own historical media tone, offering a more tailored measure of unexpected negative coverage. The DiD coefficient remains positive and statistically significant, further reinforcing the robustness of our findings.
Panel C varies the event window and event-spacing criteria. Columns 1–2 adjust the event window from [−10, +10] in the baseline sample to a narrower [−5, +5] window and a wider [−20, +20] window, respectively. Columns 3–4 impose minimum time intervals of 20 and 30 days between consecutive events, instead of the baseline 15 days. In all specifications, the coefficient on the interaction term remains robust. Figure A5 in the Supplementary Material presents the corresponding dynamic DiD plots for the analyses in Panels B and C.
Panel D further tests fixed effects adjustments. Using the most restrictive sample of 286 events, we apply stricter fixed effects by including event × relative-date-to-event fixed effects. These fixed effects absorb year-month, event, and relative-date-to-event fixed effects, controlling for unobserved heterogeneity more comprehensively. The results remain both statistically and economically significant, further reinforcing the robustness of our findings.
In Panels E and F, we further control for firms’ own disclosure activities, as discussed in Section III. Specifically, we include indicators for firms’ use of five alternative disclosure channels around the event date: clarification announcements, other firm announcements, the firm’s own WeChat Official Account, online investor interactions, and roadshows or earnings briefings. Panel E defines these indicators over the [−5, 0] window, while Panel F uses the [−5, +5] window. Across both specifications, the coefficient on Connect × Post remains positive, statistically significant, and similar in magnitude, indicating that the role of connected outlets is not subsumed by firms’ direct disclosure activities.
Overall, these robustness tests indicate a consistent pattern: connected social media outlets publish significantly more positive articles immediately after receiving negative coverage in traditional media.
C. Stock Market Reaction to Positive Social Media Narratives
We then examine whether the favorable narratives published by connected social media accounts translate into a tangible stock market impact. To do so, we conduct a daily event-time analysis for the 286 negative news events, focusing on the post-event window [0, +10]. This creates a data structure of 3,146 firm-day observations (286 events × 11 days). We further exclude days with no WeChat coverage, resulting in a final sample of 2,364 observations.
We estimate regressions to examine how the presence of connected WeChat coverage influences market reactions to negative news events. Specifically, the dependent variable is either the daily abnormal stock return (AR), calculated as the firm’s daily raw return minus the value-weighted market return, or the cumulative abnormal returns (CAR) over the [0, +1] and [0, +2] windows. The key independent variable is a firm-day indicator, Connected day, which equals 1 if the firm is covered by at least one connected WeChat article on that day, and 0 otherwise. All regressions include year-month fixed effects and public firm/event fixed effects to account for time-varying market conditions and unobserved firm/event-level heterogeneity.
Table 6 presents the regression results. On days featuring at least one connected article, firms experience a significantly more positive market reaction. Specifically, the daily abnormal return is approximately 0.3 percentage points higher on connected days. This effect is not only statistically significant but also economically meaningful, representing a sizable increase compared to the mean daily abnormal return of −0.1 percentage points in our sample. These findings provide evidence that favorable narratives disseminated through connected media are associated with a partial mitigation of the adverse price impact of negative news.

TABLE 6 Long description
The table displays results for six regression models. The dependent variables are A R [0] in columns 1 and 4, C A R [0, +1] in columns 2 and 5, and C A R [0, +2] in columns 3 and 6.
* Connected day coefficients:
Column 1: 0.003 (significant at 1 percent level).
Column 2: 0.005 (significant at 1 percent level).
Column 3: 0.006 (significant at 1 percent level).
Column 4: 0.002.
Column 5: 0.004 (significant at 5 percent level).
Column 6: 0.004 (significant at 5 percent level).
* Number of observations: 2,364 for columns 1 through 3; 2,363 for columns 4 through 6.
* R-squared values: Increase from 0.176 in column 1 to 0.424 in column 6.
* Fixed Effects (F E s): All columns include Year-month F E s. Columns 1 through 3 include Firm F E s and are clustered by firm. Columns 4 through 6 include Event F E s and are clustered by event.
Variable name and coefficients are bolded to highlight the key variable of interest.
To disentangle the role of firms’ own communication channels from that of connected social media outlets in driving the stock market reaction, we re-estimate the firm-day specification while controlling for other corporate disclosure channels as in Table A8 in the Supplementary Material and in Panels E and F of Table A10 in the Supplementary Material. The results, reported in Table A11 in the Supplementary Material, show that the coefficient on Connected day remains positive and statistically significant, indicating that the market reaction we document is not driven by firms’ own disclosure responses.
To further examine whether the positive market reaction reflects a temporary price effect that subsequently reverses, we extend the return window beyond the short horizons reported in Table 6. Specifically, we re-estimate the market-reaction tests using cumulative abnormal returns over the [+3, +5], [+3, +10], [+3, +15], and [+3, +30] windows following connected social media coverage. The results, reported in Table A12 in the Supplementary Material, show that the coefficients on Connected day remain positive and do not exhibit a reversal over these longer windows. This evidence suggests that the favorable market reaction associated with connected social media coverage is not quickly undone in the post-event period. While this analysis does not fully resolve whether connected coverage improves or impairs price efficiency, it helps alleviate the concern that the documented positive reaction merely reflects a short-lived mispricing that is subsequently reversed.
D. Additional Analyses
In this section, we further examine the scope and boundary conditions of the connected-outlet response documented previously. While the baseline results show that connected outlets become more favorable following negative traditional media coverage, it remains unclear whether this pattern varies with firm and outlet characteristics, the nature of the triggering information, or the timing of information arrival. We therefore explore three complementary dimensions: ownership structure, information environment, and event timing.
First, we examine whether the response varies with the ownership status of the focal firm and the WeChat outlet. The direction of this heterogeneity is ex ante ambiguous. On the one hand, SOEs may face weaker market discipline due to implicit government backing, which could reduce their incentives to actively manage media narratives through commercial channels. On the other hand, SOEs are often subject to greater political and reputational scrutiny, which could increase their incentives to manage public narratives following negative coverage. The same dual logic applies to outlet ownership: state-owned WeChat outlets may be less commercially driven, but they may also be more responsive to politically sensitive reputational concerns.
Columns 1–2 of Table A13 in the Supplementary Material split the sample by focal firm ownership. The Connect × Post coefficient is positive and statistically significant only in the non-SOE subsample, while it is statistically insignificant for SOEs. Columns 3–4 further split the sample by WeChat outlet ownership and yield a similar pattern: the effect is concentrated among non-state-owned outlets and absent among state-owned outlets. Together, these results suggest that the connected-outlet response is more pronounced in settings where market-oriented incentives are stronger.
Second, we examine whether the response differs across types of media coverage. In particular, we distinguish between coverage that introduces substantively new information (“breaking news”) and coverage that reflects follow-up reporting on already-public events. To operationalize this distinction, we measure the textual similarity of traditional news titles on the event date relative to titles published in the [−5, −1] or [−10, −1] pre-event window. Specifically, we represent each title using TF-IDF weighted character-level n-grams (of length 2 and 3) and compute the maximum cosine similarity between event-date and pre-event titles.Footnote 9 Lower similarity indicates greater textual novelty.
We classify events as “breaking” if the similarity score falls below 0.4 and as “follow-up” otherwise. The threshold balances two considerations: it must be loose enough to capture coverage with substantively new information (“breaking” news) but not so strict as to be misled by the textual overlap inherent in financial news titles (such as corporate names and standard reporting language). The cutoff also yields a reasonable split of the sample.
Table A14 in the Supplementary Material re-estimates the event-study regression separately for the two subsamples. Columns 1–2 use the [−5, −1] window to construct the similarity benchmark, while columns 3–4 use the [−10, −1] window. The results show that the Connect × Post coefficient remains positive and statistically significant in both subsamples, with somewhat larger magnitude for follow-up coverage. This pattern suggests that the connected-outlet response arises both when new information is released and as coverage continues to circulate. We further verify that the baseline results are robust after excluding events that overlap with earnings disclosure windows (Table A15 in the Supplementary Material).
Finally, we examine whether firms respond only to realized negative coverage or also to anticipated negative information. While the baseline results focus on responses to realized media shocks, firms may also strategically position themselves around scheduled events, such as earnings announcements, which are observable to firms prior to public release. To study this possibility, we examine earnings announcements as a setting in which negative information can be anticipated. Unlike our baseline event-study design, this analysis focuses on the pre-announcement window.Footnote 10 Specifically, examining the [−10, −1] pre-announcement window of annual earnings releases, we find that connected articles are significantly more positive than unconnected articles, particularly when firms subsequently report negative earnings surprises (Table A16 in the Supplementary Material). This pattern suggests that firms engage in pre-event positioning, releasing more favorable narratives ahead of predictable adverse news.
Taken together, these results show that the connected-outlet response is not confined to a single setting but varies systematically with ownership structure, the information environment, and event timing. The response is stronger in market-oriented settings, arises both when new information is released and as coverage evolves, and extends to periods preceding anticipated negative events. These patterns highlight the broad scope of connected social media as a channel through which firms manage information flows under different conditions.
V. How Firms Counteract Negative Traditional News Coverage Using Social Media
We have demonstrated in the previous sections that firms can leverage connected social media accounts, characterized by notably more positive tones, to counteract negative news coverage in traditional media. In this section, we address a critical follow-up question: beyond adopting a more positive tone, do connected social media outlets differ from traditional media outlets in their choice of article topics? Specifically, do connected social media outlets discuss the same topics as traditional media but with a more favorable tone, or do they emphasize different topics to redirect readers’ attention?
To investigate this question, we conduct a detailed textual analysis of article content across three news sources: traditional media outlets, connected WeChat accounts, and unconnected WeChat accounts. Because our focus is on how social media responds after the emergence of negative traditional news coverage, we analyze traditional news articles published on the event day and WeChat articles during the [0, +10] post-event window. The inclusion of unconnected WeChat accounts allows for a more comprehensive comparison, offering deeper insights into the unique narratives employed by connected WeChat accounts. Articles are categorized into nine distinct topics, with detailed definitions provided in Table A5 in the Supplementary Material. We identify the topic of each article using Qwen, a state-of-the-art LLM developed by Alibaba Cloud for advanced text analysis.
To motivate our discussion, we reference an example in Figure A3 in the Supplementary Material. Taihe Group, a firm linked to a social media outlet, experienced a negative traditional news event on Aug. 14, 2020, due to an earnings miss. Column 1 in Figure A3 in the Supplementary Material lists the titles of all traditional news articles covering the firm on Aug. 14, 2020, with negative-tone articles marked in red, neutral articles in black, and positive-tone articles in green. Notably, there was no social media coverage on the event day, underscoring the dominance and spontaneity of traditional news in financial reporting.
Columns 2–4 display news coverage from the following 3 days, August 15–17, 2020. On Aug. 15 and 16, two unconnected social media outlets reported on the firm with a negative tone, covering similar themes of disappointing earnings performance. On August 17, however, a connected social media outlet published a positive-tone article titled “Taihe Group: Attracting Vanke Strategic Investment Sends Positive Signal.” This article shifted the narrative to highlight other favorable, long-term developments, potentially aiming to redirect readers’ attention and emphasize a brighter outlook for the firm. As illustrated by this example, we hypothesize that connected articles tend to shift readers’ attention by focusing on topics related to the firm’s optimistic future prospects.
We formally test this hypothesis in Table 7. Panel A presents the distribution of article topics, measured by both number and percentage of articles, across the three article samples. Columns 1–2 display the topic distribution for traditional news articles published on the event day, ranked by topic prevalence. Negative coverage is primarily associated with topics such as market assessment and ratings (e.g., declining evaluations by analysts or investors) and poor financial performance (e.g., falling net profits). Columns 3–4 report the topic distribution for unconnected WeChat articles published during the post-event window. Here, market assessment and ratings, along with financial performance, remain the top topics, consistent with the pattern observed in traditional media.

TABLE 7 Long description
Panel A, Topic Distribution, compares traditional media articles, unconnected WeChat articles, and connected WeChat articles across nine topic types. Traditional media is dominated by Market assessment and ratings at 23.09 percent and Financial performance at 18.81 percent. In contrast, connected WeChat articles shift focus toward R and D, innovation, and human resources at 32.47 percent and Industry policies and macro-environment at 26.25 percent.
Panel B, Regression Analyses, uses Same Label as the dependent variable. The independent variable Connect shows a negative and statistically significant coefficient across three models: -0.151 in columns 1 and 2, and -0.117 in column 3, indicating connected firms are less likely to use the same topic labels as traditional media.
Panel C, Event Study, compares Hard versus Soft Information Events. The Connect times Post coefficient is statistically significant for Soft Information Events in both the Baseline Classification (0.015) and Expanded Classification (0.025), while it is not significant for Hard Information Events. The P-value difference in Connect times Post is 0.334 for baseline and 0.026 for the expanded classification.
Variable name and coefficients are bolded to highlight the key variable of interest.
Columns 5–6 further present the topic distribution for connected WeChat articles published during the post-event window. Notably, topic distribution diverges significantly, with a higher proportion of articles focusing on industry policies and the macroeconomic environment—topics less directly related to the firm itself. Additionally, coverage of long-term development themes, such as R&D, innovation, human resources, strategy, cooperation, and CSR, increases substantially. These patterns validate our conjecture that connected firms on WeChat actively shift the narrative toward emphasizing their future prospects and positive developments.
In Panel B, we perform regression analyses based on the sample of WeChat articles published in the post-event window. The dependent variable, Same label, is a binary indicator that takes a value of 1 if the article topic aligns with the event topic, defined as the most prevalent topic among traditional news articles covering the firm on date 0, and 0 otherwise. The results indicate that connected WeChat articles are significantly less likely to address the same topics as traditional news, lending further support to our conjecture that connected firms shift the narrative to focus on positive and forward-looking themes.
Panel C examines heterogeneity in the effects of connected social media coverage depending on the nature of the underlying event—hard versus soft information. Hard events refer to adverse occurrences directly linked to objective firm fundamentals, such as weak earnings performance, bankruptcy, or legal and regulatory violations. These events are typically factual and concrete, leaving firms little room for reinterpretation. By contrast, soft events are less tied to concrete fundamentals and often stem from external circumstances or perception-driven narratives, such as macroeconomic downturns, industry sentiment shifts, or CSR-related controversies. Because such events are more ambiguous and open to interpretation, firms may find it easier to influence public perception through narrative framing on social media. In columns 1–2, we classify an event as hard information if the most frequently mentioned topic label in traditional media articles on the event date falls under either “Financial performance” or “Regulatory, legal, and reputational shocks.” All other events are categorized as soft information. In columns 3–4, we adopt a broader definition of hard information by additionally including events labeled as “Market assessment and ratings,” while the remaining events are treated as soft information.
The results show that connected accounts exhibit significantly more positive sentiment only when traditional news coverage centers on soft information. No significant difference is observed when negative traditional coverage focuses on hard information. This pattern suggests that connected social media outlets counteract negative sentiment when the underlying events are subjective or perception-based, but not when they concern concrete, verifiable fundamentals for which firms have limited narrative flexibility.
VI. Incentives and Effectiveness of Counteracting Negative Traditional News Coverage Using Social Media
Why are firms incentivized to leverage connected social media, and how effective is the proactive management of media narratives in achieving their intended outcomes? In this section, we explore and evaluate two key incentives that drive firms to utilize social media connections in response to negative traditional media coverage—stabilizing stock prices and mitigating managerial career concerns—and assess the effectiveness of such counterreactions.
A. Incentives
Prior studies show that negative media coverage can adversely affect stock prices (Tetlock (Reference Tetlock2007)), posing significant challenges for firms engaged in major investment or financing activities. Building on this notion, we conjecture that a key motivation for firms’ proactive social media management is to stabilize stock prices, particularly when preparing for high-stakes transactions. Given that mergers and acquisitions (M&As) are among the most important investment activities for firms, and a low stock price can weaken their negotiating position in such deals (e.g., Savor and Lu (Reference Savor and Lu2009)), we first examine whether the treatment effect is more pronounced when firms are preparing for an M&A transaction.
To test this, we split our sample firms into two groups based on whether a firm has a planned M&A transaction within the next 3 months. “Planned” transactions are identified ex post as those announced within 3 months following a negative traditional news coverage event. We then repeat our baseline DiD analyses separately for these two subsamples. Columns 1–2 in Panel A of Table 8 report the results.

TABLE 8 Long description
The table is divided into two sections: Panel A and Panel B. Both use WeChat tone as the dependent variable.
Panel A: Stock Price Stabilization.
This panel contains six columns divided into three subsample pairs: Acquisition Within the Next 3 Months, Large Shareholder Interests Closely Linked to Market Performance, and Management Interests Closely Linked to Market Performance.
* For Connect times Post, the coefficients are 0.059 (Yes) and 0.013 (No) for acquisitions; 0.027 (Yes) and 0.011 (No) for shareholder interests; and 0.022 (Yes) and 0.0004 (No) for management interests.
* P-value differences for Connect times Post are 0.013, 0.041, and 0.003 respectively.
Panel B: Managerial Career Concern.
This panel contains six columns divided into three subsample pairs: Poor Operating Performance, High Stock Price Volatility, and Short C E O Tenure.
* For Connect times Post, the coefficients are 0.050 (Yes) and 0.011 (No) for performance; 0.019 (Yes) and 0.008 (No) for volatility; and 0.018 (Yes) and 0.006 (No) for tenure.
* P-value differences for Connect times Post are 0.001, 0.106, and 0.072 respectively.
Both panels include fixed effects (F E s) for Year-month, Event, Event date, and WeChat, with standard errors clustered by event.
Variable name and coefficients are bolded to highlight the key variable of interest.
We find that although the coefficients for both subsamples are statistically significant, their magnitudes differ substantially. For firms with acquisitions announced within the following 3 months, the estimated coefficient for Connect × Post is 0.059, compared to 0.013 for firms without planned acquisitions. This significant difference in magnitude underscores the heightened impact of proactive social media management for firms preparing for imminent acquisitions. While the sample size of firms with upcoming acquisitions is relatively small (since only a limited number of events meet our DiD design criteria within the short window before an M&A deal), these results provide supportive evidence that firms with upcoming acquisitions have greater incentives to counteract negative traditional news coverage.
Beyond major corporate transactions, firms are also more likely to prioritize stock price stabilization when the interests of their large shareholders or managers are closely tied to market performance. In these scenarios, fluctuations in stock prices directly impact the financial well-being of these stakeholders, creating a strong incentive for them to mitigate price volatility. Stable stock prices not only preserve the value of their investments but also ensure the firm’s continued access to capital markets and maintain its reputation among investors.
To capture the extent to which shareholder and managerial interests are tied to firm market performance, we analyze shareholder/managerial ownership, share pledges, and management options of the firm. Specifically, a firm’s shareholder interests are considered closely tied to market performance if its largest shareholder’s ownership stake is in the top tercile across all firms in the year, or if the ultimate controller has pledged shares. Similarly, management interests are considered closely tied to market performance if management ownership is in the top tercile in the year or if the management team holds stock options.
In Panel A of Table 8, we perform subsample analyses to compare the treatment effect between groups where the interests of large shareholders (columns 3–4) or managers (columns 5–6) are closely tied to market performance and those where they are not. As expected, we find that connected articles exhibit a more positive tone when key personnel have a vested interest in firm market performance. Notably, in the subsample where managers’ interests are less aligned with firm performance, the estimated coefficient for Connect × Post is small and statistically insignificant, indicating a diminished use of social media in such cases.
Overall, the previous analyses support the hypothesis that firms with a strong incentive to stabilize stock prices, as captured by the presence of planned M&A deals and the alignment of key personnel interests with market performance, are more likely to leverage connected social media outlets. These firms are associated with more positive connected articles following negative traditional media coverage, consistent with an attempt to counteract unfavorable narratives.
An extension of the stock price stabilization motivation is the concern over managerial careers, as stock market performance is an important input in evaluating managers (e.g., Coughlan and Schmidt (Reference Coughlan and Schmidt1985), Murphy (Reference Murphy1985), Warner, Watts, and Wruck (Reference Warner, Watts and Wruck1988), Jensen and Murphy (Reference Jensen and Murphy1990), Jenter and Lewellen (Reference Jenter and Lewellen2021)). Poor stock performance, often amplified by negative media coverage, can expose managers to increased scrutiny from shareholders, potential damage to their professional reputation, and a heightened risk of turnover (e.g., Farrell and Whidbee (Reference Farrell and Whidbee2002)). These stakes create strong incentives for managers to take proactive measures, such as leveraging connected social media outlets, to counteract negative publicity and protect their positions.
We use three proxies to capture scenarios with heightened managerial career concerns: poor operating performance, defined as firms in the bottom tercile of ROA within their industry in the previous year; large stock price volatility, defined as firms in the top tercile of stock price volatility in the previous year; and short CEO tenure, defined as CEOs with less than 2 years in their role at the start of the year. The underlying assumption is that when operating performance is poor, stock price volatility is high, or the CEO is new to the role, career concerns become intensified, increasing the need for positive media coverage to stabilize stock prices. Using similar subsample analyses, we report results in Panel B of Table 8. Overall, these results provide supportive evidence for our hypothesis.
B. Effectiveness
In Section VI.A, we have identified three key scenarios where firms are more likely to leverage social media connections to counter unfavorable traditional news coverage: when approaching a merger, when insider interests are closely tied to market performance, and when managerial career concerns are heightened. Building on these findings, we now examine whether social media connections effectively achieve their intended outcomes. Specifically, we assess whether these strategies enhance M&A performance, increase insider trading profits, and reduce the likelihood of CEO or chairman turnover. To address sample size limitations and provide a comprehensive evaluation, we adopt a broader firm-level analysis, enabling us to explore the wider implications of social media connections in achieving these objectives.
In the case of M&A, the number of deals announced following a negative news event is limited. Therefore, we expand the sample to include all 9,463 M&A deals announced by Chinese public firms between 2016 and 2023 with a deal value no less than RMB 10 million, and test whether connected firms achieved higher cumulative abnormal returns (CAR) for these deals. Specifically, we regress CAR on Connect, where CAR is the cumulative abnormal return over the [−1, +1] window for each deal, and Connect is an indicator equal to 1 if the acquiring firm has established a social media connection in the year prior to the merger announcement, and 0 otherwise.
Panel A of Table 9 reports the regression results. Given that firms establish connections with social media outlets over time and may make multiple acquisitions over the sample period, we are able to include firm fixed effects. This allows Connect to capture the effect of social media connections independently of other firm-level covariates. Across columns 1 to 3, we vary the inclusion of deal characteristics and fixed-effects specifications. The results remain robust. Firms with social media connections show an abnormal merger return that is 0.015 higher than unconnected firms. This effect size is substantial, accounting for 29.4% of the sample standard deviation (0.051).

TABLE 9 Long description
The table is divided into three vertical panels.
Panel A, Acquisition Market Reaction, uses C A R [-1, +1] as the dependent variable across three columns. The main independent variable, Connect, shows positive coefficients of 0.016, 0.015, and 0.015, significant at the 5 percent and 1 percent levels. Control variables include firm size, firm age, B / M, R O A, leverage, B H A R, volatility, turnover, institutional ownership, and S O E. The number of observations is 9,463 with R-squared values ranging from 0.299 to 0.323.
Panel B, Insider Trading, uses Ln (1 plus Insider Profits) as the dependent variable across four columns: Six-Month, 12-Month, 6-Month Average Price, and 12-Month Average Price. The Connect variable shows positive and significant coefficients: 0.655, 0.866, 0.739, and 0.912. The number of observations ranges from 22,550 to 23,070 with R-squared values around 0.45 to 0.47.
Panel C, C E O / Chairman Turnover, examines turnover over the next 2 and 3 years. The Connect variable shows negative and significant coefficients of -0.045 and -0.053, suggesting connected firms have lower turnover. The number of observations is 29,249 with R-squared values of 0.363 and 0.488.
All panels include firm fixed effects and clustering by firm. Standard errors are provided in parentheses below the coefficients.
Variable name and coefficients are bolded to highlight the key variable of interest.
Panel B examines the payoff of social media connections on key personnel’s personal interests, as measured by insider trading profits. Specifically, we source insider trading records for our sample firms during the sample period from the Insider Trading Database of Chinese Companies by CNRDS, which provides details on insider trading dates, firms, and average transaction prices. Following Skaife, Veenman, and Wangerin (Reference Skaife, Veenman and Wangerin2013), we measure insider trading profits based on the annualized “future” returns at the time of insider trading. We calculate 6-month (or 12-month) annualized returns by comparing the stock price exactly 6 (or 12) months after the trade and the insider transaction price. For robustness, we also use the average price over the subsequent 6 or 12 months to mitigate potential bias from daily price fluctuations. The results indicate higher insider trading profits for connected firms, consistent with the possibility that social media connections help create more favorable market conditions from which key personnel may benefit.
In Panel C, we examine the impact of social media connection on key personnel’s career concerns, using CEO/Chairman turnover as the dependent variable. Specifically, turnover is defined as a dummy indicating whether the CEO/Chairman leaves the firm within the next 2 or 3 years. The results show that CEOs and chairmen of connected firms are significantly less likely to leave the firm compared to those at unconnected firms. This finding suggests that CEOs and chairmen may benefit from the more favorable information environment associated with social media connections.
VII. Conclusion
This study examines whether firms use connected social media outlets to counteract unfavorable coverage in traditional media. Using Chinese public firms and WeChat Official Accounts, we show that connected outlets portray firms more favorably than unconnected outlets. Following negative traditional media coverage, connected outlets become especially favorable toward the focal firm, suggesting that firms can use social media connections as an indirect channel for managing corporate narratives.
Our evidence further shows that the corporate narrative response is not simply a general increase in favorable communication. Connected outlets shift attention away from short-term negative assessments of market reactions and financial performance and toward longer-term themes such as corporate strategy, R&D, cooperation, human resources, and CSR activities. This pattern is consistent with an optimism-shifting mechanism, whereby connected outlets redirect attention toward more favorable and forward-looking aspects of the firm rather than directly disputing unfavorable news. The effect is concentrated in events involving soft information, where ambiguity leaves greater room for interpretation, and is stronger when firms have greater incentives to stabilize stock prices or when managers face heightened career concerns.
These findings contribute to our understanding of how firms manage media narratives in modern information environments. Prior research has largely viewed social media either as an independent source of market information or as a direct corporate disclosure channel. Our study highlights a different role: social media outlets can also serve as indirectly connected intermediaries through which firms shape corporate narratives. More broadly, the evidence suggests that the boundary between independent information production and corporate influence may be less clear in social media environments than in traditional media markets. As firms, investors, and regulators increasingly rely on social media as a source of corporate information, understanding these indirect channels of influence becomes important for evaluating the credibility, interpretation, and market consequences of firm-related news. Future research may examine whether similar indirect narrative-management channels operate in other media systems and regulatory environments.
Supplementary Material
To view supplementary material for this article, please visit http://doi.org/10.1017/S0022109026103317.
Funding Statement
Jiang acknowledges support from the Youth Fund of the National Natural Science Foundation of China (72302195), Xu acknowledges the Young Scientists Fund of the National Natural Science Foundation of China (72203013) for financial support, and Zhang acknowledges funding support by the National Natural Science Foundation of China (72442024), and by Major Project of the National Social Science Fund of China (25&ZD133).