Implications
The re-alimentation strategy involving challenge feeding of concentrate at 2.5% of body weight to cull ewes improves their body condition including enhancement in carcass yield and traits for better consumer acceptability. This short-term (90 days) manoeuvring will have a definite impact on marketability of cull ewes which otherwise fetches low price and en-routes to carcass adulteration. Therefore, further studies emphasizing economics of gain and evaluation of carcass for finished meat and allied products may supplement the present findings for better economic return to the livestock farmers besides optimizing use of cull ewes or rams to meet quality mutton for human consumption.
Introduction
Irrespective of breed, physiological stage of maturity and defined product utility (for meat or wool production) all sheep are slaughtered at the end of their productive life cycle for meat production. Ewes above 6 years of age are generally considered to cross its optimum production potential and are thus neglected and mostly undernourished (Chaturvedi et al., Reference Chaturvedi, Sankhyan, Mann and Karim2008), leading to a loss of body condition. In many developing or underdeveloped countries including India, approximately 40% of sheep slaughtered are of cull category with low body condition score (BCS) and meat from such aged sheep is usually tough and fibrous in texture and is not preferred by the consumers (Mendiratta et al., Reference Mendiratta, Kondaiah, Anjaneyulu and Sharma2008). Most older livestock are sold at unreasonable prices (50% of the price fetched by young animals) incurring a loss (Thiruvenkadan et al., Reference Thiruvenkadan, Karunanithi and Puroshothaman2004). The carcass from these ewes becomes ‘tough and sheepy’ due to increased crosslinking of collagen (Kopp and Bonnet, Reference Kopp and Bonnet1987) and accumulation of volatile branched-chain fatty acids (BCFAs) that characterize sheep and goat fats (Wong et al., Reference Wong, Johnson and Nixon1975; Ha and Lindsay, Reference Ha and Lindsay1991), and from phenols and indoles (Ha and Lindsay, Reference Ha and Lindsay1991; Young et al., Reference Young, Berdague, Viallon, Rousset-Akrim and Theriez1997). The concentration of BCFAs in carcass fats appears to increase with age (Sutherland and Ames, Reference Sutherland and Ames1996). The cull animals have low dressing yield (38% to 40%) with average carcass fat ranging from 4% to 6% (Jacob et al., Reference Jacob, Walker, Skerritt, Davidson, Hopkins, Thompson and Pethick2005).
The non-productive animals are subjected to various degrees of undernutrition in different seasons of the year (Chaturvedi et al., Reference Chaturvedi, Sankhyan, Mann and Karim2008) and hence re-alimentation increases gut fill besides some functional or structural changes in internal organs, particularly liver, kidney, heart and digestive tract (Baker et al., Reference Baker, Young and Laws1985). Studies on meat quality also indicate that a high growth rate before slaughter has a positive impact on meat tenderness (Muir et al., Reference Muir, Smith, Dobbie, Smith and Bown2001). Carcass tissues also vary in the extent of time taken to restore normal proposition during re-feeding. Protein deposition tends to be higher during the initial stages of compensation while the restoration of carcass fat takes a longer time (Hood and Thornton, Reference Hood and Thornton1980). In addition, metabolism of older animals compared with young animals, if altered through feeds and feeding, one would logically expect differences in the overall efficiency of nutrient utilization (Koenig et al., Reference Koenig, Boling and Bull1980). Beneficial effects have been derived from increasing dietary energy intake via an increase in dietary energy density by old animals as the maintenance requirement declines with advancing age. Therefore, this study was undertaken to elucidate the hypothesis that re-alimentation of undernourished cull ewes with increasing concentrate supplementation may have a positive effect on nutrient utilization and carcass quality thereby increasing their market value.
Material and methods
Study location
The experiment was conducted at the Central Sheep and Wool Research Institute, Avikanagar (Rajasthan, India) located at 26°17′N latitude and 75°28′E longitude and 320 m above sea level. The climate is hot and semi-arid. The study was initiated in April and ended in July (2007) simulating the most scarce season of the year. During the experiment, minimum and maximum ambient temperature averaged at 22.4°C to 26.8°C and 32.5°C to 41.8°C, respectively, with relative humidity varied from 42.7% to 82.8% at 0630 h and from 17.5% to 65.9% at 1430 h.
Experimental animals and housing
The ethical guidelines framed by Animal Welfare Division, Ministry of Environment and Forests, Government of India, were followed during the animal experimentation with prior approval of the study protocol by the Institute Animal Ethics Committee. Sixty-eight cull Malpura ewes (Ovis aries) above 6 years of age having an average body weight (BW) of 26.7 ± 0.33 kg were divided into four groups of 17 ewes each in a completely randomized design. The sheep were grazed in flock of 68 during the day and were housed in the evening in a shed with sandy floor covered on all sides with brick wall and asbestos sheet roofing.
Dietary treatments and feeding plan
All the ewes were allowed grazing for 8.0 h/day in the protected natural rangeland of the institute and offered concentrate after grazing in the shed. The dietary treatments groups were G0 (control) grazing pasture (predominant Cenchrus spp. and Dolichos spp with other grasses like Commelina forskalaei, Eleusine aegypticae, Crotalaria burhia, etc.) plus ad libitum guar (Cyamopsis tetragonoloba) straw (GS) and the three treatment groups – G1, G2 and G3 – offered additional concentrate mixture (Table 1) at the rate of 250 g (air dry basis; 90.8% to 91.6% dry matter (DM)), 2.5% of BW and ad libitum, respectively. All the animals had free access to clean drinking water. Daily record of roughage and concentrate offered and residue were maintained during the experimental period of 90 days. Pasture intake was recorded during the digestibility trial using chromic oxide (Cr2O3; Thomas Baker Chemicals Pvt Ltd, Mumbai, India) paper capsule technique (Krishna et al., Reference Krishna, Bhandari and Patnayak1981).
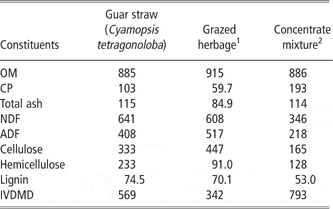
Chemical composition (g/kg DM) and IVDMD (g/kg) of roughages and concentrate mixture

DM = dry matter; IVDMD = in vitro dry matter digestibility; OM = organic matter.
1Grazed herbage was a mixture of predominantly Cenchrus spp. and Dolichos spp. Along with other grasses like Commelina forskalaei, Eleusine aegypticae, Crotalaria burhia, etc.
2Concentrate mixture: barley 770 g/kg, deoiled groundnut cake 100 g/kg, deoiled mustard cake 100 g/kg, mineral mixture (calcium 320, phosphorus 62, Manganese 2.7, zinc 2.6, iron 1, fluorine 0.9, iodine 0.1, copper 0.1 g/kg) 20 and Supplevit-M (vitamin A 1 00 000 IU, vitamin D3 20 000 IU, vitamin B2 0.04 g, vitamin E 15 IU, vitamin K 0.02 g, calcium pantothenate 0.05 g, nicotinamide 0.2 g, vitamin B3 0.12 mg, choline chloride 3 g, calcium 0.55 g, manganese 0.55 g, iodine 0.02 g, iron 0.15 g, zinc 0.3 g, copper 0.04 g, cobalt 0.09 g/100 g) 0.5 kg/ton of feed.
Sample collection and digestibility trial
Pasture samples were collected once weekly by allowing the selected sheep to graze on the pasture and the forage consumed by the animal was collected by trained operator following the sheep using mouth grab sampling (Sankhyan et al., Reference Sankhyan, Shinde, Bhatta and Karim1999a). On average, 40 to 50 bites/animal was collected and the samples were kept in plastic bags after drying in a forced air oven at 60°C. Samples of offered roughage (GS) and concentrate were collected once weekly and the respective samples were pooled after drying for chemical analysis.
A digestibility trial was conducted after 60 days of experimental feeding on five representative ewes from each group. The amount of faeces voided was determined by using Cr2O3 as an inert and undigested tracer (Harris, Reference Harris1967). Each sheep was dosed for 10 days with 1 g Cr2O3 in a paper capsule twice daily at 0700 and 1600 h, and at the same time faeces were sampled from the rectum during the last five consecutive days (Sankhyan et al., Reference Sankhyan, Shinde, Bhatta and Karim1999a). The samples of concentrate, roughage offered and herbage grazed and faeces were dried in a forced air oven at 60°C until constant weight. These samples were ground to pass through 1-mm screen and preserved in airtight containers for chemical analysis. Fresh faecal samples were collected every morning and transferred into a 500-ml Kjeldahl flask containing 25 ml of concentrated sulphuric acid for estimating N excretion in faeces.
Rumen fermentation pattern and enumeration of protozoal count
After 70 days of experimental feeding rumen liquor samples (50 ml) were drawn in the morning before being sent for grazing from five representative ewes from each treatment using a stomach tube connected to a suction pump. Each sample was placed in a 100-ml glass jar and the pH was determined immediately by using a digital pH metre. The rumen fluid was strained through a four-layered muslin cloth and the strained rumen liquor (SRL) samples were preserved by adding a few drops of saturated HgCl2 solution in labelled polypropylene bottles and stored frozen at −20°C. The samples were then analysed for total N, trichloroacetic acid-precipitable N (TCAP-N; Micro-Kjeldahl method; Association of Official Analytical Chemists (AOAC), 1995), ammonia N (NH3-N; Weatherburn, Reference Weatherburn1967) and total volatile fatty acids (TVFAs; Barnett and Reid, Reference Barnett and Reid1957).
For protozoa count, 1 ml of SRL was pipetted into a scintillation vial using a wide orifice pipette and 1 ml of physiological formal saline having methyl green indicator was added and stored at room temperature for total and differential protozoa count according to Sahoo et al. (Reference Sahoo, Agarwal, Kamra, Chaudhary and Pathak1999).
Haematological and serum biochemical profile
After 80 days of experiment, 5 ml of blood was collected into a 10-ml sterilized syringes from five representative ewes of each treatment by jugular vein puncture in the morning before being send for grazing. Five to six drops (0.3 to 0.4 ml) of blood was taken in heparinized microcentrifuge tube for haemoglobin estimation. Blood haemoglobin was estimated by the cyanmethaemoglobin method (Cook, Reference Cook1985). Serum was separated after 3 h of incubation at 37°C and glucose was estimated immediately by glucose oxidase–glucose peroxidase method (Trinder, Reference Trinder1969). The serum samples were preserved in polypropylene vials at −20°C for estimating total and high-density lipoprotein (HDL) cholesterol (Wybenga et al., Reference Wybenga, Pilegg, Dirstine and Giorgio1970) and non-esterified fatty acids (NEFAs; Shipe et al., Reference Shipe, Senyk and Fountain1980).
Recording of live weight (LW) and BCS
LW was recorded at weekly interval in the morning before grazing and watering of the ewes. BCS was recorded in all experimental ewes at the beginning, middle (45 days) and at the end of experimental feeding at 90 days by the method of Russel et al. (Reference Russel, Doney and Gunn1969).
Carcass studies
After 90 days all the cull ewes were fasted overnight with free access to water and slaughtered by Halal method in the modern abattoir at Meat Technology section of the institute. The weight recorded after deducting gut fill from pre-slaughter weight was termed as empty BW. Loin eye area (LEA; cm2) was determined by planimetre on both the cut surface of Longissimus dorsi (LD) muscles. Subcutaneous and intramuscular fats (SIFs) were mechanically separated and weighed. The LD muscle from different groups were allowed to set at refrigerated temperature (−20°C) overnight and then, chunks were cut into size of 1 cm3 and sheared in a Warner–Bratzler Shear Press (Model 80031289, GR Elect. Mfg. Co., Manhattan, NY, USA) with the fibre parallel to the longitudinal axis and the shear force value (SFV) was expressed as kg/cm3. The LD muscle from each carcass was individually preserved frozen (−20°C) for the analysis of chemical composition.
Chemical analysis
The moisture, CP, ether extract and ash content of concentrates, forages, faeces and meat samples were determined by methods of AOAC (1995). NDF was assayed without sodium sulphite by using a heat-stable α-amylase, particularly for concentrate sample and expressed inclusive of residual ash (Van Soest et al., Reference Van Soest, Robertson and Lewis1991), whereas ADF and ADL were determined by following the method of Robertson and Van Soest (Reference Robertson and Van Soest1981). Hemicellulose and cellulose were calculated from the difference between NDF and ADF and ADF and ADL, respectively. The chromium concentration in the faeces was determined by the method of Krishna et al. (Reference Krishna, Bhandari and Patnayak1981).
Statistical analysis
Data were subjected to one-way ANOVA using SPSS Base 14.0 (SPSS Software products, Marketing Department, SPSS Inc. Chicago, IL, USA). Significance among the treatment means was tested using Duncan's multiple range test (Duncan, Reference Duncan1955). Weekly BW change of individual ewes was determined by fitting polynomial curves and the generated constants were subjected to ANOVA to assess treatment differences (Snedecor and Cochran, Reference Snedecor and Cochran1989).
Results
Chemical composition of feeds and in vitro DM digestibility (IVDMD)
Chemical composition and IVDMD values of concentrate mixture, GS and grazed pasture are presented in Table 1. The grazed pasture was dry (88.5% DM) and was of poor quality having CP 59.7 and IVDMD 342 g/kg DM. The CP content of GS was 103 and that of concentrate mixture was 193 g/kg DM.
Feed and nutrient intakes and digestibility
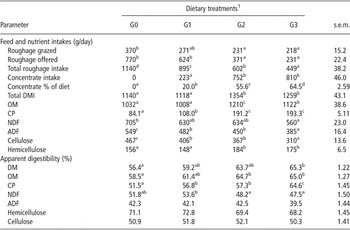
The control animals (G0) grazed more (P < 0.05) forage (370 g DM/day) compared with other animals supplemented with concentrate mixture, the difference with G1 being non-significant (P > 0.05), and it was lowest in G3 (Table 2). The consumption of offered forage (GS) followed a similar pattern of intake (g DM/day) with highest value in G0 (770) followed by G1 (624), G2 (371) and G3 (231). Ewes in G3 consumed 810 g DM from the offer of ad libitum concentrate compared with 752 g DM/day in G2 offered restricted at 2.5% of LW. Overall, the total DM intake (DMI) was higher in G2 and G3 than in G0 and G1.
Intake and digestibility of nutrients in different treatment groups

DMI = dry matter intake; OM = organic matter; DM = dry matter.
a,b,cMeans within a row with different superscripts are significantly different at P < 0.05.
1The dietary treatments groups were G0 (control) grazing pasture (predominant Cenchrus spp. and Dolichos spp with other grasses like Commelina forskalaei, Eleusine aegypticae, Crotalaria burhia, etc.) plus ad libitum guar (Cyamopsis tetragonoloba) straw and the three treatment groups – G1, G2 and G3 – offered additional concentrate mixture at the rate of 250 g (air dry basis; 90.8% to 91.6% DM), 2.5% of BW and ad libitum, respectively.
The digestibility (g/kg DM) values for DM, organic matter (OM) and CP were higher (P < 0.05) in concentrate-supplemented groups with increase in rate of supplementation (Table 2). The digestibility of NDF showed a reverse trend showing minimum value in G3, the difference between other three groups being non-significant (P > 0.05). The digestibility of other fibre components was non-significant among the groups.
Rumen fermentation pattern and ciliate protozoa population
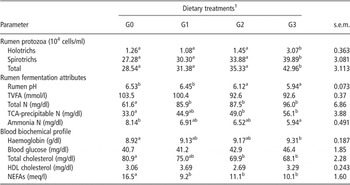
The ciliate protozoa population (holotrichs, spirotrichs and total) showed an increased (P < 0.05) shift in G3 compared with other treatment groups that showed non-significant change (Table 3). The rumen pH was low (P < 0.05) in G2 and G3 compared with that in G0 and G1. There was no significant alteration in TVFA concentration, but NH3-N concentration was lower in G3 with an inverse trend in total N and TCAP-N, which showed higher (P < 0.05) values in high-concentrate-fed groups (G2 and G3). The total N concentration (P < 0.05) was also higher in G1 than in G0.
Rumen ciliate protozoa population, fermentation attributes and blood biochemical profile of ewes in different treatment groups

TVFA = total volatile fatty acids; TCA = trichloroacetic acid; HDL = high-density lipoprotein; NEFAs = non-esterified fatty acids.
a,b,cMeans within a row with different superscripts are significantly different at P < 0.05.
1The dietary treatments groups were G0 (control) grazing pasture (predominant Cenchrus spp. and Dolichos spp with other grasses like Commelina forskalaei, Eleusine aegypticae, Crotalaria burhia, etc.) plus ad libitum guar (Cyamopsis tetragonoloba) straw and the three treatment groups – G1, G2 and G3 – offered additional concentrate mixture at the rate of 250 g (air dry basis; 90.8% to 91.6% DM), 2.5% of BW and ad libitum, respectively.
Blood biochemical profile
The animals in G3 had higher (P < 0.05) haemoglobin concentration than those in G0 and the difference between other dietary groups was non-significant (Table 3). Although serum glucose level tended to be higher in high-concentrate-fed groups, the difference was statistically non-significant (P > 0.05). The fatty acids profile showed a different trend having lower (P < 0.05) values in NEFA and total cholesterol but no change in HDL cholesterol in concentrate-fed groups compared with control.
Carcass characteristics
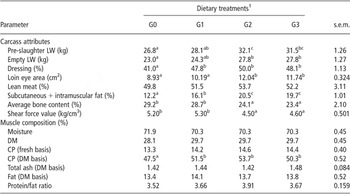
The pre-slaughter and empty LW of animals under G2 and G3 were higher (P < 0.05) than those under G0, with G1 having an intermediate value. The dressing yield (%) was higher in concentrate-fed groups with highest value 50.0 in G2 compared with a low value of 41.0 in control (Table 4). The LEA and SIF followed a similar trend with G2 showing the maximum value. The lean meat yield was non-significant (P < 0.05) between the groups, but average bone yield was high (P < 0.05) in G0 followed by G1, G2 and G3, the difference with G1 being non-significant. The SFV was not altered between G0 and G1, but reduced in G2 and G3 indicating increase in tenderness upon re-alimentation with energy-dense diet.
Carcass characteristics and chemical composition of Longissimus dorsi muscle

LW = live weight; DM = dry matter.
a,b,cMeans within a row with different superscripts are significantly different at P < 0.05.
1The dietary treatments groups were G0 (control) grazing pasture (predominant Cenchrus spp. and Dolichos spp with other grasses like Commelina forskalaei, Eleusine aegypticae, Crotalaria burhia, etc.) plus ad libitum guar (Cyamopsis tetragonoloba) straw and the three treatment groups – G1, G2 and G3 – offered additional concentrate mixture at the rate of 250 g (air dry basis; 90.8% to 91.6% DM), 2.5% of BW and ad libitum, respectively.
Nutritional state of ewes did not influence moisture level, DM and total ash in LD muscle (Table 4). The difference in CP content on fresh matter basis was not significant, but it showed higher values in G1, G2 and G3 when expressed on DM basis. There was no significant difference in fat content of LD muscle between the treatments, but when expressed in terms of protein/fat ratio, it was relatively higher in G2 compared with other groups. The difference in ash content was not significant (P > 0.05).
Plane of nutrition and fattening performance
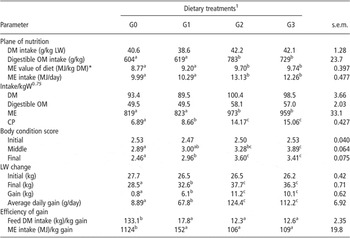
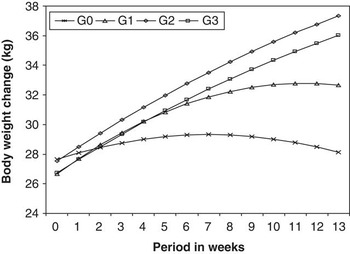
The feed DMI (g/kg LW) was high ranging from 38.6 (G1) to 42.2 (G2). Re-alimentation with high-concentrate diet supported significantly (P < 0.05) higher digestible OM (DOM) intake in G2 and G3 compared with G0 and G1 (Table 5). The metabolizable energy (ME) content of the diet was also significantly (P < 0.05) increased with higher ME intake in G2 and G3 compared with G0 and G1. The feed and nutrient intake/kgW0.75 also showed a higher ME intake in G2 and G3 compared with other treatment groups. There was improvement (P < 0.05) in BCS in all concentrate-supplemented groups with better performance in G2 and G3 as noted during middle (45 days) and at the end (90 days) of the experiment (Table 5). In the same line, re-alimented animals in G1, G2 and G3 attained higher LW compared with control and it was also evidenced with higher gain, G2 and G3 topping the chart as shown in the polynomial curve (Figure 1).
Plane of nutrition and performance assessment in different treatment groups

LW = live weight; DM = dry matter; ME = metabolizable energy.
*ME (MJ/kg DM) = digestible OM (kg/kg DM) × 18.5 × 0.81 (AAC, 1990).
a,b,cMeans within a row with different superscripts are significantly different at P < 0.05.
1The dietary treatments groups were G0 (control) grazing pasture (predominant Cenchrus spp. and Dolichos spp with other grasses like Commelina forskalaei, Eleusine aegypticae, Crotalaria burhia, etc.) plus ad libitum guar (Cyamopsis tetragonoloba) straw and the three treatment groups – G1, G2 and G3 – offered additional concentrate mixture at the rate of 250 g (air dry basis; 90.8% to 91.6% DM), 2.5% of BW and ad libitum, respectively.
Weekly live weight change in different treatment groups. G0 (control) = 27.1 + 0.545X − 0.034×2, G1 (control+250 g concentrate) = 25.6 + 1.160X − 0.047X2; G2 (control+concentrate at 2.5% BW) = 26.6 + 1.006X − 0.017X2; G3 (control + ad libitum concentrate) = 25.8 + 0.952X − 0.016X2.

The efficiency of gain in LW (LWG) and/or mutton production was calculated to show fattening performance of animals in different dietary groups. There was considerably (P < 0.05) lower feed and ME consumed for kg LWG in G2 and G3 compared with G1. The comparison with control group (G0) has little meaning as it manifested insignificant change in LW during the re-alimentation process.
Discussion
The pasture with DM 88.5% and CP 5.97% was less palatable as indicated from the observation on DM grazed, which was quite low (370 g/day) compared with consumption of DM from GS (770 g/day), stall-fed after grazing, in the control group. A low IVDMD value (342 g/kg DM) of grazed herbage also indicated its poor quality. Although, a low consumption could also be attributed to less pasture availability in the region (Sankhyan et al., Reference Sankhyan, Shinde and Karim1999b) and this was one of the reasons that sheep farmers preferred to sell their ewes even at lower market price besides the reasons for poor carcass quality (Thiruvenkadan et al., Reference Thiruvenkadan, Karunanithi and Puroshothaman2004). The DMI of 1140 g/day from complete roughage diet accounting to 40.6 g/kg LW may be attributable to compensatory increase in feed intake during re-alimentation process of cull ewes that were undernourished earlier to this experimentation. An amount of concentrate 250 g/day (air dry basis) to G1 was intended to simulate an average farmer's capability to supplement over and above grazing and supplemental forage. However, the animals under this group did not show any increase in DMI, instead there was a drop in intake of DM from both grazing and offered roughage. But, it has influenced digestibility of nutrients, most significantly the NDF compared with high-concentrate-fed groups, and the CP compared with G0. An increased digestibility may be attributed to the stimulatory effect contributed by intake of high protein and non-structural carbohydrates or NDF (100) from supplemental concentrate. It was higher in G2 and G3 because the increase in DMI was mainly contributed from high-concentrate supplementation and conversely, the animals consumed less DM from both grazing and offered roughages. A progressive increase in the digestibility of nutrients with increase in concentrate supplementation in finisher lambs was also reported earlier (Karim et al., Reference Karim, Tripathi and Singh2007; Tripathi et al., Reference Tripathi, Chaturvedi, Karim, Singh and Sisodiya2007). Under free-choice cafeteria system, animals tried to consume the most palatable feed, here, the concentrate, compared with low-quality roughages. Dikmen et al. (Reference Dikmen, Ustuner, Turkmen and Ogan2009) viewed that Awassi lambs can select a diet matching their nutritional requirements from a group of feed sources in response to their growth compared with conventional system. According to Forbes (Reference Forbes2003), animals can assess whether an intake somewhat higher or lower than their average intake will improve their well-being and is regulated by the proportional deviations of resources supply from the feed (e.g. energy, protein, fibre). In the present experiment, offering concentrate at 2.5% of LW (G2) or ad libitum (G3) provided ample opportunity for ewes to consume 55.6% and 64.5% of total DMI and conversely, they reduced their roughage intake but still maintained a higher DMI compared with G0 and G1. An increase in feed DMI resulted in increased OM and CP intakes, the later was mainly due to high CP content in concentrate. Contrary to this, the lower intake of fibre constituents except hemicelluloses was due to compositional variation between roughages and concentrates and their proportional intake in different groups.
A decrease in ruminal pH with increased concentrate levels in the diet is not uncommon (Carro et al., Reference Carro, Valdes, Ranilla and Gonzalez2000; Hirstov et al., 2001; Tripathi et al., Reference Tripathi, Santra, Chaturvedi and Karim2004). Decreased rumination and salivation is normally associated with high-concentrate diets leading to lowered buffering capacity that coupled with rapid microbial degradation of soluble carbohydrates and ensuing decline of ruminal pH. The ruminal pH approximately 6 in G2 and G3 seemed to be the critical level, since fibre digestibility and rumen microbial fermentation are adversely affected below this pH (Shriver et al., Reference Shriver, Hoover, Sargent, Crawford and Thaine1986; Calsamiglia et al., Reference Calsamiglia, Ferret and Devant2002). Therefore, a decreased NDF digestibility was observed in these high-concentrate-fed groups. Further, between G2 and G3, the latter had higher level of concentrate in the diet (64.5% v. 55.6%) and it was reflected in lower pH (5.94 v. 6.12) and a dip (although statistically non-significant) in fibre digestibility. An increase in ciliate protozoa population including that of holotrichs in response to increased levels of concentrate might also have contributed to stabilizing pH nearing 6.0 in G3. Similarly, a high protozoan population is implicated as a beneficial contribution to the fermentation process (Towne et al., Reference Towne, Nagaraja, Brandt and Kemp1990). Protozoa also influence rumen volatile fatty acid patterns by ingesting starch granules that resulted in reduction in the concentration of TVFAs ensuing lower pH in the rumen (Williams and Coleman, Reference Williams and Coleman1992). Protozoa may thus play a major role in preventing the development of acidosis and stabilizing pH by the direct and indirect control of ruminal fermentation (Brossard et al., Reference Brossard, Martin, Durand and Michalet-Doreau2004). In the present experiment, no animals in high-concentrate-fed groups showed any signs of ruminal acidosis. Under similar feeding regimen, a high protozoa population was also observed earlier (Santra et al., Reference Santra, Chaturvedi, Tripathi, Kumar and Karim2003). Higher total N and TCAP-N in G2 and G3 compared with those in G0 was due to higher input of feed N from concentrates rich in CP compared with roughages. Contrary to this, a non-significant alteration in TVFA and a decrease in rumen NH3-N with high-concentrate feeding are considered positive rumen attributes indicative of better energy and protein utilization (Fox et al., Reference Fox, Barry, Pitt, Roseler and Stone1995; Cannas et al., Reference Cannas, Tedeschi, Fox, Pell and Van Soest2004). Availability of readily available energy (carbohydrates) from high-concentrate feeding may thus have entrapped NH3-N and carbon skeleton from VFA resulting in increased microbial protein synthesis as evidenced from higher TCAP-N. A positive rumen fermentation attributes was not reflected in serum glucose concentration, although it was relatively higher in G3 fed with ad libitum concentrate, which may be attributed to higher concentrate/roughage ratio (Table 2). An improvement in haemoglobin level was indicative of improvement in body condition of cull ewes in response to re-alimentation.
An increased intake and digestibility of nutrients in concentrate-fed groups reflected higher LWG compared with only roughage-fed group (control). The ME value of the diet (MJ/kg DM) increased from 8.77 (G0) to 9.70 (G2) and 9.74 (G3) due to higher allowance of concentrate in the total diet. Thus, the animals under G2 and G3 with higher DMI had access to higher DOM and ME intakes. The animals in G2 and G3 with ME intake (MJ/kg W0.75) of 973 and 953 supported the additional gain in mature and cull ewes and improved BCS. The control animals, although showing an initial improvement in BCS as assessed at middle (45 days) of re-alimentation could not sustain further ‘indicating insufficiency in nutritional support based on complete roughage diet’. Concentrate feeding has been reported to promote rapid growth of sheep and cattle (McDonald et al., Reference McDonald, Edward, Greenhalgh and Morgan1996) through an increased efficiency of utilization of dietary energy for BW gain (Mandebvu and Galbraith, Reference Mandebvu and Galbraith1999). Periodic alteration in LW showed a continuous increase in LW in G2 and G3 groups, but G2 maintained superiority and a clear shift in the growth curve compared with G3 during the entire period of re-alimentation (Figure 1). In the same line, BCS of animals in G2 showed a continuous increase compared with a subsequent decline in G3. Thus, an increase in LWG and BCS in G2 may be attributed to better nutrient availability or economic usage of nutrients suggesting that concentrate supplementation at 2.5% BW is more preferred over ad libitum feeding for maximizing performance in culled ewes. While evaluating the fattening performance in terms of carcass quality a relatively better dressing and lean meat yield, LEA and a lower SFV was indicative of better protein accretion during re-alimentation that exhibited in the output of LWG compared with animals in other groups, more specifically ad libitum concentrate fed G3. A decrease in SFV of carcass in G2 and G3 can be related to meat tenderness (Skiba, Reference Skiba2010). He studied influence of re-alimentation after a period of protein and energy restriction on meat tenderness and found a lower SFV in re-alimented pigs. He also observed largest improvement in meat tenderness in the short period after the change from restriction to re-alimentation and related it to compensatory growth curve. In this study, the growth curve during the 90-day re-alimentation period in association with change in BCS suggested a steady compensatory gain in G2 compared with other dietary groups. Therefore, a decrease in SFV and an increase in protein/fat ratio may contribute to increase tenderness of meat from animals in G2 compared with other animals. Moreover, the composition of LD muscle revealed more protein and a lower protein/fat ratio in support of better carcass quality. Carcass tissues also vary to the extent of time taken to restore normal proportions during re-feeding. Protein deposition tends to be higher during the initial stages of compensation while the restoration of carcass fat takes longer (Hood and Thornton, Reference Hood and Thornton1980). An increase in SIF in concentrate fed groups was due to conversion of extra energy in to energy-dense fat. However, even with relatively higher carcass fat content the feed conversion efficiency (FCE) was better in ewes fed with high concentrate indicating that the carcass tissue accretion was in terms of lean content thereby increasing the protein/fat ratio and hence relatively higher fat deposition did not influence the FCE. Karim et al. (Reference Karim, Tripathi and Singh2007) observed improved FCE in lambs under cafeteria system of feeding management (ad libitum concentrate) with a carcass of desired quality thus rendering the production system suitable for commercial application. Dikmen et al. (Reference Dikmen, Ustuner, Turkmen and Ogan2009) was also of the view that a better FCE might help to decrease the feed expenses for fattening. The rate of mobilization of body fat is usually reflected in the plasma concentration of free fatty acids, that is, an increase in the plasma concentration of free fatty acids usually indicates increased lipid mobilization. The higher level of cholesterol and free fatty acids in the serum of control animals was thus indicative of undernutrition (nutritional stress). Chilliard et al. (Reference Chilliard, Bocquier and Doreau1998) also reported decreased NEFA and increased glucose at higher levels of concentrate feeding in ewes. The concentrate/roughage ratio of 55.6 : 44.4 in G2 as against 64.5 : 35.5 in G3 might have provided a relatively better ruminal environment resulting in better nutrient economy, as it was reflected in G2 with superiority in performance (average daily gain, FCE, carcass attributes). The findings were ably supported by an increased efficiency of gain involving harness of relatively higher LWG from less feed and ME intakes (Table 5). Glimp et al. (Reference Glimp, Steven and David1989) also attributed a better concentrate – roughage combination for an increased performance in moderate concentrate fed groups (72.5% and 90%) compared to concentrate all (100%) diet. Similarly, in an experiment with weaner lambs on ad libitum concentrate feeding (82%), Tripathi et al. (Reference Tripathi, Chaturvedi, Karim, Singh and Sisodiya2007) observed improved daily gain and feed efficiency with lower ME intake per unit gain. It is quite clear that higher level of concentrate feeding improved performance of cull ewes; however, economics of higher LWG should be looked into in a locality by considering the prices of feed and animals so as to ensure better cost : benefit ratio. A better input : output ratio may thus be considered optimum for strategic supplementary feeding of cull ewes with an aim to improve its carcass quality and market value.
In conclusion, this study suggested that re-alimentation of spent ewes with challenge feeding of concentrate improved the body condition and LW gain by enhancing nutrients’ intake (protein and energy) and its digestibility from an improved rumen environment. A higher efficiency of feed conversion to mutton production with additional improvement in carcass traits further economizes the high level of concentrate supplementation. Comparatively better performance with a good BCS in animals supplemented with concentrate at 2.5% of LW than ad libitum feeding in this 90-day re-alimentation period may be considered an economic and market-driven strategy. However, further evaluation with finished meat and allied products may supplement the present findings for better economic return from cull ewes/rams to the livestock farmers.