I. INTRODUCTION
MRI is a complementary modality for molecular imaging as it provides the images with high spatial resolution and anatomical details. This noninvasive diagnosis technology is relatively harmless to human body as compared with x-ray tomography and positron emission tomography (PET). MRI contrast agent has extensively been used to improve the visibility and enhance the contrast of internal body structures. The most common T 1-weighted MRI contrast agents are gadolinium-based compounds. Low molecular weight gadolinium chelates such as gadopentetate dimeglumine (Gd-DTPA) and gadoterate meglumine (Gd-DOTA) are current clinically available Gd (III)-based contrast agents. But these contrast agents are characterized by rapid excretion and short blood circulation time. Thus, a large amount of such small molecule contrast agents are needed to finish the MRI scan. Furthermore, it is believed that gadolinium chelates internalized in cells may lead to the leaching of Gd3+ ions, which is responsible for nephrogenic systemic fibrosis (NSF) in patients. Reference Reynolds, Annan, Beshah, Huber, Shaber, Lenkinski and Wortman1,Reference Lee, Chang and Kim2 Thus, more effective contrast agents with low intake dose, such as gadolinium oxide nanoparticles, are promising.
Much research has been done on gadolinium oxide in the literature because it is more stable than Gd chelates and the surface Gd (III) ions, which are very close to the surrounding protons, provide an r 1 relaxivity of 3–5 s−1mM−1. Reference Park, Baek, Choi, Woo, Kim, Kim, Jung, Chae, Chang and Lee3 For example, ultrasmall gadolinium oxide nanoparticles were utilized to image mice brain cancer cells in vivo. However, due to the large specific surface area, these nanoparticles tended to aggregate over time in aqueous medium. Reference Burnett, Wolf, Shumacher and Goldstein4 Faucher et al. provided a comprehensive investigation on the relationship between aggregation and relaxivity based on aqueous suspensions of DEG-covered gadolinium oxide nanoparticles. Reference Faucher, Gossuin, Hocq and Fortin5 The r 1 values at different frequencies decreased in the presence of aggregation, suggesting that the self-aggregation of hydrophilic Gd2O3 suppressed the T 1 effect of the Gd species. Reference Bridot, Faure, Laurent, Riviere, Billotey, Hiba, Janier, Josserand, Coll, Vander Elst, Muller, Roux, Perriat and Tillement6 Hence, it would be favorable to encapsulate the Gd2O3 nanoparticles into a carrier, in which the nanoparticles are fixed in position and separated with each other. Mesoporous silica nanospheres (MSNs) have been firstly utilized as carriers for Gd2O3 nanoparticles by Taylor et al. Reference Taylor, Kim, Rieter, An, Lin and Lin7 However, the contact between water molecule and the nanoparticles in such composites was not ideal due to the thick silica shell. Reference Kim, Momin, Choi, Yuan, Zaidi, Kim, Park, Lee, McMahon, Quinones-Hinojosa, Bulte, Hyeon and Gilad8 Low molecular weight dendrimers and liposomes were also selected as the potential carriers. Reference Kobayashi, Kawamoto, Saga, Sato, Ishimori, Konishi, Ono, Togashi and Brechbiel9,Reference Kobayashi, Kawamoto, Bernardo, Brechbiel, Knopp and Choyke10 However, the aggregation between the nanoparticles could not be suppressed using these low molecular weight polymers due to the cross-linking effect. Therefore, novel macromolecules, with a molecular weight >30 kD, are highly desirable as the carriers for Gd2O3 nanoparticles. Reference Fortin, Petoral, Soderlind, Klasson, Engstrom, Veres, Kall and Uvdal11–Reference Cheung, Alvares, Oakden, Chaudhary, Hill, Pichaandi, Mo, Yip, Macdonald, Stanisz, van Veggel and Prosser14 Recently, amphiphilic poly(ethylene glycol) diglycidyl-grafted poly(maleic anhydride-alt-octadecene) (PMAO-g-PEG) based macromolecular platforms have been reported to be the effective carriers for quantum dots and upconversion particles. Reference Fortin, Petoral, Soderlind, Klasson, Engstrom, Veres, Kall and Uvdal11
Herein, we proposed to load paramagnetic gadolinium oxide nanoplates in PMAO-g-PEG nanogel to form Gd2O3 nanoclusters (GNCs) as T 1-weighted MRI contrast agents. The nanogel not only formed a protective coating over Gd2O3 nanoplates, but also held water around the nanoplates. The procedures for the formation of GNCs involved a facile combination of nanoemulsion and solvent evaporation. The polymeric material chosen for the formation of the nanogel was an amphiphilic brush copolymer that was obtained by grafting PEG to PMAO. The resultant brush-structured copolymer was amphiphilic and highly versatile. It was also possible to graft additional functionalities, such as fluorescein, to confer photoluminescent properties. As such, the GNCs were investigated in detail and its characteristics were analyzed according to morphology, particle size, composition, colloidal stability, magnetic properties, and MR sensitivity. The maximum r 1 value of 7.948 s−1mM−1, which was 2.23 times higher than that of Gd-DOTA, and the r 2/r 1 ratio of 1.04 were achieved. The cytotoxicity test on NIH-3T3 cells proved that the GNCs were relatively safe for bioapplications.
II. EXPERIMENT
A. Materials
Cetyltrimethylammonium bromide (CTAB) (99%) from Fisons, and poly(maleic anhydride-alt-1-octadecene) (PMAO, powder, Mn = 30,000–50,000) sodium oleate (powder, ≥99%), gadolinium (III) chloride hexahydrate (powder, 99%), poly(ethylene glycol) (PEG, powder, Mn = 2000), oleic acid (liquid, 99.99%), 1,2-hexadecanediol (powder, 90%), and trioctylamine (liquid, 98%) were purchased from Sigma-Aldrich. All chemicals were used as received.
B. Synthesis of PMAO-g-PEG
The functional amphiphilic copolymer was synthesized by grafting PMAO with PEG following the publication of Yu et al. Reference Yu, Chang, Sayes, Drezek and Colvin15 PMAO (3 g sigma 419117) and PEG (2.25 g sigma 295906) were mixed in THF (20 mL), wherein PMAO was initially insoluble. The reaction flask was then heated to 80 °C to ensure the complete reaction. In the presence of concentrated hydrochloric acid (37 wt%), the reaction mixture was incubated over 24 h to ensure complete reaction. After the sample has been cooled down to room temperature, the mixture was neutralized with sodium hydroxide. Subsequently, the mixture was precipitated using excess acetonitrile and collected by centrifugation. The final product was extracted by solvent evaporation and then dried in vacuum at room temperature for 2 days to obtain a white powder. In this process, approximately 16.7% of the maleic anhydride rings in PMAO has been grafted with PEG through esterification process.
C. Synthesis of 10 nm core Gd2O3 nanoplates
Oleate decomposition method was used. For the synthesis of gadolinium oleate, gadolinium (III) chloride hexahydrate (2 mM), sodium oleate (6 mM), ethanol (4 mL), deionized (DI) water (3 mL), and hexane (7 mL) were mixed and heated in a round-bottomed flask to 70 °C for 4 h, while stirring continuously. The upper organic layer containing the Gd oleate complex was collected and then washed with 30 mL of distilled water several times and dried overnight at room temperature to evaporate water and hexane. The waxy Gd oleate obtained after drying was mixed with 20 mL of trioctylamine, 0.3 g of 1,2-hexadecanediol, and appropriate oleic acid according to different conditions in a three neck flask. The reaction flask was purged with nitrogen gas for 15 min prior to reaction. The temperature was then raised to 100 °C for 1 h to completely remove the water. The solution was then heated to 380 °C at a rate of 10 °C min−1 under the blanket of N2. Bubbles appeared and the suspension was cooled 10 min later and washed by repeated dispersion and precipitation using toluene and ethanol, respectively. The final product was dispersed completely in chloroform (50 mg mL−1) and the resultant liquid was sealed in a glass vial for storage.
D. Preparation of GNCs
The formation of GNCs was obtained from solvent evaporation. Individual stock solutions of PMAO-g-PEG and Gd2O3 dissolved in chloroform were prepared. Predetermined amounts of polymer and Gd2O3 stock solutions were mixed together and then emulsified with water (10 times volume with 1 wt% PVA as a stabilizer) using an ultrasonic homogenizer (SONICS VCX 130 PB, Vibra-Cell™ VCX130PB, Sonics & Materials, Inc.) at 20 kHz frequency and 60% amplitude for 5 min. The emulsion was then heated at 60 °C in an open glass beaker under rapid stirring to allow the chloroform to evaporate. All samples in this report were prepared with a fixed amount of polymer stock solution (20 mg mL−1), while varying the amounts of Gd2O3 injected. The as-prepared colloids firstly underwent centrifugation at 2000 rpm for 10 min to remove unusually large aggregates. The colloid was then purified by centrifugation at 8000 rpm for 10 min for complete separation of the GNCs, which were then redispersed in water/methanol (50:50). Purification was repeated at least twice before the GNCs were finally redispersed in water or appropriate aqueous medium. Final products were dialyzed against Millipore water for days in a dialysis membrane (molecular weight cut-off = 20 kDa). The products within dialysis membrane were retained for further studies.
E. Phase transfer of hydrophobic Gd2O3 nanoplates
The hydrophobic Gd2O3 nanoplates were phase-transferred to water using CTAB as a surfactant. To achieve monodispersed nanoplates, 1 mL solution of chloroform containing 10 mg of Gd2O3 nanoplates was added to 5 mL 0.25 M CTAB solution. After vigorous vortex and sonification for 40 min, the opaque solution became semitransparent gel. The gel was then heated to 70 °C to evaporate the chloroform, leaving a transparent light white solution. To purify colloid solution of Gd2O3, the reactants were dialyzed against Millipore water for 3 days in a dialysis sac (molecular weight cut-off = 20 kDa).
F. Magnetic relativity measurements
To evaluate the potential application of the GNCs as MRI contrast agents, magnetic relaxivities were measured in a 3T clinical MRI instrument (Siemens Magnetom Trio, Siemens, Germany) equipped with a head coil. T 1 and T 2 relaxation times were measured for samples with varying Gd concentrations. T 1-weighted images were obtained with spin echo sequences using multiple TRs (TE: 9.1 ms, TR: 6400–100 ms). T 2-weighted images were obtained by single echo pulse sequences (6 echoes; TE: 9.1–160 ms, TR: 1600 ms). All measurements were performed at room temperature. Relaxation rates of each sample were computed using in-house software (MATLAB ver7.1) by nonlinear least squares fitting of appropriate exponential functions (exponential decay and saturation recovery for T 1 and T 2, respectively). Relaxivities were calculated using linear regression analysis (Microsoft EXCEL) to correlate relaxation rates and molar Gd concentrations.
G. Cellular labeling
To assess the potential of GNCs as optical labeling agents, NIH/3T3 cells were used as a model for study. NIH/3T3 cells were incubated in an 8-well plate at 37 °C and 5% CO2 environment. After 24 h, the GNCs (10 mL, 40 mg mL−1) were injected into each well. The particles were then incubated for further 24 h. The cell samples were washed to remove free particles and then observed using an Olympus Ix2-DSU disk scanning confocal microscope.
H. Materials characterization
X-ray diffractometry (XRD) was carried out using an advanced diffractometer system (D8 Advance Diffractometer System, Bruker, Karlsruhe, Germany). All transmission electron microscopy (TEM) images were obtained using JEOL 100CX instrument (200 kV; JEOL, Tokyo, Japan). Samples were prepared by dipping carbon-coated copper grids into the sample solution followed by drying at room temperature. The chemical structure of the functional brush copolymer was verified using FTIR and 1H NMR. FTIR spectra were recorded on a Varian 3100 FTIR (Excalibur series, Varian, Inc., Palo Alto, CA) spectrophotometer. 1H NMR was performed with a Bruker DPX300 NMR spectrometer at 300 MHz. Chemical shifts were analyzed by referencing to the solvent peak (δ = 7.28 ppm for CDCl3). Gd2O3-loading was determined using thermogravimetric analysis (TGA) SDTQ600 instrument (TA Instruments, New Castle, DE). Magnetic properties of the Gd2O3 and GNCs were characterized by a LakeShore Model 7407 vibrating sample magnetometer (VSM; Lake Shore Cryotronics, Inc.). The hydrodynamic diameters of the particles were measured using a Malvern Zetasizer Nano-ZS (Malvern Instruments, Malvern, Worcestershire, U.K.). Samples were equilibrated at 37 °C for 1 min before measurement and 5 sets of measurements were taken. Gd concentrations of MRI samples were determined by ICP analysis using a Perkin-Elmer Dualview Optima 5300 DV ICP-OES system (PerkinElmer, Inc., Waltham, MA).
III. RESULTS AND DISCUSSION
A. Synthesis of hydrophobic Gd2O3 nanoparticles
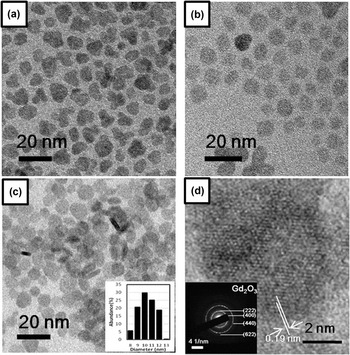
The plate shape of Gd2O3 is much preferred for T 1 effect due to its large surface area exposed to water. Reference Cao16,Reference Paek, Lee, Choi, Choi, Kim, Lee and Lee17 To prepare Gd2O3 nanoplates, gadolinium oleate was thermally decomposed in the presence of oleic acid which acted as an effective morphology controller. Reference Mahajan and Dickerson18–Reference Das, Heng, Ng, White, Loo, D'Silva, Padmanabhan, Bhakoo, Selvan and Tan21 Figures 1(a)–1(c) showed the Gd2O3 nanoplates obtained in the presence of different amounts of oleic acid, i.e., 0, 1, and 2 µL, respectively. Without adding oleic acid (OA), the obtained nanoplates were irregular in morphology and had a large size distribution as shown in Fig. 1(a). Upon adding 1 µL of oleic acid, it was observed that the obtained nanoplates tended to be more regular in morphology. Figure 1(c) showed the TEM images of the Gd2O3 nanoplates when the oleic acid amount was increased to 2 µL. In this 2-D TEM image, two types of particle morphologies, rod shaped and round shaped, were observed. It was believed that the rod shaped image was actually the projection of the standing nanoplates, suggesting the successful formation of nanoplates. The inset of Figure 1(c) showed that the size distribution of the as-synthesized particles was from 8 to 13 nm. The high-resolution TEM image, shown in Fig. 1(d), revealed the crystalline fringes of cubic crystal group with lattice spacing of 0.19 nm, which was characteristic of vector <101> of Gd2O3, corresponding to the (222) facet. The inset of Figure 1(d) showed the selected area electron diffraction (SAED) pattern, from which the diffraction rings were referenced to the characteristic lattice planes {222} and {440} of Gd2O3. The crystal structure of the obtained Gd2O3 nanoplates was characterized using XRD, as shown in Fig. S1. All the XRD peaks could match the standard XRD patterns of cubic Gd2O3 (JCPDF card number is 11-0604). To further characterize the plates in Fig. 1(c), high-resolution TEM microscopy of particles in different morphologies was conducted, which is given in Fig. S2.
TEM images of Gd2O3 synthesized with different amounts of oleic acid, e.g., (a) 0 µL, (b) 1 µL, and (c) 2 µL; the inset of (c): DLS size distribution of Gd2O3, maximum intensity is 30%. (d) High-resolution TEM image of Gd2O3 nanoplate (Inset: SAED of Gd2O3 nanoplate labeled with corresponding rings).

B. Synthesis and characterization of PMAO-g-PEG
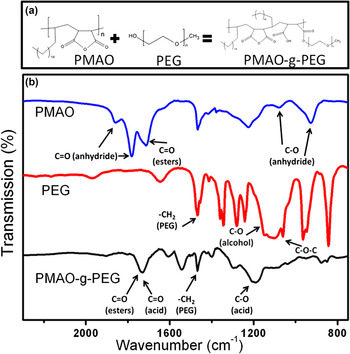
Conveniently, the presence of the versatile succinic-anhydride functional groups on PMAO allowed it to be modified with other water soluble functional groups (more hydrophilic) such as polyethylene glycol (PEG). Such modification could proceed through the chemical functionalization of the succinic anhydride with amine (amide formation) and hydroxyl (esterification) functional groups. Since directly tuning the hydrophilicity of PMAO would reduce the overall hydrodynamic size of the oil-in-water droplet, PEG with the hydroxyl group was chosen to be conjugated to PMAO to increase the hydrophilic–lipophilic balance (HLB) value of the polymer as shown in the reaction scheme of Fig. 2. The FTIR results successfully verified the formation of PMAO-g-PEG (spectra in Fig. 2). For PMAO, the characteristic absorption peaks at 1784 cm−1 and 1865 cm−1 represent the succinic anhydride C=O symmetric and asymmetric stretching, respectively. After PEG grafting, the peaks at 1784 cm−1 and 1865 cm−1 diminished, and more carboxylic acids were formed, reflecting from the carboxylic acid C=O stretching at 1717 cm−1. The esterification reaction between the carboxylic acids (from PMAO anhydride rings) with the hydroxyl group (from PEG) was confirmed from the ester bond formation at around 1700–1730 cm−1, in which the ester C=O stretching vibrations overlapped with the carboxylic acid C=O stretching vibrations. These indicated the hydrolysis of the anhydride and the formation of the carboxylate and ester carbonyl. To further confirm the presence of PEG after PEGylation, 1H-NMR spectroscopy was also conducted on PMAO-g-PEG samples suspended in CDCl3. The 1H NMR-spectra of PMAO-g-PEG result are given in Fig. S3.
Reaction scheme and FTIR spectra of PMAO-g-PEG. (a) For grafting poly(maleic anhydride-alt-1-octadecene) (or PMAO) with polyethylene glycol (PEG), facile acid catalyzed esterification reaction was performed. (b) The FTIR spectra of PMAO, PEG (Mn = 2000), and PMAO-g-PEG are indicated by blue, red, and black curves, respectively.

C. Preparation of GNCs
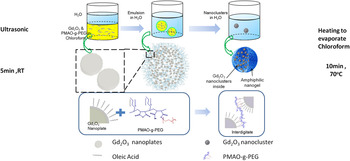
A combination of nanoemulsion and solvent evaporation techniques was used to form Gd2O3 nanoclusters (GNCs). Figure 3 showed the schematic illustration of GNCs formation via this procedure. First, PMAO-g-PEG and Gd2O3 nanoplates were dissolved in chloroform. The obtained solution was then mixed with water using PVA as a stabilizer. And then ultrasonication was applied at room temperature. Small oil droplets were formed as depicted in Fig. 3, in which Gd2O3 nanoplates were surrounded with PMAO-g-PEG. As PMAO-g-PEG possessed hydrophobic backbone and many side chains in a brush-like structure, the copolymer could act as a very effective binding material for the nanoplates. After the solvent evaporation, stable spheres of PMAO-g-PEG and Gd2O3 could be formed due to strong interdigitated hydrophobic interactions between the alkyl chains of PMAO-g-PEG and oleic acid ligands of Gd2O3 nanoplates.
Schematic illustration of procedure for synthesizing Gd2O3 nanoclusters with amphiphilic PMAO-g-PEG using nanoemulsion/solvent evaporation technique.

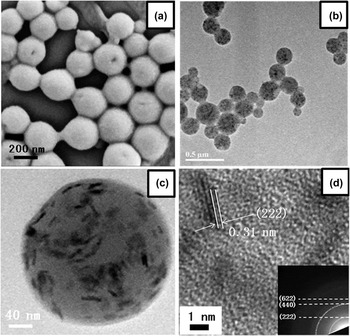
SEM image of the obtained GNCs is shown in Fig. 4(a). The GNCs were spherical and uniform in size, i.e., 250 ± 15 nm estimated from measuring 100 particles. It was also observed that there was no individual Gd2O3 nanoplate outside the nanoclusters. Figure 4(b) showed the TEM image of the obtained nanoclusters. Each cluster contained black dots inside, indicating that Gd2O3 nanoplates had been successfully encapsulated and well protected. Additionally, Fig. 4(c) showed the TEM image of a single nanocluster at high magnification. The Gd2O3 nanoplates were seen as obvious dark spots embedded in the low contrast nanogel matrix. Dark spots with various and clear outlines, such as plate shape, rod shape, and round shape, could be ascribed to different orientations of the Gd2O3 nanoplates, confirming that the Gd2O3 nanoplates were randomly and evenly embedded in the nanogel without obvious aggregation. Figure 4(d) displayed a high-resolution TEM image, which illustrated more details of the Gd2O3 nanoplates embedded in the nanogel matrix. Rod-shape shadow, corresponding to the side facet, exhibited lattice spacing of 0.31 nm which was similar to that of Gd2O3 (222). The inset showed the SAED pattern from which the diffraction rings were referenced to the characteristic lattice planes (222) and (440) of Gd2O3.
(a) SEM image of GNCs at low magnification; (b) TEM image of GNCs; (c) a single GNC with a sphere outline and monodispersive nanoplates inside (d) high-resolution TEM image of GNCs (inset: SAED ring patterns of GNCs).

D. Tuning the GNCs loading amount
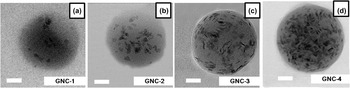
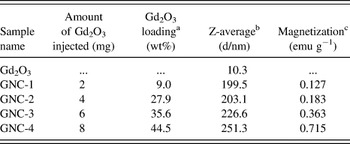
By varying the amount of Gd2O3 added, the loading of Gd2O3 nanoplates in clusters could be well controlled. Four GNC samples with different Gd2O3 loading amounts were thus prepared. The obtained samples were named as GNC-1, GNC-2, GNC-3, and GNC-4 in the order of increasing Gd2O3-loading, as shown in Figs. 5(a)–5(d), respectively. Conclusively, a gradient change in Gd2O3 loading density was observed based on the increase in nanoplates' number from Figs. 5(a)–5(d). Based on TGA measurements (Fig. S4), the precise Gd2O3 loading amounts of GNC-1, GNC-2, GNC-3, and GNC-4 were 9, 27.9, 35.6, and 44.5 wt%, respectively. From the VSM data shown in Fig. S5, the paramagnetic properties of the GNCs were preserved and altered by adjusting the loading amounts. The magnetization at 20 kG was increased gradually from GNC-1 to GNC-4, which were 0.127, 0.183, 0.363, and 0.715 emu g−1, respectively. To determine whether the linear relationship between magnetization (at 20 kG) and loading amounts in the four given samples was valid, the magnetizations of GNCs were plotted against the Gd2O3 core weight percentage, as shown in Fig. S5(b). The linear slope indicated that no deviation from a linear behavior occurred. By using DLS, Z-average sizes of the GNC-1, GNC-2, GNC-3, and GNC-4 were determined as 199.5, 203.1, 226.6, and 251.3 nm, respectively. The Z-average size of the Gd2O3 nanoplates was measured as 10.3 nm. The relevant physical characteristic parameters are listed in Table I.
(a)–(d) TEM images of GNCs prepared with various loadings of Gd2O3, labeled as GNC-1 to GNC-4 correspondingly. Scale bar: 50 nm. GNC-1, GNC-2, GNC-3, and GNC-4 have loading percents of 9, 27.9, 35.6, and 44.5 wt%, respectively.

Summary of physical characteristic parameters.

a Weight percentage of Gd2O3 in GNCs as determined using TGA.
b Z-average size values measured using a Zetasizer DLS.
c Magnetizations of GNCs measured using VSM at 20 kG.
E. GNCs MR relaxivity test
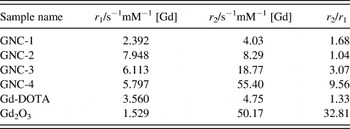
Table II recorded r 1, r 2, and r 2/r 1 ratio results calculated from the slopes of the linear plots of relaxation rates (1/T 1 and 1/T 2, respectively) against gadolinium concentration [Gd]. GNC-1, the initial cluster with loading of 9 wt%, possessed the r 1 and r 2 values of 2.392 s−1mM−1 [Gd] and 4.03 s−1mM−1 [Gd], respectively. By increasing the loading amount of Gd2O3 to 27.9 wt%, GNC-2 sample exhibited an r 1 value of 7.948 s−1mM−1, which was 2.23 times higher than that of the commercial contrast agent gadolinium-tetraazacyclododecane tetraacetic acid (Gd-DOTA) (r 1 = 3.56 s−1mM−1 [Gd]). The r 2 value of GNC-2 sample was also increased to be 8.29 s−1mM−1 [Gd] because of the aggregation effect of Gd2O3 in GNC-2. However, the r 2/r 1 ratio of GNC-2 sample was as small as 1.04, showing its very promising r 1 effect. Moreover, it was found that GNC-3 and GNC-4 samples with higher loading amounts of Gd2O3 did not show further increase in r 1 value as compared with GNC-2. The r 1 values of GNC-3 and GNC-4 were slightly decreased to 6.113 s−1mM−1 [Gd] and 5.797 s−1mM−1 [Gd], respectively. Considering the loading of 35.6 wt% and 44.5 wt% for GNC-3 and GNC-4, respectively, the Gd2O3 nanoplates in these clusters were aggregated together, which suppressed the T 1 effect of the Gd species. Reference Faucher, Gossuin, Hocq and Fortin5 Besides, all GNC samples showed better r 1 values than that of the Gd2O3 nanoplates (r 1 = 1.529 s−1mM−1 [Gd]).
Summary of magnetic resonance relaxivities in a clinical magnet (3T).

F. Cellular cytotoxicity and colloidal stability tests
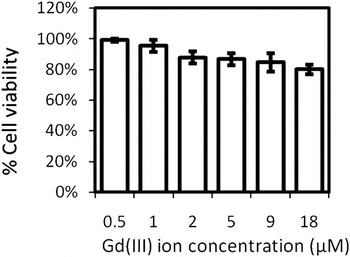
To validate GNC for biological applications, the in vitro cytotoxicity of the GNC-4 sample was conducted, as shown in Fig. 6. No marked cell death or proliferation defects were observed with NIH-3T3 cell lines cultured with GNC-4 sample even at the concentration of 18 µM. It showed that the PMAO-g-PEG coated gadolinium oxide nanoplates were not toxic for the tested concentration range of Gd (III) ion. To further investigate the loading of Gd ions of the GNC samples, dialysis procedure (24 h) was applied. No Gd species were detected in the dialysate solutions for all samples, e.g., GNC-1, GNC-2, GNC-3, and GNC-4 according to ICP results at the concentration of 1 mM (data not shown here).
MTT assay of NIH/3T3 cell lines incubated with different amounts of GNC-4 for 24 h.

G. MR weighted images of GNCs and in vitro study
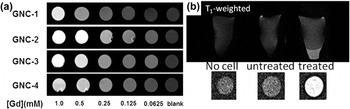
Figure 7 showed the T 1-weighted MR images of GNC-1, GNC-2, GNC-3, and GNC-4, respectively. All the samples exhibited a T 1 enhancement effect as seen by the observed reduction in signal intensities with respect to [Gd]. Among four samples, GNC-2 showed the brightest images at all concentrations among the four samples, which agreed with the r 1 values listed in Table II. Figure 8(b) showed T 1-weighted MR image of NIH/3T3 cells in agarose phantoms. The control blank cell samples without incubating with GNC-2 sample exhibited little contrast difference comparing with the pure agarose. With strong T 1 effect of GNC-2, the labeled cell samples could be clearly observed. This result provided clear evidence for potential in vitro application, and paves path to the in vivo application of the GNC samples.
(a) T 1-weighted MR images of various nanocluster samples for different Gd concentrations at 25 °C. (b) T 1-weighted MR images demonstrated the in vitro label of NIH-3T3 cells. The cells were incubated in the media with GNC-2 at 50 μg mL−1 for 2 h.

(a) DLS intensity-weighted size measurements of GNC-4 in Millipore water, PBS, and serum solution up to 10 days. The PBS consists of blue line (pH = 4) and purple line (pH = 10), respectively. (b) Relaxation rates (both 1/T
1 and 1/T
2) as a function of Gd3+ concentration [Gd] of GNC-4 before (×) and after (
 $\nabla$
) being left standing in a 3T magnet for 24 h. T
1 obtained using the CPMG spin-echo sequence and T
2 values were obtained using the CPMG spin-echo sequence (32 echoes; TE: 9.2 ms, TR: 3000 ms).

The stability of the aqueous suspension of GNC-4 sample was monitored by dynamic light scattering, as shown in Fig. 8(a). Preliminary studies showed that the GNC-4 sample exhibited excellent colloidal stability in both water and PBS. There were no obvious precipitations at pH = 4 [blue curve in Fig. 8(a)] and pH = 10 [purple curve in Fig. 8(a)] after 10 days of incubation at 37 °C. There was no observable aggregation of the sample after 10 days, and the final size of the sample was around 250 nm, which was consistent with the observation in TEM. When the GNC-4 sample was dispersed in serum solution, a little increase in size was observed, which was due to scattering of the slight adsorption of proteins. These results showed that PMAO-g-PEG served as a good biocompatible platform in bioenvironment. Another test was performed by leaving the sample solutions to stand inside a MRI clinical magnet. At first, T 2 measurements were acquired, followed by leaving the samples in the magnet for 24 h, and then the second set of MRI measurements was applied. Figure 8(b) showed relaxation rates (both 1/T 1 and 1/T 2) as a function of Gd3+ concentration [Gd] of GNC-4 at 0 h and 24 h, respectively. Both r 1 and r 2 values of the sample remained nearly unchanged after 24 h period. This implied that there was no appreciable agglomeration of the GNCs in the solution even in a strong magnetic field.
IV. CONCLUSIONS
In summary, we demonstrated a facile method for fabricating nanoclusters of Gd2O3 with enhanced T 1 effect. It was found that such protection not only helps the Gd2O3 to broaden its application in a wide pH range, but also avoids further aggregation. A relationship was demonstrated to exist between loading and r 1 per single cluster as derived from the experimental data. The GNCs possessed high r 1 values (maximum is 7.948 s−1mM−1 [Gd]) and low r 2/r 1 (minimum is 1.04). For all of the Gd loadings, polymer nanogel platform materials provide higher longitudinal relaxometric parameters than the monodispersed individual Gd2O3 and, consequently, could be more effective as contrast agents than Gd2O3-based counterparts. In vitro test was demonstrated in NIT/3T3 cell lines, and clear T 1-weight images are obtained. Thus, the PMAO-g-PEG assisted GNCs are potentially useful for magnetic-guided and magnetic-assisted delivery systems. This investigation suggests a key technological design that can be applied for enhancing T 1 relaxivities to current MRI contrast agents.
Supplementary Material
To view supplementary material for this article, please visit http://dx.doi.org/jmr.2014.185.
ACKNOWLEDGMENTS
This work is supported by the MOE's ARF Tier 1 funding WBS R-284-000-102-112 (National University of Singapore, Singapore).