Introduction
Plants have developed a sophisticated, multilayered system to detect pathogens and trigger a strong defence response (Segonzac and Zipfel, Reference Segonzac and Zipfel2011). For example, plants can recognize the invading pathogen through the detection of conserved structural motifs, termed microbe-associated molecular patterns (MAMPs). Well-studied examples of MAMPs include chitin, flagellin and elongation factor Tu (Monaghan and Zipfel, Reference Monaghan and Zipfel2012). Once MAMPs are detected by specific pattern recognition receptors, which are localized at the plant cell surface, a defence response, termed MAMP-triggered immunity (MTI), is mounted that leads to disease resistance (Monaghan and Zipfel, Reference Monaghan and Zipfel2012).
MTI is characterized by a variety of plant responses, which include changes in ion flux across the membrane, changes in intracellular calcium levels, production of reactive oxygen species and deposition of callose as well as modification of the expression of several genes (Zipfel, Reference Zipfel2009). Although several of these responses can be measured in different plant species, their magnitude is probably plant species specific and even cultivar specific (Valdés-López et al., Reference Valdés-López, Thibivilliers, Qiu, Xu, Nguyen, Libault, Le, Goldberg, Hill, Hartman, Diers and Stacey2011; Veter et al., Reference Veter, Kronholm, He, Häweker, Reymond, Bergelson, Robatzek and de Meaux2012). For example, we have recently demonstrated a significant genotypic variation in the MTI response of four different soybean [Glycine max (L.) Merr] genotypes (Valdés-López et al., Reference Valdés-López, Thibivilliers, Qiu, Xu, Nguyen, Libault, Le, Goldberg, Hill, Hartman, Diers and Stacey2011). Additionally, based on the expression of 25 MAMP-responsive genes, we observed that the progeny inherited the variation in expression demonstrated by the parental lines. These data suggested a genetic basis for the strength of the MTI response that could potentially be exploited to improve soybean agronomic performance. However, these observations were based on a limited number of genes and may not reflect the whole transcriptome response to MAMP elicitation. Therefore, to expand upon the previous study, in the present study, we conducted a genome-wide transcriptome analysis of the parental lines LD00-2817P and LDX01-1-65 (hereafter called LD and LDX, respectively) and two F4 recombinant inbred lines.
Materials and methods
Plant material and MAMP treatment
The soybean genotypes LD and LDX and two of their F4 lines, LD08-11 272 and LD08-11 268 (hereafter called R72 and R68, respectively), were used to contrast their response to 1 μM flg22+50 μg chitin (hereafter called MAMP) elicitation.
High-throughput sequencing and processing of mRNA-seq reads
Twenty-four non-strand-specific mRNA-seq libraries [four genotypes, two treatments (MAMP or Mock) and three replicates] were processed and analysed as described by Schmitz et al. (Reference Schmitz, He, Valdés-López, Trupti, Urich, Nery, Diers, Xu, Stacey and Ecker2013).
Identification of differentially expressed genes
Low-count reads with a total sum < 10 were filtered out before a Poisson linear mixed-effects model (Blekhman et al., Reference Blekhman, Marioni, Zumbo, Stephens and Gilad2010) was applied to the raw read counts separately for each gene with the library size as the offset value. Likelihood ratio tests were conducted to identify differentially expressed genes in the treatment and control groups for each of the four genotypes, as well as in genotypes for either the control or the treatment group. P values for the likelihood ratio tests were obtained and then transformed into q values (Storey and Tibshirani, Reference Storey and Tibshirani2003) to produce lists of differentially expressed genes with an estimated false discovery rate of 5% and with a fold change >2.
Results and discussion
Transcriptional variation between parental and F4 lines in the absence of MAMP treatment
In a previous study, we had demonstrated variations in the oxidative burst triggered by the application of flg22 or chitin between the genotypes LD and LDX (Valdés-López et al., Reference Valdés-López, Thibivilliers, Qiu, Xu, Nguyen, Libault, Le, Goldberg, Hill, Hartman, Diers and Stacey2011). We had also observed that several F4 lines, from a cross between the genotypes LD and LDX, exhibited an oxidative burst that was similar to, higher than or lower than that exhibited by the parental lines. In particular, the F4 lines R72 and R68 exhibited a response that was very similar to that exhibited by either of the parental lines (see online supplementary Fig. S1). Given the differences observed in the oxidative burst response of the parental and progeny lines, we expanded our study by conducting a transcriptome analysis (using mRNA-seq) to compare and contrast the two parental lines and the two F4 lines.
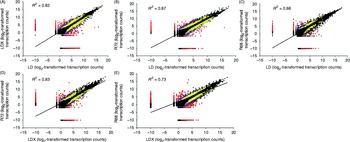
Genotypic variation among different cultivars is the basis for plant breeding and has been successfully used to develop well-adapted, high-yielding crops. Additionally, it has been reported that heterosis affects the mode of gene action by either increasing or decreasing the expression in the progeny (Baranwal et al., Reference Baranwal, Mikkilineni, Zehr, Tiagi and Kapoor2012; Richards et al., Reference Richards, Rosas, Banta, Bhambhra and Purugganan2012). In the case of the four soybean genotypes under study, we first compared variation in basal expression in the absence of any treatment. Although most of the 43,600 expressed genes in this mRNA-seq analysis exhibited similar expression levels in all the four genotypes, a pairwise analysis of the parental lines and F4 lines (i.e. LD vs. R72) did identify several differentially regulated genes (Fig. 1; see online supplementary Table S1). For example, the comparison between LD and LDX genotypes revealed 1258 genes that were differentially regulated in the two parental lines (Fig. 1(A); see online supplementary Table S1). A similar trend was observed in the pairwise comparisons between the parental line LD and the F4 line R72 (1012 differentially regulated genes; Fig. 1(B)) as well as between the parental line LDX and the F4 line R68 (865 differentially regulated genes; Fig. 1(E)). In contrast to these comparisons, the comparisons of LD versus R68 and LDX versus R72 revealed relatively few differences in basal gene expression (Fig. 1(C) and (D); see online supplementary Table S1). A gene functional enrichment analysis using Gene Ontology terms (Du et al., Reference Du, Zhou, Ling, Zhang and Su2010) revealed that programmed cell death, defence response, innate immunity response and response to bacterial infection were the most enriched biological processes identified in either of the pairwise comparisons (see online supplementary Fig. S2 and Table S2). These results indicate a clear genotypic variation in the gene expression levels among the parental and F4 lines.
Pairwise comparisons of transcript abundance between parental lines [LD00-2817P (LD) and LDX01-1-65LD (LDX)] and F4 soybean lines (R72 and R68) under untreated conditions: (A) LD versus LDX; (B) LD versus R72; (C) LD versus R68; (D) LDX versus R72; and (E) LDX versus R68. Black dots indicate 43,600 genes detected in this study; yellow, blue and red dots indicate differentially regulated genes with 2-, 3- or >3-fold change, respectively. Results are the average of three biological replicates. Statistical parameters are given in online supplementary Table S1.

Transcriptome analysis of parental and F4 lines in response to MAMP treatment
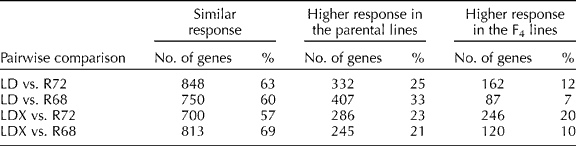
Consistent with previous results, the two parental lines exhibited a number of differentially expressed genes when comparing the untreated and MAMP-treated tissues (see online supplementary Figs S3 and S4 and Table S3). Likewise, similar differences in the two F4 lines were detected when comparing their transcriptomes in a pairwise fashion (R72 vs. LD, R72 vs. LDX, R68 vs. LD, R68 vs. LDX and R68 vs. R72). Across all the four genotypes, a total of 7803 differentially regulated genes were identified. A comparison across the four genotypes revealed that 1525 genes were differentially up-regulated in all the genotypes. Of these 1525 common differentially regulated genes, 1027 were regulated in all the four genotypes. In addition, 169, 168, 298 and 28 genes were specifically up-regulated in the genotypes LD, LDX, R72 and R68, respectively (see online supplementary Fig. S4 and Table S4). Furthermore, to assess whether the two F4 lines exhibited a response that was similar to or different from that exhibited by the parental lines, a pairwise comparison of the fold ratios of the 1725 (including up- and down-regulated) commonly regulated genes was made (Table 1). This comparison revealed that 57–72% of these genes in the F4 lines exhibited a response that was very similar to that exhibited by the parental lines, whereas only 21–33% exhibited smaller changes and 3–20% larger changes in responses when compared with the two parental lines (Table 1). Collectively, these data indicate that approximately 70% of the differentially regulated genes are commonly regulated when comparing the four genotypes.
Pairwise comparison of the fold ratios (microbe-associated molecular pattern/Mock) of the parental lines [LD00-2817P (LD) and LDX01-1-65 (LDX)] and F4 lines (R72 and R68)a

a The percentage in each category represents the genes that exhibited similar or different responses in the parental and F4 lines.
In conclusion, the results of this study demonstrate a clear variation in gene expression, under both untreated and MAMP-treated conditions, across the parental and progeny lines. Similarly, the heritability of the MTI response suggests that specific selection for a strong MTI response, in conjunction with extensive field testing, could be one avenue for developing soybean cultivars with broader and more sustainable disease resistance.
Supplementary material
To view supplementary material for this article, please visit http://dx.doi.org/10.1017/S1479262114000197
Acknowledgements
The authors thank Dr Kiwamu Tanaka and Dr Nicolas Gomez-Hernandez, from the University of Missouri, as well as Professor Gina Hernandez, from CCG-UNAM, Mexico, for their comments on this manuscript.
This study was supported by a grant from the US Department of Energy (DE-FG02-08ER15309) to G.S. and a grant from the United Soybean Board (USB) to G.S. and B.D. R.J.S. was supported by a National Institutes of Health postdoctoral fellowship (K99GM100000). This study was also supported by grants from the Mary K. Chapman Foundation, the National Science Foundation (MCB-0929402 and MCB1122246), the Howard Hughes Medical Institute, and the Gordon and Betty Moore foundation (GBMF3034) to J.R.E. J.R.E. is a HHMI-GBMF Investigator.
Sequence data can be downloaded from the National Center for Biotechnology Information Gene Expression Omnibus (accession GSE43463 for treated RNA-seq data and GSE41753 for untreated RNA-seq data).