

INTRODUCTION
In their efforts to protect natural resources and biodiversity, conservation biologists often face a gap between the need for protection as identified by scientists and the perception of that same need as expressed by the general public (Nabhan Reference Nabhan1995; Miller Reference Miller2005). It has often been assumed that the lack of public engagement in biodiversity conservation is a consequence of education or a lack thereof (Kaplan et al. Reference Kaplan, Kaplan and Ryan1998), yet education programs have not always produced the desired results (Miller Reference Miller2005). Consequently, several studies have attempted to determine which factors influence how biodiversity is perceived, from investigating what people think biodiversity is (Turner-Erfort Reference Turner-Erfort1996), to trying to determine which factors influence how people assess photos showing differing degrees of habitat degradation (Bayne et al. Reference Bayne, Campbell and Haché2012).
Several hypotheses have emerged about factors that might influence perceptions of biodiversity. Several authors, for example, have suggested that urbanization can negatively impact perceptions of biodiversity as people become increasingly disconnected from nature (Miller Reference Miller2005; Schwartz Reference Schwartz2006), and that perceptions will likely differ between inhabitants of cities and rural areas (Heywood Reference Heywood1995; Maiti & Maiti Reference Maiti and Maiti2011). Others have suggested that education (Lindermann-Matthies Reference Lindemann-Matthies2002; Lindermann-Matthies & Bose Reference Dunlap and McCright2008) and political views (Dunlap & McCright Reference Dunlap and McCright2008) can influence how nature is perceived.
Typically, these studies have focused on attitudes towards conservation of species and natural areas, and not necessarily on the extent to which people might or might not differ in their actual perceptions of natural variation (Dallimer et al. Reference Dallimer, Irvine, Skinner, Davies, Rouquette, Maltby, Warren, Armsworth and Gaston2012). This knowledge gap, with respect to individual variation in perception, is important because it has been suggested that human well-being is linked to perceived species richness, but researchers found that most people have poor biodiversity identification skills (McKinney Reference McKinney2002). Acknowledging the finding that most people have generally poor natural history or biodiveristy identification skills, we asked if differing abilities in perception can be predicted based on demographic histories (e.g., education) or opinions expressed about biodiversity. To test perception, we took advantage of the natural visual riddles presented by mimicry among distantly related insects, from which sets of species can be examined that cover a range of similarity, including sets of species that can be readily distinguished, to mimicry complexes that are difficult for biologists to separate.
METHODS
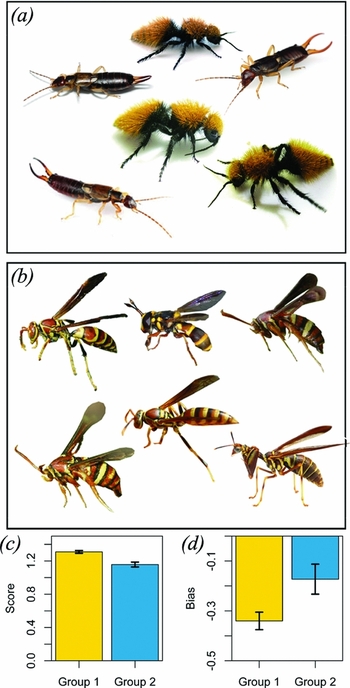
To quantify variation among individuals in the extent to which subtle biological differences can be perceived, we designed an online survey that first presented participants with a series of slides, each slide displaying six images of arthropods. Students were instructed that they would be asked to decide how many kinds of animals (from 1–6) were being shown. We did not ask ‘how many species are there’ because the term ‘species’ can cause confusion, and lacks a universal definition among biologists. After presenting a training slide that showed the correct answers, we presented seven different slides showing a variety of arthropod orders, many of which are mimics of each other (Fig. 1 (a) and (b)). The correct number of species on each of the seven slides ranged from 2–6. The time participants spent on each of these slides was recorded to control for search effort.
(a and b) Examples of slides used in the survey. (a) Shows two species and (b) shows four. Photos courtesy Ron Hemberger, Jean Hort, Valerie Bugh, Paul Turner of Druid Environmental, Peter Bryant, Alex Wild, Flagstaffotos and J.S. Wilson. (c) Graph showing the accuracy (‘score’), that is, how well each group (1 and 2) estimated the number of species. Smaller values indicate better observer performance (in other words, the deviation from the correct answer was less). (d) Graph showing the biases (how much each group over or under estimated the number of species) of the two groups. Both groups underestimated diversity, but group1 had a stronger bias (tended to see fewer species than were actually present).

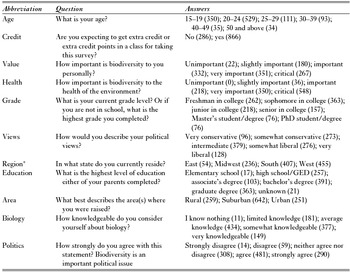
Next, participants were asked a series of survey questions, which included questions about community structure (urban, suburban, rural), state, age, education level, parents' education, knowledge of biology, political views, and three questions measuring participants' feelings toward biodiversity (Table 1). Because not every state was represented, we pooled states into four regions, East, Midwest, South and West. Some participants were offered extra credit by their professors for participating in the survey. To account for potential differences between those receiving credit and others, we included a question asking if the participants expect to receive credit.
Survey questions, and the number of participants giving different answers for each question (the order of questions here follows Table S2). *Individuals answers by state were pooled into regions.

Participants
Survey participants were recruited primarily through college biology classes (both lower division and upper division courses). A link to the survey was provided to instructors and they gave students the option to participate in the survey. Participation was strictly voluntary and all participant data were collected and anonymized using the online survey tools via Qualtrics.com. Survey methodology and recruitment procedures were approved through the Utah State University's institutional review board (Protocol #4671).
Statistical analyses
To address our primary question regarding the capability of survey data to predict the participant's ability to perceive biological variation, we utilized latent class analysis (LCA) to look for structure among participants (i.e., groups of participants with similar survey responses). LCA is analogous to multivariate factor analysis, but appropriate for categorical data. As implemented in R (the poLCA package), LCA can incorporate continuous covariates (in addition to the categorical data) when looking for underlying, latent variables that determine membership in different clusters of (in our case) individuals participating in the survey. We treated all of the answers to survey questions as ordered, categorical data, and we calculated three continuous covariates.
Our primary covariate of interest summarized the extent to which participants were able to correctly perceive the number of species on slides. For every slide, we standardized answers by the correct number of species; thus if the correct answer was four species, and a participant answered three, they received a score of -1 (they underestimated by one). As a measure of accuracy, we took the average of the absolute values of those scores for each individual, which is the average extent to which participants misjudged, regardless of which direction (positive or negative). Secondarily, we quantified an index of bias, which was the same calculation but without taking the absolute value (thus allowing us to look at average over or underestimation). Our third covariate was the average number of seconds that individuals spent on each slide.
Using LCA, we explored the possibility that survey participants could be classified into between one and six groups, and BIC values (as well as delta BIC values) were used to find the optimal number of clusters. Because the model implemented by LCA is relatively complex, we used simple linear models as an accessible and relatively transparent complementary approach. In these models, answers to individual survey questions were used as independent variables predicting performance on slides, while using the average amount of time spent on slides as a covariate for effort. Survey data will be made available through the authors upon request.
RESULTS
A total of 1152 people participated in our survey. Structure in the survey answers and performance on slides was readily determined by LCA, which found two and higher numbers of groupings to be significantly better than no differentiation. Specifically, K=2 appeared to identify end points of a continuum that was then more finely parsed at higher levels of K (Figure S1). Individuals associated with the two groups (at K=2) differed in their answers to survey questions, as well as in their perceptions of natural variation (Fig 1 (c) and (d), and Table S1). On average, group 1 was less accurate, with answers that deviated further from the correct number of species in each slide (Fig. 1 (c)). Both groups tended to underestimate the biodiversity pictured in each slide (i.e., saw fewer species than were actually there), but group 1 estimated lower diversity than group 2 (Fig. 1 (d)). Results from LCA were confirmed with simple linear models that found a significant relationship between most of the survey answers and accuracy (Table S2). It is important to note that (in these models) the average amount of time spent on slides was always a highly significant covariate: people that spent more time on slides tended to get closer to the right answer (Table 1 and Fig. S3). However, what is noteworthy is that while controlling for the amount of time spent on slides, we were able to detect significant relationships between answers to survey questions and performance. While the simple linear models provide a useful confirmation, they are coarse in that they do not account for correlations among variables; thus we focus most of our further discussion on the results from LCA.
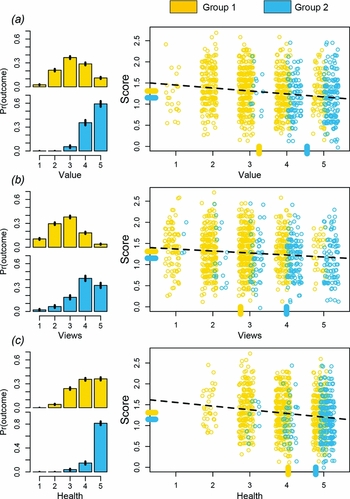
Individuals assigned to groups 1 and 2 differed in a number of ways (Fig. 2, Table 1, and Figure S2 (a) and (b)). Among the survey questions that most strongly delineated groups 1 and 2 were: (1) how strongly individuals valued biodiversity personally (value); (2) if they thought biodiversity was important to the health of the ecosystem (health); (3) their political views on a scale from conservative to liberal (views); (4) the age and grade level of participants (age); and (5) whether or not they expected to receive extra credit for participation (credit) (Table 1, Table S1, and Figure S2 (a) and (b)). How knowledgeable someone considered themselves to be about biology seemed to contribute to group delineation in the LCA analysis, but was not significant in the linear model. Several other survey questions were only weakly associated with the differences between groups 1 and 2, including community structure, region of the country, the education level of parents and if they consider biodiversity a political issue.
Graphs illustrating differences between groups 1 and 2 for three survey questions (group 2 was more accurate and underestimated diversity less than group 1). Bar graphs on the left are results from LCA predicting group traits (shown as relative probabilities, on the y-axes, that a member of a given group would provide a particular answer, on the x-axes, to a particular question). Scatter plots on the right show linear relationships based on raw data, but colour coded to indicate assignment to groups based on the outcome of LCA. (a) How strongly individuals value biodiversity personally with one being unimportant and five being critical; (b) an individual's political views with one being very conservative and five being very liberal; (c) how important people think biodiversity is to the health of the environment with one being unimportant and five being critical. The ‘score’ on the y-axes is the same index as in Fig. 1 (c).

DISCUSSION
Differences in community structure (urban, suburban, rural) have long been targeted as a major factor influencing how humans relate to biodiversity (Dunlap et al. Reference Dunlap, Van Liere, Mertig and Jones2000). At least among the participants of our study, results suggest that urbanization does not necessarily impact perceptions of natural variation. Instead of community background or education, we found that more personal or internal variables are successful predictors of biodiversity perception. These included the value placed on biodiversity and political views. With respect to the latter, political leanings are known to influence views on environmental issues (Dunlap & McCright Reference Dunlap and McCright2008), and we found that self-described liberal-leaning individuals were more accurate in their ability to distinguish among mimetic species relative to self-described conservative-leaning individuals. In sum, these results suggest that liberal-minded individuals place a higher value on biodiversity and are better able to perceive differences among animals that are superficially very similar in appearance. While our results raise this interesting pattern, we do not at this time understand the mechanism linking, for example, political views and perception of biological differences, as discussed further below.
We found that a participant's age and grade level were somewhat related to the accuracy of their biodiversity estimates, with older individuals and upperclassmen (particularly graduate students) being more accurate in their estimates. Interestingly, whether or not an individual expected to receive extra credit for participating in the survey was related to how accurate they were in their assessment of biodiversity (Fig. S2). Those participants that expected credit for participation were often much less accurate in their biodiversity estimates than people that did not expect credit, presumably because those people not working for credit were inherently more interested in the task. This may pose a challenge to educators because it suggests that traditional approaches for generating student interest might fail to truly motivate students to invest the time to arrive at a carefully considered answer, and this could be particularly true of computer based tasks that can be quickly ‘clicked through’ to get to the end. With respect to teaching natural diversity and taxonomy, perhaps educators should focus on appreciation first, possibly through the use of stories and examples of complex and fascinating interactions among species that could later facilitate more traditional lessons.
Aside from grade level, most external demographic factors (e.g., region of the country, community structure (urban/suburban/rural) and parents' education) were not strongly associated with abilities to perceive natural variation. Instead, the factors most strongly associated with accuracy in our survey were those of a more personal and internal nature (e.g., the importance that people place on biodiversity). This poses a challenge to conservationists and educators because it seems that rather than simply educating people about biodiversity and conservation, personal feelings must be affected if we are interested in affecting how biodiversity is perceived and appreciated.
It is important to note that the effect sizes that we have detected are not large: the average difference in accuracy between groups was less than one perceived species (Fig. 1 (c)). However, we believe that the contribution of our study is to point out that personal attributes or background can affect not only attitudes towards biodiversity, as has been documented, but can be associated with actual ability to perceive natural variation. Direction of causality is not clear, as our study was not designed to answer the questions: Are more perceptive people more likely to judge biodiversity as important? Or are people that place a greater value on biodiversity more likely to take the time to perceive differences? Given the general importance of time in our models (people that looked longer tended to get closer to the right answer), we suspect that the latter might be true. Additional studies could potentially include tasks involving non-biological diversity, as the ability to perceive non-biological variation would be informative. With respect to the hypothesis that people that place a higher value on biodiversity are simply more likely to take the time to look closely, we might expect that those same people would not take as much time for non-biological variation. However, at this time we can only pose this issue as a challenge for researchers interested in the intersection between perception, conservation and education.
ACKNOWLEDGEMENTS
We are grateful to those that allowed us to use arthropod photographs, and to the survey participants and to the instructors that made the survey available to their classes. This research received no specific grant from any funding agency, commercial or not-for-profit sectors. The authors assert that all procedures contributing to this work comply with applicable ethical standards of the relevant national and institutional committees on human experimentation and with the Helsinki Declaration of 1975, as revised in 2008.
Supplementary material
To view supplementary material for this article, please visit http://dx.doi.org/10.1017/S037689291600028X