




No CrossRef data available.
A COMPARISON OF COMPLEMENTARY AUTOMATIC MODELING METHODS: RETINA AND PcGets
Published online by Cambridge University Press: 08 February 2005
Abstract
In Perez-Amaral, Gallo, and White (2003, Oxford Bulletin of Economics and Statstics 65, 821–838), the authors proposed an automatic predictive modeling tool called relevant transformation of the inputs network approach (RETINA). It is designed to embody flexibility (using nonlinear transformations of the predictors of interest), selective search within the range of possible models, control of collinearity, out-of-sample forecasting ability, and computational simplicity. In this paper we compare the characteristics of RETINA with PcGets, a well-known automatic modeling method proposed by David Hendry. We point out similarities, differences, and complementarities of the two methods. In an example using U.S. telecommunications demand data we find that RETINA can improve both in- and out-of-sample over the usual linear regression model and over some models suggested by PcGets. Thus, both methods are useful components of the modern applied econometrician's automated modeling tool chest.
Information
- Type
- Research Article
- Information
- Copyright
- © 2005 Cambridge University Press
1. INTRODUCTION
Model building and specification selection is a process blending science and art: finding candidate models must adhere to some sort of paradigm, as Ploberger and Phillips (2003) make clear in their discussion of the relationship between the data generating process (DGP) and a principle of parsimony in achieving an adequate representation of the data. Recent developments have gone in the direction of making some of this process automatic and hence implementable in software. A leading method is the strategy known as general-to-specific (Gets) modeling proposed by David Hendry, which Hoover and Perez (1999) first suggested implementing in an automated way. An overview of the literature, and the developments leading to Gets modeling in particular, is provided by Campos, Ericsson, and Hendry (2004). Finite-sample behavior is examined in Krolzig and Hendry (2001) and Hendry and Krolzig (2003). PcGets, a computer program that implements the Gets modeling is described in Hendry and Krolzig (2004).
PcGets has four basic stages in its approach to selecting a parsimonious undominated representation of an overly general initial model, denoted the general unrestricted model (GUM). The first concerns the estimation and testing of the GUM, the second is the presearch process, the third is the multipath search procedure, and the fourth is the postsearch evaluation. See Hendry and Krolzig (2001) for details.
In this paper we compare PcGets with RETINA, another automatic modeling method, recently proposed in Perez-Amaral, Gallo, and White (2003), based on earlier work by White (1998). It aims at achieving a flexible and parsimonious prediction model that well approximates the conditional mean of a variable, given a (potentially large) set of variables of interest, in situations where one does not have specific information as to the functional form of the conditional mean or as to the relevance of individual variables. RETINA has the flexibility of neural network models (see White, 1989) in that it accommodates nonlinearities and interaction effects (through nonlinear transformations of the potentially useful variables in the conditioning set), the concavity of the likelihood in the parameters of the usual linear models (which avoids numerical complexity in estimation), and the ability to identify a set of attributes that are likely to be truly predictive (which corresponds to a principle of parsimony). In performing model selection, the approach relies on an estimation/cross-validation scheme that is aimed at limiting the possibilities that good performance is due to sheer luck.
In Section 2 we outline the basic features of RETINA. In Section 3 we compare and contrast the objectives, strategies, selection criteria, base models, and other features of RETINA with those of PcGets. In Section 4 we illustrate the complementarity of the methods by applying both to real data on U.S. telecommunications demand. Section 5 contains concluding remarks.
2. RETINA
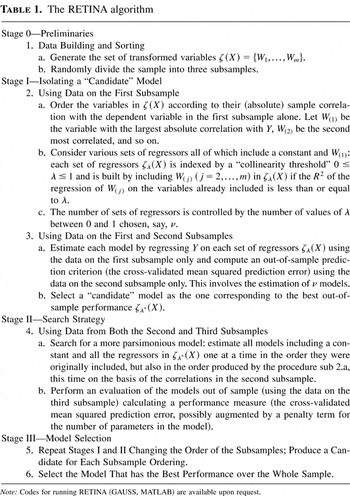
The rationale behind the RETINA procedure is a predictive modeling effort guided by the data structure. In general there is no theory required apart from some guidance in selecting an information set of potential predictive usefulness. The key principles that have inspired the construction of the algorithm are flexibility, selective search, control of collinearity, and out-of-sample predictive ability. The procedure is described in detail in Table 1 (cf. also the original paper by Perez-Amaral, Gallo, and White, 2003); here it is helpful to sketch the motivations for these basic features of RETINA.
The RETINA algorithm

Flexibility: Flexibility is required to handle the lack of information about the functional form of the conditional mean of the dependent variable Y given “inputs” X that is common in economics. To attain this flexibility, one may use a set of transformations of the input variables, say, ζ(X) = {ζj(X), j = 1,…,m}, that embodies both nonlinearities and interactions.
Selective Search: The task of evaluating all 2m possible models arising when we have m candidate regressors in the set of transformed variables ζ(X) and then of applying some form of model selection becomes impossible for even a moderate value of m. Rather, following the ideas in White (1998), we can select from a judiciously chosen subset of all possible models (of order proportional to m), admitting (transformed) predictor variables on the basis of their relevance for the problem at hand. For example, one may rank the candidate regressors according to their correlation in absolute value with the dependent variable and include them in the model sequentially in rank order.
Collinearity: To control the degree of dependency among the variables of the model, one can require that the amount of collinearity between the included predictors and any candidate predictor considered for sequential inclusion must lie below a threshold parameter λ chosen by the experimenter (as λ approaches 0 new regressors approach orthogonality; as λ approaches 1 new regressors may be highly collinear).
Out-of-Sample Forecasting Ability: Although flexibility is desirable, it creates the danger of overfitting the sample data. To avoid this, we use disjoint subsamples for estimation and cross-validation and an out-of-sample prediction performance criterion for model selection as important features of the procedure.
Some comments on the RETINA algorithm are in order.
- Division of the entire sample into three subsamples. This is done to cross-validate using truly out-of-sample data.
- Safeguards against spurious correlations. This is achieved by three features of RETINA. One is the scrambling of the regressors by their correlation in the second subsample, another is the use of the parameter λ to control for collinearity, and a third is the repetition of the whole procedure on the different orderings of the sample.
- Information criteria. To select the final model associated with a specific ordering of the subsamples we apply an information criterion; RETINA uses the out-of-sample Akaike information criterion (AIC).
3. PcGets VERSUS RETINA
In this section we sketch similarities and differences between PcGets and RETINA. For clarity and brevity, we omit details that can be found in the references. We start by comparing the objectives, strategies, and general characteristics of the two procedures, continue with some more specific details, and finally outline certain parallel aspects of the two methods.

In many practical applications, the general-to-specific approach often proceeds as if the DGP is nested within the GUM (or, equivalently, as if the GUM is an overparameterization of the DGP), so that the DGP can be discovered by eliminating the irrelevant variables (this is not an explicit assumption of PcGets, though). RETINA is less ambitious. It tries to approximate an unknown predictive relationship using a model that is not necessarily correctly specified, using transforms of the attributes to the extent that they contribute to out-of-sample prediction and are not too collinear with each other.

The modeling strategies are quite different: PcGets proceeds from general to specific; it starts from a general model and reduces it. RETINA starts from a model with just a constant and augments it by including additional transforms only when they help forecast out of sample and are not too collinear with previously included variables (no specific hypothesis testing is performed).

The role of the GUM is crucial in PcGets, but there is no automatic procedure for specifying the GUM, although there are useful guidelines. On the other hand, RETINA constructs several base models (GUMs in PcGets parlance) in an automatic fashion and then uses a strategy to reduce them using out-of-sample performance criteria.


A priority within the RETINA procedure is the control of collinearity among the variables as represented in the initial information set and after subsequent nonlinear transformations. (Note that linear transformations are excluded from consideration as candidate regressors.) Collinearity is not as central a concern for PcGets, although Hendry often advocates reparameterizations of the GUM so as to strive for orthogonal regressors.

In PcGets two overlapping subsamples are used for postchoice evaluation, but not for model selection. They are used to check for in-sample goodness of fit. However, the model building and selection mechanism of RETINA is directed toward out-of-sample predictive ability. That is why it is necessary to use disjoint subsamples for performing out-of-sample forecasts and carrying out truly out-of-sample forecast evaluations.


The linearity or nonlinearity in the underlying variables afforded by PcGets is specified by the GUM. The nonlinearity in the underlying variables of the model selected by RETINA is chosen by the procedure. Linearity in the parameters ensures simple computation.

The functional form of the model suggested by PcGets is embedded in the GUM. The functional form of the model suggested by RETINA is given by the original inputs and the transforms allowed by the procedure.


Undoubtedly, the two procedures have certain parallel features. Both apply repeated testing: PcGets reduces the GUM from the top down with in-sample tests, whereas RETINA builds from the bottom up by adding regressors one by one, in the order suggested by a saliency feature, controlling for collinearity, and then repeatedly using out-of-sample tests and an information criterion, the out-of-sample AIC, for trimming the model down.
Despite these parallel features, especially in the mechanics, PcGets and RETINA are nevertheless distinct in terms of objectives, general strategy, selection criterion, the base model, flexibility of the model, treatment of collinearity, and the use of the subsamples.
The procedures can be seen as different but far from incompatible ways of providing insights into a set of data. Different emphases are at work, and, in particular applications, one may be more useful than the other, depending on prior knowledge, the intended use of the model, and the ability of the researcher.
4. RETINA AND PcGets: AN APPLICATION
The aim of this section is to illustrate the performance of RETINA and PcGets using a real data set. The comparison is necessarily limited in scope, because the GUM is crucial for PcGets, and its specification is crucial for a proper comparison with other methods. We do not have clear indications as to what might be legitimate GUMs in our particular application, so we use simple models to start with and feed the same inputs to the linear regression model, RETINA and PcGets. By the same token, not having strong hypotheses about the function linking the available information is a fundamental basis for the use of RETINA.
For our application we use a cross-section of U.S. firms. The data were obtained from PNR, a subsidiary of Indetec International. The data set includes variables related to the demand for business toll telephone services in 1997. Our main interest is the duration of “intra-lata” calls. (LATA stands for “local access and transport area.”) A toll call from one point within a LATA to another point within the same LATA is an intra-lata or short distance toll call. Possible explanatory variables of intra-lata duration are business lines (Bus), the number of hunting lines (Hun), the sales (Sales) of the company expressed in dollars, the number of employees working locally (Emh), the total number of employees for the business (Emt), the physical extension of the business, proxied by the square footage of its premises (Sqft), and population (Pop), that is, the size of the business area location.
Our sample has 1,217 observations. Prior to the analysis, the data were rescaled to avoid the eventual negative impact on computations of large differences in orders of magnitudes of the variables. Given our purposes here, we focus on the performance of RETINA with respect to the more traditional use of a linear model. We do not consider prior transformations of the original variables, although a log transform of the dependent variable or its ratio by the number of employees (which is common in the Telecom demand literature) could also be considered (which also raises the issue of what transformation for the dependent variable should be considered). We model intra-lata minutes as a function of the number of business lines, the number of hunting lines, employees here, employees total, sales, square footage, and population habitat size.
To evaluate the candidate models, we use two criteria. The first is based on an information criterion; specifically, we choose the model with the lowest AIC. The second is the out-of-sample performance, measured by cross-validated mean square prediction error (CMSPE), which we expect to be lower for models suggested by RETINA. To compute a consistent measure of CMSPE, we used the following strategy, motivated by the fact that CMSPE depends on the specific subsample split considered, in terms of its size and characteristics.
We randomly assigned each observation to three disjoint subsamples, each including approximately one-third of the observations in the sample. Then the proposed models were cross-validated using two of the three subsamples for estimation and the third for cross-validation. We considered all three possible rotations and then summed the CMSPEs obtained in each rotation.
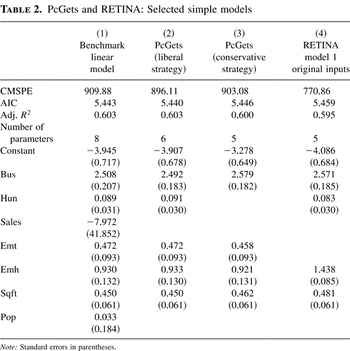
In Table 2, we compare several model estimations. In column 1, we report the estimation of a usual linear model (by ordinary least squares [OLS]) without using an automatic model selection strategy. The signs of the coefficients are as expected, except for Sales and Population, which are not statistically significant. The results suggest that the number of business lines (Bus), labor force (Emh, Emt), and physical extension of the business (Sqft) should be important for explaining the duration of intra-lata calls.
PcGets and RETINA: Selected simple models

In columns 2 and 3 we report the results of PcGets taking the standard linear model as the GUM. The liberal strategy drops the two insignificant variables of the basic linear model and obtains a slightly lower AIC and a better CMSPE, providing an improvement over the basic model. The conservative strategy drops an additional variable, hunting lines [Hun], with a slight increase in AIC and worsening of the CMSPE. In terms of prediction, it is still better than the basic model of column 1.
In column 4, we report the model suggested by RETINA without allowing any transformation of the inputs. We do this to obtain a direct comparison with the basic linear model and with the models suggested by PcGets. We observe that the first model suggested by RETINA, model 1, is very similar to the conservative PcGets model. The difference is that it substitutes [Hun] for [Emt].
The comparison of columns 2 and 4 illustrates how RETINA has improved out-of-sample predictive ability (corresponding to an improvement of the CMSPE from 896.11 to 770.86) by dropping the variable Emt even if it is highly significant in sample, with a t-statistic of 5.07, a result that parallels the outcomes in the simpler models seen in Table 2. If one had a strong prior on the theoretical relevance of such a variable, the indications provided by the automated procedure should definitely be taken into account.
In this case, RETINA chooses just one of the two variables related to Employees in the model, as the number of workers locally and in the whole business is highly correlated (Pearson's correlation = 0.86). On the other hand, it excludes more descriptive and nonsignificant variables such as Sales and Population.
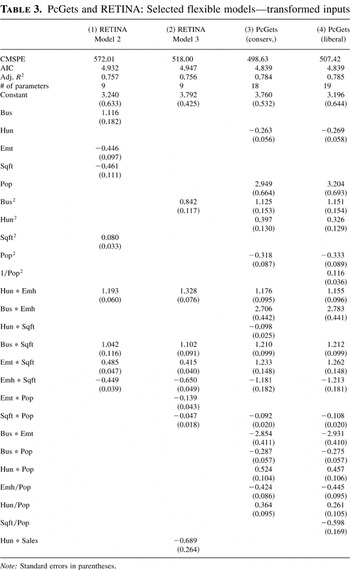
A distinguishing feature of RETINA is its use of nonlinear and interactive transforms of the underlying predictors. Accordingly, in Table 3—columns 1 and 2—we report the results obtained by RETINA, permitting it the use of nonlinear transforms and interactions created by taking all squares, cross-products, and cross-ratios. For brevity, we do not explicitly reference all such ratios as most of these are never selected. As a result the out-of-sample (and also the in-sample) performance improves significantly relative to the results of Table 2, while at the same time being only slightly less parsimonious than the simple linear model of Table 2. RETINA model 2 (column 1) was chosen using a minimum AIC criterion and RETINA model 3 (column 2) considering the minimum CMSPE.
PcGets and RETINA: Selected flexible models—transformed inputs

The total variation explained by these models is noticeably higher than models with the original inputs, whereas the CMPSEs for models 2 and 3 are respectively 37% and 43% lower than that of the first basic model (column 1).
The transformations suggested by RETINA for both models 2 and 3, in particular the interaction terms, are interesting. The negative constant terms in Table 2, columns 1–4, become positive in Table 3, columns 1 and 2, in which RETINA allows for transformed inputs. These models are not necessarily correctly specified, and we emphasize that this implies that the coefficients thus do not necessarily have the standard ceteris paribus interpretation.
Although PcGets is designed to identify a theory-congruent parsimonious model corresponding to the true DGP, it may nevertheless have value in obtaining forecasts. To investigate the properties of PcGets in this regard in a manner directly comparable to our RETINA results, we apply PcGets by specifying a GUM that contains all the transforms accessible to RETINA. Strictly speaking, this is a nonstandard approach to PcGets, as we have no theory justifying this specification of the GUM, nor a guarantee that the result may be theoretically plausible. We may be placing theory congruence at risk, and we make no attempt to specify relatively orthogonal regressors. Nevertheless, we see from columns 3 and 4 of Table 3 that both conservative and liberal versions of PcGets not only provide noticeable improvements in CMSPE and AIC relative to all the models of Table 2 but also improvements relative to the RETINA results of columns 1 and 2 of Table 3 (CMSPE of column 3 of PcGets is 3.7% lower than column 2 of RETINA).
That PcGets is useful in this context should not, however, be surprising, considering that (as is plausibly true here) even when the GUM does not include the DGP (the ideal forecasting tool), PcGets should identify an approximation to the DGP that has certain optimality properties and that may thus be useful in forecasting. Interestingly, although PcGets is designed to deliver parsimonious models, it achieves its modest gains relative to RETINA with models that are twice as complex.
We emphasize the strictly limited scope of the preceding comparison. Nevertheless, our example illustrates that RETINA may help the researcher not only to arrive at useful forecasting models but also to consider relevant transformations of the inputs that, when used as regressors, yield models with improved forecasting ability relative to the basic regression model. Further, we see that PcGets has value in obtaining useful forecasts. It is an interesting question to investigate whether the use of PcGets for this purpose generically results in less parsimonious models than RETINA or whether this is only a feature of our present example.
5. CONCLUSIONS
Our discussion has revealed both differences and similarities between the two automated modeling procedures PcGets and RETINA. Although some polarization of reality should be discounted in what follows, as matters are not always so clear cut, the main differences between the two approaches concern the following features.
a. Objectives: In PcGets, obtain an appropriate representation of the data within sample (with all caveats about implicit assumptions often encountered in the literature that the true DGP is among the models being considered), or in RETINA obtain a predictive approximation
b. Base model: GUM specified by the researcher prior to the use of PcGets or constructed within the procedure from the relevant transformations of the inputs in RETINA
c. General strategy: General-to-specific in PcGets or specific-to-general with later reduction in RETINA
d. Selection criterion: In-sample specification tests (residuals and parameters) in PcGets or out-of-sample predictive performance in RETINA (cross-validation, no specification tests)
e. Flexibility: Embedded in the GUM and later selected by the reduction process in PcGets or chosen by the procedure in RETINA from the allowed transformations
f. Collinearity: Checked for in PcGets when constructing the GUM or explicitly embedded checks in the procedure as in RETINA (with some caveats in order because RETINA does not recognize the meaning of the variables involved)
g. Subsamples: Used as a final postselection check in PcGets or an essential part of the procedure in RETINA.
The complementarities of both approaches are also important.
1. PcGets may be more appropriate when there is a strong desire to conform to a theory or reasonable confidence that the GUM can be seen as a good representation of the DGP (although there is no formal assumption that the DGP is nested within the GUM in PcGets, practitioners often do operate as if the DGP is among the models considered in the selection); RETINA may be more appropriate when the researcher lacks precise knowledge of the relationship between the dependent variable and the inputs. The role of the GUM is crucial in PcGets; however, it is generated outside PcGets.
2. PcGets may be more useful when an in-sample fit is desired, whereas RETINA may be more appropriate when the objective is an out-of-sample predictive performance. Nevertheless, PcGets has the potential to identify useful forecasting models when provided with a sufficiently flexible GUM, as our example shows.
3. In case of high collinearity between the original inputs or the regressors of the GUM, RETINA may be the procedure of choice, because it explicitly embeds the control of collinearity, although in a time series context RETINA as currently implemented would not be able to guide between the addition of, say, a lagged variable or a variable in first differences. Moreover, the degree of collinearity among the regressors depends on the way the variables are originally represented in the information set: it is certainly true that models containing, say, X1 and X2 on the one hand and X1 and Z = X2 − X1 are equivalent, but the degree of collinearity between X1 and X2 is different than that of X1 and Z (or X2 and Z for that matter), and this difference may affect which variables (and transforms) are included.
By and large, although it seems that a reasonable approach would be the creation of a “RetiGets” hybrid, one should bear in mind some facts.
a. PcGets is mostly designed for macroeconomic aggregate time series data, whereas RETINA has been developed for cross-section individual data of economic or noneconomic nature.
b. PcGets is more inclined toward modest size samples and number of regressors, whereas RETINA has been developed for large samples and possibly large numbers of inputs.
c. PcGets may be more useful when an in-sample fit is desired, whereas RETINA may be more appropriate when the objective is an out-of-sample predictive performance.
It is apparent that both procedures are still at an early stage of development, especially RETINA. In particular, these methods can be extended to handle other types of data and estimation techniques: for example, models with stationary and nonstationary variables among the candidate regressors, panel data, limited dependent variable models, systems of equations; and their performance in these contexts needs to be assessed. Nevertheless, the usefulness of these automatic modeling methodologies so far certainly warrants these further developments.
References
REFERENCES
Campos, J.,
N.R. Ericsson, &
D.F. Hendry
(2004)
General-to-Specific Modeling.
Edward Elgar.
Hendry, D.F. &
H.-M. Krolzig
(2001)
Automatic Econometric Model Selection with PcGets.
Timberlake Consultants Press.
Hendry, D.F. &
H.-M. Krolzig
(2003)
New developments in automatic general-to-specific modeling. In
B.P. Stigum (ed.),
Econometrics and the Philosophy of Economics, pp.
379–419.
Princeton University Press.
Hendry, D.F. &
H.-M. Krolzig
(2004)
Sub-sample model selection procedures in general-to-specific
modelling. In
R. Becker &
S. Hurn (eds.),
Contemporary Issues in Economics and Econometrics: Theory and
Applications, pp.
53–75.
Edward Elgar.
Hoover, K. &
S. Perez
(1999)
Data mining reconsidered: Encompassing and the general-to-specific
approach to specification search.
Econometrics Journal
2,
167–191.Google Scholar
Krolzig, H.-M. &
D.F. Hendry
(2001)
Computer automation of general-to-specific model selection
procedures.
Journal of Economic Dynamics and Control
25,
831–866.Google Scholar
Perez-Amaral, T.,
G.M. Gallo, &
H. White
(2003)
A flexible tool for model building: The Relevant Transformation of
the Inputs Network Approach (RETINA).
Oxford Bulletin of Economics and Statistics
65, supplement 1,
821–838.Google Scholar
Ploberger, W. &
P.C.B. Phillips
(2003)
Empirical limits for time series econometric models.
Econometrica
71,
627–673.Google Scholar
White, H.
(1998)
Artificial Neural Network and Alternative Methods for Assessing
Naval Readiness.
Technical Report,
NeuralNet R&D Associates,
San Diego.
White, H.
(1989)
Learning in artificial neural networks: A statistical perspective.
Neural Computation
1,
425–464.
Reprinted in H. White (1992) Artificial Neural Networks:
Approximation and Learning Theory pp. 90–131. Blackwell.Google Scholar
The RETINA algorithm
PcGets and RETINA: Selected simple models
PcGets and RETINA: Selected flexible models—transformed inputs
 You have
Access
- 18
- Cited by