1. INTRODUCTION
Synchrotron light sources so-called “third generation source” have been used quite successfully to reveal the arrangement of atoms in a wide range of materials, including semiconductors, polymers, ceramics, and biological molecules. However, current synchrotrons generate picosecond X-ray pulses, which are not suitable for paradigm-shifting science such as the study of real-time electron-electron correlation in atomic, molecular, and nanoscopic systems beyond Born-Oppenheimer approximation. These investigations demand tools with attosecond temporal and nanometer spatial resolutions. The generation of an isolated attosecond pulse at different photon energies and with a higher photon-flux becomes necessary for such state-of art advanced tools.
A self-amplified spontaneous emission (SASE) in a free electron laser (FEL) has always been a favorite choice as a potential source for sub-femtosecond X-ray pulses. The basic concept of SASE-FEL was proposed by Bonifacio et al. (Reference Bonifacio, Pellegrini and Narducci1984). Exploiting SASE scheme, several experiments and simulation works have been done so far for the generation of picosecond, femtosecond, sub-femtosecond, even down to attosecond X-ray pulses (Andruszkow et al., Reference Andruszkow2000; Milton et al., Reference Milton2001; Ayvazyan et al., Reference Ayvazyan2002, Reference Ayvazyan2006; Brefelda et al., Reference Brefelda, Faatza, Feldhausa, Orfera, Krzywinskib, Ollera, Pfluegera, Rossbacha, Saldin, Schneidmillera, Schreibera and Yurkovc2002; Ackermann et al., Reference Ackermann2007; Shintake et al., Reference Shintake2008; Stupakov, Reference Stupakov2009; Xiang & Stupakov, Reference Xiang and Stupakov2009; Xiang et al., Reference Xiang, Huang and Stupakov2009). The high intensity laser plasma simulation has also been performed for the generation of single attosecond pulse and train of attosecond pulses (Roso et al., Reference Roso, Plaja, Rzazewski and Vonderlinde2001; Sakai et al., Reference Sakai, Miyazaki, Kawata, Hasumi and Kikuchi2006; Baeva et al., Reference Baeva, Gordienko and Pukhov2007; Karmakar & Pukhov, Reference Karmakar and Pukhov2007; Varro & Farkas, Reference Varro and Farkas2008; Kim et al., Reference Kim, Lee, Chung and Leem2009; Lee et al., Reference Lee, Chung, Park, Jeong and Kim2010; Liu et al., Reference Liu, Xia, Liu, Wang, Cai, Wang, Li and Xu2010).
After the advent of a carrier envelope phase (CEP) stabilized few-cycle laser, the interaction of such a laser with an electron-bunch in a wiggler magnet with single or double period prior to X-ray undulator in SASE-FEL played a vital role for the stable generation of isolated attosecond X-ray pulses with FEL. The use of a few-cycle optical pulse laser in FEL was first recognized by Zholents and Fawley (Reference Zholents and Fawley2004). This scheme includes relativistic electron-bunch, a few-cycle, intense optical laser pulse and an intense pulse of coherent X-ray radiation, together with a number of magnetic undulators and transport elements. The train of 100-attosecond full width half measure (FWHM), X-ray pulses with multi-MW was reported from simulation. In a simpler layout, a train of 300 attosecond X-ray pulses with GW power at 0.1 nm was obtained (Saldin et al., Reference Saldin, Schneidmiller and Yurkov2004a). In a later proposal, using two undulators, Saldin et al. (Reference Saldin, Schneidmiller and Yurkov2004b) reported 300-attosecond pulse with 100-GW output power from simulation. Zholents (Reference Zholents2005) induced the energy modulation in a low-energy electron-bunch by using an intense optical laser showing about 200 as X-ray pulses can be produced. The energy modulation of an electron-bunch is easier at a low energy than at a high energy because a longer wiggler is required at a higher energy. Another advantage of the energy modulation at a lower energy is the small energy spread induced in the electron-bunch by the wiggler magnet itself. To improve the contrast ratio as well as enhance the current, an electron-bunch was modulated in energy by two consecutive modulation sections, followed by compression in a dispersive section (Zholents & Penn, Reference Zholents and Penn2005). The current enhancement in the central cycle of two laser cycles was two times stronger than that in other cycles.
The effect of linear energy chirp on FEL amplification has been studied and a new proposal of using a tapered undulator was made, showing the generation of 200 attosecond X-ray pulses with a power of 100 GW (Saldin et al., Reference Saldin, Schneidmiller and Yurkov2006). The angular modulation of electron's trajectories can also contribute toward an attosecond pulse generation. The modulation of electron's angles by a CEP laser was utilized for the creation of 115-attosecond X-ray pulses with a peak power of 100 GW (Zholents & Zolotorev, Reference Zholents and Zolotorev2008). In one step forward, Kumar et al. (Reference Kumar, Kang and Kim2011) showed in simulation that manipulation of the energy profile of an electron bunch may also lead to the generation of an isolated attosecond pulse of about 100 attosecond FWHM at 0.1 nm wavelength.
Compton backscattering scheme can be useful for the generation of an attosecond α-ray pulse. Using Compton backscattering with an energy-modulated electron-bunch, it was reported in simulation that an isolated attosecond γ-ray pulse at 64 keV with a pulse width of 550 attosecond and a contrast ratio of 5.1:1 can be generated (Chung et al., Reference Chung, Yoon and Kim2009). The spectral filtering (such as a crystal spectrometer) allowed one to obtain an isolated attosecond γ-ray.
All the efforts described in the above have made remarkable contributions to the progress in the generation of attosecond pulses. Most of the proposals cited above shows the generation of a train of attosecond pulses. This paper concerns is the suppression of the side peaks to generate a single, isolated attosecond hard X-ray pulse. The structure of this paper is as follows. In Section 2, we present a basic principle for energy modulation by a laser in a wiggler and then the density modulation in chicane. In Section 3, simulation results for the generation of an isolated attosecond radiation pulse are presented using PAL-XFEL parameters. Conclusions are made in Section 4.
2. GENERATION OF ISOLATED ATTOSECOND X-RAY PULSE AT 0.1 NANOMETER WAVELENGTH
From the previous section, it is clear that by introducing a high intense laser to SASE; current peaks in an electron-bunch could be generated, thereby leading to the shorter FEL length and increment in the peak power of X-ray radiation.
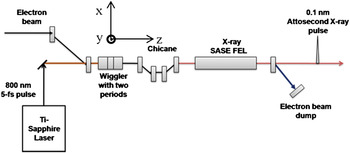
Keeping these points in mind, we consider a simpler enhanced SASE scheme as shown in Figure 1, according to which an electron beam from a linear accelerator is sent to a double-period wiggler magnet. At the same time, a few-cycle CEP-stabilized laser, polarized in the x-direction, co-propagates to induce the energy modulation in the electron-bunch inside the wiggler. The wiggle provides magnetic field in the +y and –y direction. Both the laser and the electron bunch are focused on the z-axis at the center of the wiggler, and are adjusted in space and time to overlap each other near focus. The peak power of the laser is selected in such a way that the amplitude of energy modulation significantly exceeds the magnitude of random noise in electron energy. The energy-modulated electron-bunch then enters into a chicane, which introduces dispersion. In a chicane, the higher the electron energy is, the shorter distance it travels. In general, this leads to the density modulation, producing the micro-bunching of the electrons at a spacing of the laser wavelength and the periodic current peaks. The increase in the peak current is accompanied by a corresponding increase in the energy spread of electrons. Finally, the electron-bunch enters into a long undulator to better radiate at X-ray wavelength via standard SASE process.
(Color online) ESASE scheme for attosecond pulse generation.

The wiggler magnet can be expressed by,
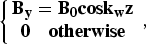
acting on the electron-bunch. Here K w = 2π/λw and λw are the wiggler period.
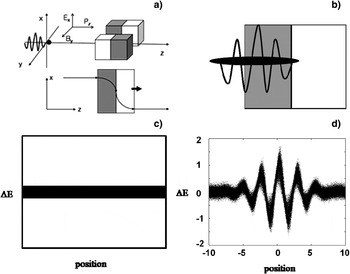
Figure 2a shows the case of an electron interacting with a few-cycle laser inside a wiggler. Ex is the laser field along the x direction and B y is the wiggler magnetic field acting on the electron along y axis. Pz is the electron momentum along the z direction. The interaction of electron with a laser field under the magnetic field by the wiggler is governed by Lorentz equation.  is proportional to −P x · E x, where γ is the relativistic factor. P x is the x-component of the relativistic momentum,
 , and E x is the electric field seen by the electron, and m the electron's mass (Brau, Reference Brau1990). The amount of the energy modulation is determined by the integration of −Px Ex over the interaction time or distance:

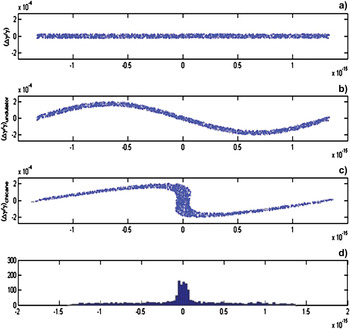
when Px and E x are the quantities experienced by the electron. P x depends on the integration of the magnetic field over the interaction distance. Hence the modulation will depend on the magnitude B 0 of the magnetic field. With the change in B 0, the amplitude of P x is also changes, resulting change in modulation Δγ. Figure 2b shows the electron-bunch interaction with a few-cycle laser inside the wiggler. In the upper half of the cycle, the electrons gains energy and in the lower half of the cycle, electrons loss their energy resulting electrons energy distribution is replicated to the laser cycles. Figure 2c represents the flat uniform energy distribution of the electron-bunch before entering to the wiggler and Figure 2d shows the energy modulation of electron-bunch inside wiggler. Note that the temporal profile of the laser is duplicated to the electron-bunch profile. All the electrons in the bunch act under the Lorentz-force (i.e., under the influence of the laser field and the wiggler field) resulting in the energy modulation of the electron-bunch. To define micro-bunching inside chicane, Figure 3a denotes the electron energy distribution for one laser pulse-length 2.7 fs (about 800 nm) before wiggler. Figure 3b is the electron energy distribution inside wiggler after laser modulation. Figure 3c shows the electron energy distribution after chicane and Figure 3d is the histogram of electron energy distribution after chicane. These figures are obtained by solving Eqs. (3) and (4) from Zholents' (2005) paper.
(a) Shows the interaction of single electron with laser inside single period wiggler. (b) Shows the laser profile interaction with electron-bunch inside wiggler. (c) Shows the flat energy distribution profile of electron-bunch, (d) Electron energy distribution inside wiggler is shown.

(Color online) Micro-bunching by laser modulation. (a) Is the electron energy distribution for one laser wavelength before wiggler. (b) The second after wiggler part. (c) The third after chicane. (d) The last is the electron distributions after chicane.

3. SIMULATION RESULTS
To study the advantage of enhanced self-amplified spontaneous emission (ESASE) over SASE, we consider an electron-beam of PAL-XFEL: a beam-energy of 10 GeV (~relativistic factor, γ = 2 × 10⁴), a total electron-bunch-charge 0.2 nC and normalized emittance of 0.5 μm-rad, and a root mean square (rms) energy spread of 1 MeV. Here CEP-stabilized femtosecond lasers of different wavelengths are considered. We use a four-dipole-magnet chicane, which is controlled by momentum compaction factor R 56.

Where θB is the bending angle of electron trajectory inside chicane and L1 is the length between the first and the second, the third and the fourth dipole magnets. 2L B is the magnet length. During the beam dynamics calculation, nonlinear instabilities such as wakefield effects inside the linac, the coherent synchrotron radiation and incoherent synchrotron radiation in linac and bunch compressors are taken into consideration. For ESASE scheme, the optimization of the laser wavelengths, FWHM pulse duration, and electron-bunch energy distributions is carried out to control the side current peaks in the current profile of electron-bunch to get a good contrast ratio and to obtain the radiation of isolated attosecond pulse in the undualtor. The laser is focused at the center of the wiggler where it induces the energy spread in the electron-bunch. The electron energy distributions are obtained by the optimization of radio frequency (RF) phase parameters in a photo-injector part, in the accelerator part, and the bunch compressor part in the acceleration section of PAL-XFEL. To optimize these parameters we use six dimensional particle tracking code ELEGANT (Borland, Reference Borland2005).
3.1. Optimization of Current Profile (Single Peak Current Profile) by Scan of Laser Wavelength
To study the effect of laser wavelength, we consider an electron-bunch with a total length of 12 μm (about 40 fs), an average current of 6 kA, a normalized-emittance of 0.5 mm-mrad, and a rms energy spread of 1 MeV. A CEP stabilized laser (λL = 1200 nm, 7.5 fs) with a peak power of 26 GW is used. The laser beam waist is 250 μm. The wiggler field is B 0 = 1.1459 T, and the number of wiggler period is 2.
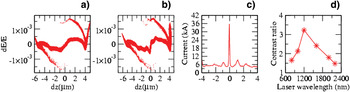
Figure 4a shows the longitudinal energy distribution of this electron-bunch before wiggler and Figure 4b is after chicane. The energy distribution has a slanted slope in the middle part in Figure 4a. This energy distribution is modulated by the laser inside the wiggler. This energy modulation is further compressed in chicane. The slanted slope becomes steeper after passing through chicane (Fig. 4b), resulting in a strong single current spike in the current profile (Fig. 4c). We also changed laser wavelengths from 800 nm to 2400 nm, keeping the number of the cycle of the laser field as 1.85 (correspondingly, the pulse width varies from 5 fs to 14 fs FWHM). The energy distributions after wiggler and chicane are manipulated in a different way for each laser wavelength and corresponding pulse duration (FWHM). For a given energy distribution of electron-bunch this gives the different number of peaks with different magnitudes in the current profile. Figure 4d shows the variation of the contrast ratio for laser wavelengths, 800-nm to 2400-nm. We notice that a 1200 nm, 7.5 fs FWHM laser produces a highest contrast ratio. The contrast ratio is defined by the ratio of the magnitude of the strongest peak to that of the second strongest peak. This clearly demonstrates that by optimizing laser wavelength and manipulating the energy distribution, a single strong current spike can be generated.
(Color online) (a) The longitudinal energy distribution of electron-bunch before wiggler. (b) The longitudinal energy distribution after chicane. (c) The current profile after chicane, λL = 1200 nm & τ (FWHM) = 7.5 fs for (a), (b), and (c). (d) Contrast ratio versus laser wavelength.

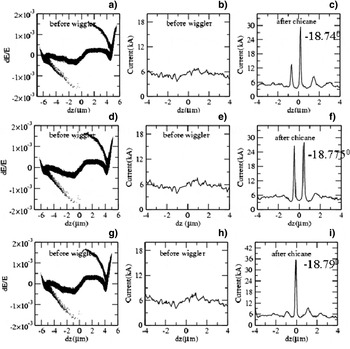
Now we would like to show the case where the current profile can be controlled by the change in the energy distribution. To examine this point, we generate three different energy distributions by varying the RF phase of one of linac columns by 0.05°. Other parameters are taken to be the same as in Figure 4. In Figure 5, we show the energy distribution before wiggler, current profile before wiggler, and after chicane for three RF phase values −18.79°, −18.775°, and −18.74°. In Figures 5a, 5d, and 5g, all three energy distributions profiles look similar in shape but there are changes as clearly shown in Figure 6. Figures 5b, 5e, and 5f show corresponding current profiles before wiggler with an average current of 6 kA. In Figures 5c, 5f, and 5i, the current profiles are shown after the chicane. In Figure 5c, the magnitude of the main peak is 30 kA, the side peaks have 12 kA and 7 kA, respectively. Figure 5f shows two major peaks with 22.7 kA and 29 kA, respectively. Figure 5i shows a single dominant peak with a current of 36 kA and two small side peaks with currents of 7 kA and 9 kA. This shows that a change in the energy distribution may lead to a big change in the current profile after chicane.
(a), (d), and (g) [the first column] are the longitudinal energy-distributions of the electron-bunch before wiggler. (b), (e), and (h) [the second column] are the current profile before wiggler. (c), (f), and (i) [the third column] are the current-profile after chicane for three RF phase values of −18.74°, −18.775°, and −18.79° of the second accelerator column in linac.

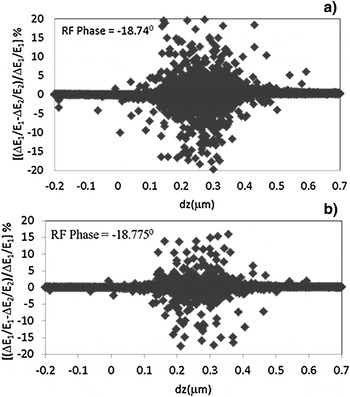
(a)-(b) the percentage change of Figures 5a and Figures 5d with respect to Figure 5g.

In Figure 6, we see the percentage change in the longitudinal energy distribution of the electron-bunch by changing RF phase to −18.74° and −18.775°. The reference phase value is −18.79°. In Figures 6a and 6b, the percentage change is large in the central part compared to the side part. For RF phase of −18.74°, the maximum change goes up to 20% and for RF phase of −18.775°, about 15%. The change of 0.05° in RF phase gives the change of 20% in the relative energy spread in the central part of the bunch as shown in Figure 6.
3.2 Optimization of Current Profile by Manipulation of Energy and Spatial Profile of E-Bunch
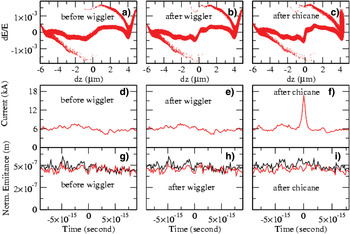
Here we would like to show that the current profile plays an important role in generating an isolated current peak. Three different energy distributions of electron-bunch are considered: (1) about 66 fs (about 20 μm) long electron-bunch with an average current of 3 kA (Fig. 7a), (2) about 53 fs (about 16 μm) long electron-bunch with an average current of 4 kA (Fig. 8a), and (3) about 40 fs (about 12 μm) long electron-bunch with an average current 6 kA (Fig. 9a). The other electron bunch parameters are the same as discussed earlier in the beginning of Section 3. The laser parameters used for this investigation are as follows: a laser power of 13 GW, laser wavelength of 1200 nm, and pulse duration of 7.5 fs FWHM. The momentum compaction factor R 56 is chosen between the qualities of electron bunch and the size of chicane.
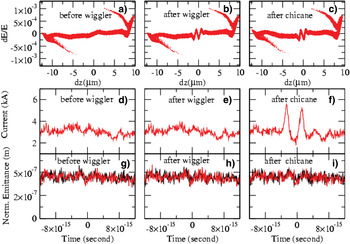
(Color online) The case of 3 kA, 66 fs long electron bunch. (a)-(c) The longitudinal energy distribution. (d)-(f) current profile on time scale. (g)-(i) Horizontal (black line) and transverse normalized − emittance (red line) on time scale.

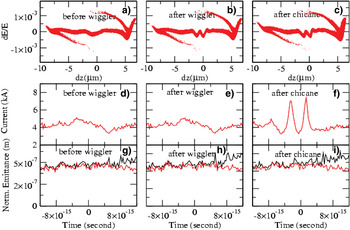
(Color online) The case for 4 kA, 53 fs long electron bunch. (a)-(c) The longitudinal energy distribution. (d)-(f) Current profile on time scale. (g)-(i) Horizontal (black line) and transverse normalized − emittance (red line).

(Color online) The case of 6 kA, 40 fs electron bunch. (a)-(c) The longitudinal energy distribution. (d)-(f) Current profile on time scale. (g), (h) Horizontal (black line) and transverse normalized − emittance (red line).

Figure 7 shows the results for a 66 fs (average current 3 kA) long electron-bunch. Figures 7a–7c shows how the longitudinal energy distribution changes through wiggler and chicane. In Figure 7a, the electron-bunch has a slightly upfront in energy distribution in the central part of the electron-bunch; after interacting with a laser, the energy modulation having the shape of the oscillation of the laser field is introduced as shown in Figure 7b. In Figure 7c, this energy modulation becomes steeper by chicane. This is manifested as current spikes in the current-profiles as shown in Figure 7f. The energy spread is always kept less than FEL parameter (ΔE/E< 5.4 × 10⁻⁴. Related current profiles are shown in Figures 7d–7f. The current profile before wiggler and after wiggler look similar in magnitude and shape (Figs. 7d and 7e) but after chicane there are two strong spikes in the central region of electron bunch, one spike of 5.6 kA at −2.64 fs (−0.8 μm) position and other spike of 5 kA at about 1.188 fs ( about 0.36 μm). The increase in the peak current in the central region in Figure 7f is caused due to the steepening of ΔE/E profile in the energy spread (see Fig. 7c). At each location, normalized emittances (both longitudinal and transverse) of the electron-bunch are also shown in Figures 7g–7i, which show no significant change in emittance due to these interactions.
The results for 4 kA, 53 fs (about 16 μm) electron-bunch are shown in Figure 8. Figure 8a shows the energy distribution before a wiggler. When this electron-bunch goes through the wiggler, it interacts with a laser and consequently experiences energy modulation. The energy modulation in the central cycle of the laser is much stronger than in other cycles. The corresponding current profiles of this electron-bunch are shown in Figures 8d–8f. We note that there is almost no difference in the current profile before and after the wiggler. The chicane plays a significant role; the rising slope becomes steeper (Fig. 8c) and two current spikes appears (Fig. 8f). After the chicane, the current profile has two current-spikes with a magnitude of 7 kA and 7.39 kA at 2.57 fs (−0.78 μm) and 1.32 fs (0.4 μm), respectively. Related normalized emittance are also shown in Figures 8g–8i, indicating no difference in magnitude and shape at these locations.
We report the results for the case of 6 kA, about 40 fs (about 12 μm) long electron bunch in Figure 9. Figures 9a–9c shows the longitudinal energy distribution of this electron-bunch before wiggler, after wiggler, and after chicane. Related current profiles have been shown in Figures 9d–9f.Figure 9f has only one major current peak of 17 kA in the central part and almost no side peaks compared to the cases of 3 kA and 4 kA electron-bunch. The rise in the peak current in the central part accompanies the steepening in the energy spread of electrons. This reports that by the manipulation of the energy distribution of electron bunch, one can minimize the side peaks so that an isolated current peak is generated. The duration of this current-peak is one femtosecond FWHM, which will become even shorter while the electron bunch passes through an undulator.
3.3. The Generation of an Isolated Attosecond Hard X-ray Pulse
Finally, to obtain the radiation, the electron bunch is fed into a 100-meter long undulator where the current spike in the central part produces most strongly SASE (enhanced SASE) because of its high current. The weak current part also produces SASE, but this SASE is much weaker because of their small current. The radiation produced by these modulated electron bunches in the undulator is computed by a three-dimensional time-dependent FEL code GENESIS (Reiche, Reference Reiche1999). The output radiation at 0.1 nm has been calculated.
The calculation was done for three different energy distributions discussed in the previous section. A 1200 nm and 7.5 fs FWHM laser have modified these bunches. Since the SASE radiation is based on the build-up from noise, each electron-bunch has different behaviors, i.e., different saturation points, and different oscillation pattern. Averaging over many slices cancels the oscillatory motion, leaving only the averaged effect. For the 3 kA electron bunch, the saturation point occurs around z = 73 meter in the undulator and for the 4 kA electron bunch, the saturation occurs around z = 55 meter in the undulator. The saturation position is the point where the exponential growth of the radiation power stops. After this point, the radiation power produced by the main current peak does not grow, because the slippage lengthens the pulse width.
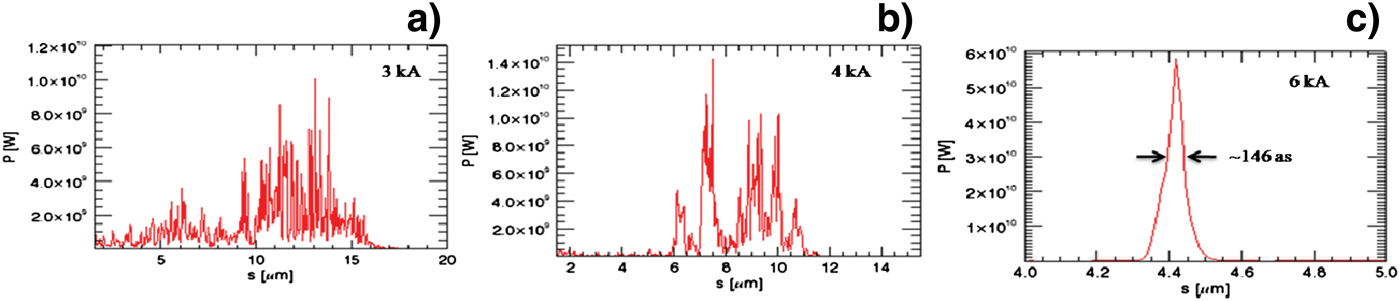
Figure10a shows the linear plot of the radiation power generated at z = 73 meter for an electron-bunch of 3 kA. The typical peak power is about 10 GW, on average. Figure 10b shows the plot of the radiation power generated at z = 55 meter for an electron-bunch of 4 kA. The saturation length for this bunch reduces to z = 55 meter. The typical peak power is 14 GW.
(Color online) GENESIS simulation showing radiation power at 0.1 nm for three electrons-bunches shown in Figures 7, 8, and 9. (a) Linear power plot at z = 73 meter for 3 kA, 20 μm (~66 fs) long bunch length. (b) Linear power plot at z = 55 meter for 4 kA, 16 μm (~53 fs) long bunch length. (c) Linear power plot at z = 34 meter for 6 kA, 12 μm (~40 fs) long bunch length. (here 1 μm ≈3.3 fs in time scale).
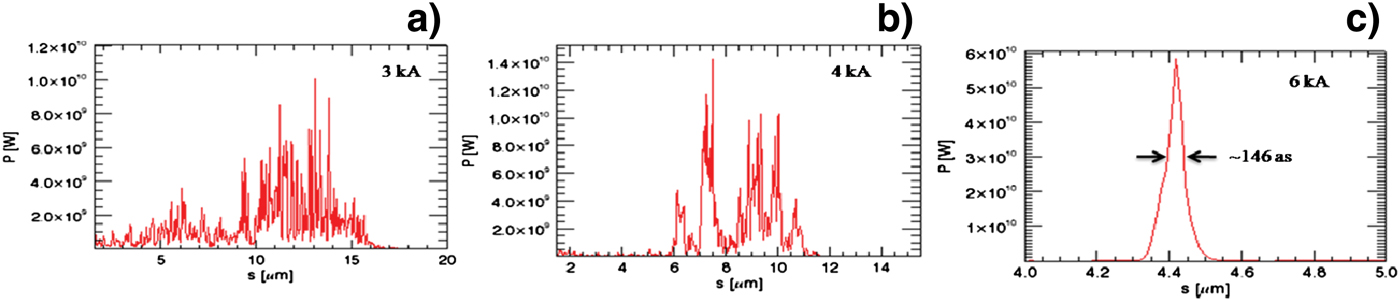
Figure 10c shows the plot of the radiation power measured at z = 34 meter for an average current of 6 kA. For this electron bunch, only a 34-meter-long undulator is sufficient to produce the saturated power. Only a single pulse is generated of 146 as and 58 GW.
4. SUMMARY AND CONCLUSIONS
Using the electron-beam parameters of the PAL-XFEL, we optimized laser, chicane, and energy distribution to generate an isolated attosecond pulse at 0.1 nm. The optimization of wavelengths and pulse durations show that 1200 nm and 7.5 fs FWHM are optimal laser parameters for producing a single current peak with a high contrast for a given 10 GeV electron bunch of the PAL-XFEL. It is shown that the manipulation of electron energy distribution can produce a high contrast single peak in an electron bunch. Such a current peak gives rise to an isolated attosecond X-ray pulse in an undulator. We have shown that an isolated 146 attosecond, 58 GW peak-power X-ray pulse at 0.1 nm is expected to be generated in a 34-meter long undulator for a driving laser of 1200 nm, 7.5 fs FWHM, and 0.2 mJ. This isolated attosecond hard X-ray pulse will be an excellent tool to realize electron diffraction with attosecond temporal resolution beyond Born-Oppenheimer Approximation.
ACKNOWLEDGMENTS
The research has been supported in part by Global Research Laboratory Program (Grant No. 2011-00131), Leading Foreign Research Institute Recruitment Program (Grant No. 2010-00471), and Max Planck POSTECH/KOREA Research Initiative Program (Grant No. 2011-0031558) through the National Research Foundation of Korea funded by the Ministry of Education, Science and Technology.