Introduction
The known habitats of termites range from dry deserts, steppes, prairies and Mediterranean scrublands to the wettest tropical forests, with differing assemblages characteristic of each habitat (Bignell & Eggleton, Reference Bignell, Eggleton, Abe, Bignell and Higashi2000). It is generally known that termites play an important role in forest ecosystems as mediators of many soil ecological processes (e.g. Lee & Wood, Reference Lee and Wood1971; Pearce, Reference Pearce1997; Bignell & Eggleton, Reference Bignell, Eggleton, Abe, Bignell and Higashi2000), although fully quantitative studies of their direct contribution to decomposition are few.
The majority of studies on the ecological importance of termites are focused on tropical forests and savannas, where functional diversity patterns and the influence of environmental factors on assemblages have been extensively analysed (e.g. Bignell et al., Reference Bignell, Eggleton, Nunes, Thomas, Watt, Stork and Hunter1997; Eggleton & Tayasu, Reference Eggleton and Tayasu2001; Eggleton et al., Reference Eggleton, Bignell, Hauser, Dibog, Norgrove and Madong2002; Davies et al., Reference Davies, Eggleton, Jones, Gathorne-Hardy and Hernandez2003; Jones et al., Reference Jones, Susilo, Bignell, Hardiwinoto, Gillison and Eggleton2003) and where the impact of termites in the ecosystem is acknowledged as substantial (Wood & Sands, Reference Wood, Sands and Brian1978; Bignell, Reference Bignell, König and Varma2006). In warm temperate and subtropical biomes, termite diversity is much lower, but an impact in forest systems is still apparent. However, it has not been assessed quantitatively. In the temperate forests of southern Europe, Reticulitermes, the dominant genus, is indigenous and forages actively on lying dead wood; but neither the overall impact on C mineralization nor the responses of the termites to seasonal environmental factors are well understood (e.g. Wang & Powell, Reference Wang and Powell2001; Nobre et al., Reference Nobre, Nunes, Brinca and Bignell2003). It is known that, as with many other wood-feeding termites, Reticulitermes tends to prefer moist wood and is particularly associated with wood partially decomposed by fungi (e.g. Becker, Reference Becker1970, Reference Becker1976; Grassé, Reference Grassé1986; Zoberi & Grace, Reference Zoberi and Grace1990; Lenz et al., Reference Lenz, Amburgey, Zi-Hong, Mauldin, Preston, Rudolph and Williams1991). A few examples from literature suggest that different species of termites apparently can have different responses to abiotic factors, such as temperature and moisture (e.g. Collins & Richard, Reference Collins and Richard1963, Reference Collins and Richard1966; Houseman et al., Reference Houseman, Gold and Pawson2001). Most studies of this kind were done under laboratory conditions and were designed to determine the thermal tolerance extremes (Sponsler & Appel, Reference Sponsler and Appel1990; Strack & Myles, Reference Strack and Myles1997) or the moisture requirements (Strikland, 1950; Collins & Richard, Reference Collins and Richard1963; Rudolph et al., Reference Rudolph, Glocke and Rathenow1990), but the relationship of these factors to feeding and tunnelling behaviour is under-investigated (however, see Su & Puche (Reference Su and Puche2003) and Nakayama et al. (Reference Nakayama, Yoshimura and Imamura2005) ). A few field studies are available (for example, Haverty et al. (Reference Haverty, Getty, Copren and Lewis1999) and Houseman et al. (Reference Houseman, Gold and Pawson2001) ), but a further deficiency in current knowledge is any understanding of how the sizes and distributions of woody items in the natural environment might influence foraging activity and, hence, overall termite-mediated C mineralization (Gentry & Whitford, Reference Gentry and Whitford1982; Wang & Powell, Reference Wang and Powell2001).
The line-intersection sampling method (LIS) is a transect-based method of sampling discrete or continuous items distributed within a defined sampling field and can be applied at any scale from the microscopic to the landscape (Kaiser, Reference Kaiser1983). The method has been adapted and applied to areas of research as varied as petrography, quantitative metallography, stereology, biological ultrastructure and forestry (e.g. Warren & Olsen, Reference Warren and Olsen1964; Davy & Miles, Reference Davy and Miles1977; Seber & Peberton, Reference Seber and Peberton1979; Brown & Boyce, Reference Brown and Boyce1998; Kirby et al., Reference Kirby, Reid, Thomas and Goldsmith1998). The introduction of LIS in forestry was made by Warren & Olsen (Reference Warren and Olsen1964) and later improved by van Wagner (Reference van Wagner1968) to allow the estimation of the biovolume of lying woody debris by the measurement of intersections per unit of transect length in predetermined diameter categories. In this application, LIS methods are rapid and generally require only short transect lines, although the biovolume parameter derived is useful only for comparative purposes, and lying wood biomass (dry weight per unit area) and lying wood density (dry weight per unit volume) are not determined. The main modifications introduced in the present study were the addition of assessments of termite and fungal attack, and of live termite occupancy, in addition to woody item diameter.
The present study quantitatively assesses patterns of attack by the subterranean termite, Reticulitermes grassei (Nobre et al., Reference Nobre, Nunes, Eggleton and Bignell2006), in relation to wood dimensions and the level of wood degradation by fungi, as well as reporting on the seasonality of feeding. We used methods developed for the more species-rich tropical forest environment (Eggleton et al., Reference Eggleton, Bignell, Sands, Mawdsley, Lawton, Wood and Bignell1996; Davies et al., Reference Davies, Eggleton, Dibog, Lawton, Bignell, Brauman, Hartmann, Nunes, Holt and Rouland1998), which are applied in the temperate Mediterranean forest setting for the first time.
Materials and methods
Field site
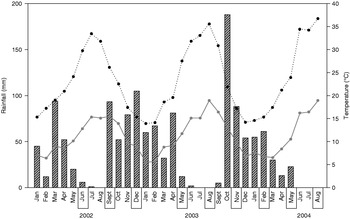
The field site was a privately owned and managed 4.6 ha silvicultural plantation of Eucalyptus globulus Labill, located in Peroguarda (Beja) (38°11′05N; 8°04′33W, alt. 160 m asl). A meteorological station located at Ferreira do Alentejo (Beja) (38°20′60N; 8°10′60W, alt. 232 m asl) provided local climatic data. Total rainfall and the average maximum and minimum temperatures during the sampling period are presented on fig. 1. No silvicultural interventions were made during the study period (June 2002–August 2004).
Monthly average minimum temperature, maximum temperature and total rainfall for meteorological station of Beja over the sampling period ( , daily average rainfall; □, sampling months; - -•- -, maximum average temperature;
 , minimum average temperature).

Assessment of lying dead wood
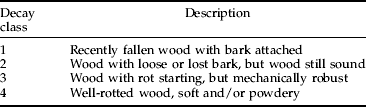
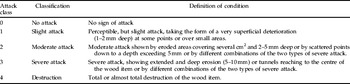
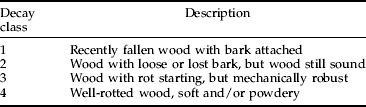
Three large quadrats, measuring 30×30 m, were randomly positioned within the woodland site. Each quadrat was then sampled for lying dead wood and termites, by placement of randomly orientated transect lines of 20 m each. The diameter of each item of lying dead wood intersecting with the lines was measured with callipers (accuracy of ±1 mm), and the items then allocated to decay and termite attack classes (as itemised in tables 1 and 2) and examined for live termite occupancy. Twigs <5 mm in diameter were not included in this study. The decay classes indicate the decomposition state of the item, excluding decomposition by termites or other arthropods excavating galleries parallel with the grain (and, therefore, refer mainly to fungal decay, which has characteristic patterns of colouration and cross-grain fracture). The classification adopted had as notional scale the system of the European Standard EN252 (1992) but adapted to naturally fallen wood (and, therefore, excluding the last class of EN252, which refers to mechanical failure of the wooden stakes, as this standard was developed to evaluate the effectiveness of a wood preservative in contact with the ground). Live termite occupancy was recorded as presence/absence.
Decay classes used in the characterization of lying dead wood at the intersection point with the line transect.
Termite attack classes used in the characterization of lying dead wood (as in EN252) at the intersection point with the line transect.

At each sampling period eight transects (of 20 m) per quadrat (30×30 m) were made at intervals ranging from two to five months between May 2002 and August 2004 (with two exceptions, September 2002 and August 2004, when severe weather only allowed the accomplishment of five transects per quadrat). With the line-intersection method, it is possible to estimate dead wood biovolumes without making length measurements of individual items (Warren & Olsen, Reference Warren and Olsen1964; Kirby et al., Reference Kirby, Reid, Thomas and Goldsmith1998). The total wood debris volume is given by:

where V=total volume of fallen logs per hectare (m3 ha−1); n=number of logs intersected; d=average diameter of the wood pieces (m); t=total length of the transect (m); the power term 104 is needed to convert the units of biovolume from m3 m−2 to m3 ha−1.
Assumptions of the method
It is unclear what pattern of distribution of woody litter would be expected a priori in a single-species tree plantation of the type sampled here. Inspection of practically any woodland suggests that small items are very abundant, medium sized items rare by comparison and large items very rare. The common application of the line intersection method uses size classes for the assessment of diameter of the items intersected, avoiding the need to measure every item exactly. As expected, the sampled area was dominated by very small items, with larger wood pieces much less common. However, the larger items do have a higher impact on the biovolume estimations, and they should be measured adequately to assure the accuracy of the overall result (van Wagner, Reference van Wagner1982). On the other hand, because of the smaller dimensions of the great majority of the lying dead wood items, the a priori allocation of the items to non-skewed size classes, with only a representative mean for each class, might have resulted in the loss of valuable information. Therefore, field data included the actual diameter of each woody item, and these were subsequently grouped into classes for analytical purposes.
For biovolume estimations, the main assumption of the method concerning the diameter of the wood items is that they should have a circular cross-section. This is true for the majority of the woody items encountered (as they constitute small branches and twigs); but, when items with obviously non-circular cross-section were encountered, the average of greatest and least diameter was used. The LIS also assumes a random orientation of the items (e.g. van Wagner, Reference van Wagner1982). Orientation bias (pieces lying in a preferential direction) might occur in the sampled area as a consequence of windfall. To account for this possibility, transect lines were orientated randomly and, therefore, ran in more than one direction. Likewise, all values presented are means of the values encountered in the three quadrats and, therefore, considered to be a better estimation for the whole field site, as it further minimizes any bias due to the uneven distribution of the fallen wood. The biovolume equation used in this and previous studies of lying dead wood also assumes that the wood items are horizontal, and this was favoured by the intrinsic topography of the site, which was flat and lacked ditching within the woodland. The length of the transect line is not critical as long as transects are placed randomly and the overall sampling effort (=combined length of all lines employed) is sufficient to include all size classes of woody items in the database.
Calculations and statistical analysis
Wood biovolume calculations were made for each decay class, termite attack class and occupancy class. As the number of transects deployed was not equal across sampling periods, the frequency data were made relative to transect units (i.e. items m−1). To explore the relation between the diameter of the logs, decay class and termite attack class (hereafter referred to as attack class), a multivariable correspondence analysis was performed. The analysis was performed on ANDAD 7.12 (Sousa & Sousa, Reference Sousa and Sousa2000).
A chi-square test for degree of fit was used to test for statistical independence of decay and size classes, attack and size classes and between decay and attack classes (all performed per sampling period). Then the data were further analyzed for the trend between diameter of the wood materials and the proportion of wood items with signs of termite activity, through a regression analysis. The occupancy by living termites of wood items on the surface was evaluated and a growth function was fitted to search for any trend between occupied biovolume and total monthly rainfall.
Results
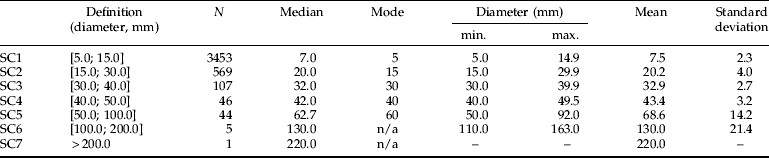
The lying dead wood available in the field site was mainly of small dimensions, consisting of minor eucalyptus twigs with bigger branches sampled relatively rarely. The size classes defined are given in table 3.
Woody items intersected cumulatively by the line transect, allocated to seven diameter classes.
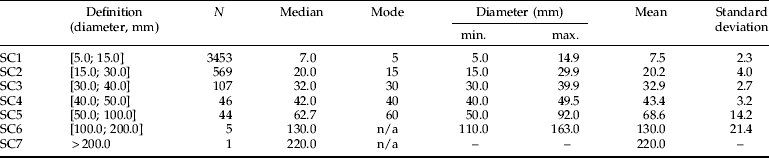
N, corresponds to the total number of wood items intersected. The median, mode and mean shown are of the total sampled in three separated large quadrats of 30×30 m, with 5–8 transects per quadrat on nine sampling occasions between May 2002 and August 2004. The minimum and maximum diameters correspond to the observed values.
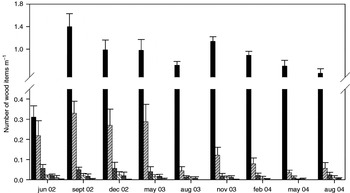
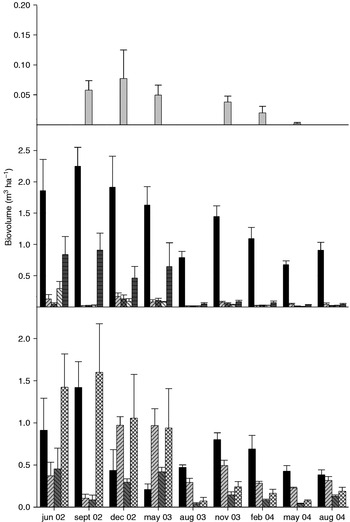
An increase in the lying woody items (as number of items m−1) was observed in the sampling period following the hot summer seasons (fig. 2). Most of the items were then not only of small diameter, but also recently fallen (the biovolume of decay class 1 increased by 56% in September 2002 and 70% in November 2003 when compared with the previous sampling; fig. 3). Likewise, these small, freshly fallen wood items had no signs of termite attack (biovolume of attack class 1 increased by 21% in September 2002 and 83% in November 2003) (fig. 3). The estimated biovolume of lying dead wood is also presented in fig. 3 and characterized in terms of decay and termite attack classes, as well as the presence of living termites. The quadrats were not homogeneous (error bars in fig. 3 correspond to the standard error of the averages of the three quadrats); and, therefore, to characterize the site as a whole, the mean values (n=3) were used.
Mean number of logs, allocated to size classes, intersected per metre of transect (±SE) at intervals between May 2002 and August 2004 (■, SC1; , SC2;  , SC3;
 , SC4;
 , SC5;
 , SC6).

Estimated lying dead wood biovolume (m3 ha−1) in different attack and decay classes and of wood with live termites at intervals between May 2002 and August 2004. The bars show the SE [( , live termites occupancy), (attack classes (table 2), [■, ACO; , AC1; , AC2; , AC3; , AC4]), (decay classes (table 1), [■, DC1; , DC2;
 , DC3;
 , DC4])].

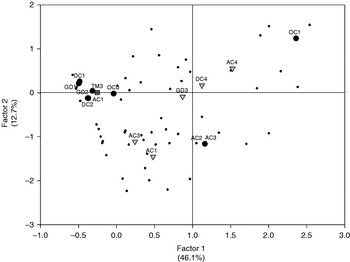
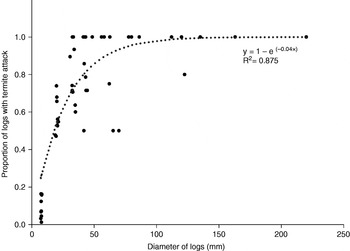
For multivariate component analysis, and thus to explore the relation between diameter of the logs, decay and attack classes, new size groups had to be defined with equal frequencies (table 4). The first two principal components extracted from the multivariable component analysis explained 59% of the data variance encountered (fig. 4). The first component was correlated with the larger-sized logs, higher decay class (DC4) and higher attack (AC4), which also appeared associated with each other and with the presence of live termites (OC1). The second component extracted was correlated with decay class 3 and the intermediate attack classes (AC1, AC2 and AC3). Supplementary variables related to climatic conditions, dated to ten days before the sampling took place, were also assessed but only the high temperatures were well represented in the first principal component and grouped with the lower decay classes (DC1 and DC2), with no termite attack and with no live occupancy. A Chi-squared test for goodness of fit, made for each sampling period, showed significant differences (χ2<0.05) in the distribution of decay classes per size class of the logs in all cases. The small twigs (diameter <30 mm) sampled were, in general, characterized by almost no fungal decay, presumably because they largely correspond to recently fallen woody items. Woody items with higher diameters had a higher level of fungal decay than expected assuming a Poisson distribution. For wood degradation by termite attack, the pattern was similar and also significant (χ2<0.05), again with smaller items in general not attacked and bigger logs with high levels of attack. A trend line existed between the proportion of samples with signs of termite activity per transect metre and the diameter of the wood (fig. 5).
Scatter plot of the correspondence analysis performed on woody diameter, decay class, attack class and climatic conditions, showing the factor loadings and the relation of the different variables. (•, representation of individual logs; •, variables that contributed for the axis formation;  , other variables used in the analysis; , supplementary variable high temperature [20; 30]°C (TM3); DC, decay classes (as in table 1); AC, attack classes (as in table 2); GD, wood group classes (as in table 4)).

Fitted relationship between diameter of wood and live termite presence. Cumulative data in the different sampling periods in which each point represents the average diameter of each size class and the proportion of logs on that respective size class with termite attack.


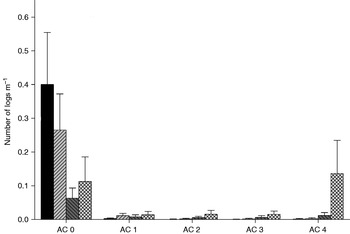
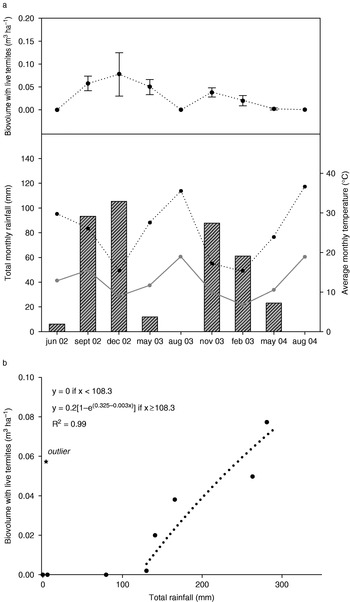
Signs of termite attack were more often observed in wood items with higher levels of decay (fig. 6). The dispersion of the data, clearly shown in the figure, highlights the heterogeneity of the field site and, probably, a clustered distribution of the larger woody items. A chi-square test for goodness of fit, made for each sampling period, showed significant differences (χ2<0.05) in the distribution of attack classes per decay classes. The maximum proportion of wood biovolume with live termites was estimated at ca. 3% in December 2002. A cause/effect relationship may have existed between the total rainfall between sampling periods and the biovolume of wood with living termites (fig. 7).
Logs per metre of transect allocated in each decay class (DC) and termite attack class (AC). Cumulative data, with bars showing SE. (■, DC1; , DC2; , DC3; , DC4).

Climatic conditions and the presence of living termites in the lying dead wood.
(a) Monthly temperature and rainfall together with wood biovolume containing termites (- - -•- - -, living termites) (
 , total rainfall; –•–, Tmin; , Tmax).
(b) Relationship between rainfall (in the last ten days before sampling) and wood biovolume containing live termites.

Discussion
The distribution of lying dead wood in the field site was solely the result of natural processes prevailing there as no maintenance, pruning, brashing, tidying or other interventions were performed. An increase in surface woody items was observed after the summer season, due mainly to small twigs and branches brought down by wind action after the dryer and hotter period. Despite the abundance of small woody items, termite attack seems concentrated on the larger material with greater diameters. The largest woody item found was less than 22 cm in diameter, corresponding to a whole fallen tree trunk. Only 11 wood items were encountered in the largest size category (diameters >10 cm), accounting for 0.2% of the total number of wood logs sampled. It remains a matter of speculation whether the apparent scarcity of larger woody items might be limiting on overall termite activity.
The selection of larger wood items by subterranean termites was also observed by Wang & Powell (Reference Wang and Powell2001) in a forest in Mississippi. Jones et al. (Reference Jones, Nalepa, McMahan and Torres1995) found that drywood termite colonies (Kalotermitidae) on Mona Island (Puerto Rico) attain greater sizes in larger pieces of dead wood, which was in accordance with the hypothesis of Lenz (Reference Lenz, Hunt and Nalepa1994) that the size of mature drywood termite colonies is positively correlated with food resource size. Furthermore, for Reticulitermes flavipes, it was found that every increase in food resource volume attracted larger numbers of termites (Lenz et al., Reference Lenz, Kard, Mauldin, Evans, Etheridge and Abbey2000). Abe (Reference Abe, Kawano, Connel and Hidaka1987), in his classic theory of termite life types, proposed that the simultaneous use of large woody items by termites as a substrate and a colony centre was ultimately limiting on colony growth, such that there was an evolutionary trend towards a foraging style of feeding in which resources were exploited facultatively from a permanent nest (the so-called ‘separate-type’ life history). By this measure, Reticulitermes is already advanced, despite being a lower termite with flagellate mutualists; but it does not seem to have adopted the specialization for feeding on the small woody litter shown by some members of high-diversity termite assemblages, for example those of humid tropical forests and wetter savannas (see Johnson et al., Reference Johnson, Lamb, Sands, Shittu, Williams and Wood1980).
Larger wood items, although less abundant in the sampled area, are better food sources in the sense that they represent a higher quantity of cellulose, which will provide food for the colony for a longer period, reducing the need for additional foraging. They also provide a more stable microhabitat, retaining moisture for longer periods during dry conditions. A reduction in foraging when larger wood was available as well as an increased rate of consumption when the wood volume increased were observed in the Formosan subterranean termite (Coptotermes formosanus) in a laboratory experiment (Hedlund & Henderson, Reference Hedlund and Henderson1999). The results obtained by Su & Puche (Reference Su and Puche2003) confirm that subterranean termites prefer moist substrates to dry ones. Moisture availability is vital to termites, as they are thin-skinned insects that quickly dry out when exposed to the desiccating effects of wind, strong sunshine or dry air, and therefore they require a constant supply of moisture as well as a cryptic habit. This requirement is reflected in the gallery system and by the habit of many termite species of building epigeal covered runways and sheeting (to sustain high humidity while foraging). Rudolph et al. (Reference Rudolph, Glocke and Rathenow1990) found Mediterranean Reticulitermes to be amongst the most sensitive termites in their responses to water loss, particularly R. lucifugus s.l. (Becker, Reference Becker1970).
A priori and, unless the ground is inundated with excess of water (which did not occur in the field site during the study period), increasing rainfall should provide a higher moisture content in the soil, promoting foraging until a plateau is reached as well as topping-up the moisture reserves of the larger woody items. This stabilization level in foraging activity is the balance between the size and/or maturity of colonies and their need for resources. The occupancy of lying dead wood by termites shows a threshold response to cumulative rainfall, at which point activity in surface logs started to be observed (in this specific case, when the total rainfall was ca. 100 mm over a period of ten days before the sampling). The humidity of the soil was considered by Becker (Reference Becker1970) to be more critical for the viability and feeding capacity of Reticulitermes than the humidity of the wood on which they fed.
The present study clearly showed that decay classes were unevenly distributed between woody item size categories. The tendency of larger wood materials to maintain moisture, which is attractive to termites, should also enhance fungal colonization and growth. As both groups of organisms are observed exploiting the same resource, there is not prima facie evidence of any antagonistic relationship. However, there are many suggestions that wood rotted by microorganisms can play an important role in the diet of termites and be attractive to termite foragers (Lenz et al., Reference Lenz, Amburgey, Zi-Hong, Mauldin, Preston, Rudolph and Williams1991; Rouland-Lefèvre, Reference Rouland-Lefèvre, Abe, Bignell and Higashi2000). Further studies are needed to understand the relationship between decay and termite attack on wood and to identify specific decomposer groups and abiotic factors involved in this specific interaction. Based on field and laboratory experiments, Esenther et al. (Reference Esenther, Allen, Casida and Shenefelt1961) suggested that subterranean termites might follow a concentration gradient of chemical cues to find decaying wood, therefore, implying that fungi may attract termites and stimulate gallery building. Decay by certain fungi, especially in initial stages, is thought to improve the nutritional status of wood for termites (Becker, Reference Becker1970). Further studies, therefore, are needed to investigate whether the observed relationship between decayed and termite-attacked wood is a result of a positive interaction.
Published estimates of termite wood consumption rates range from 6 to 270 mg per termite per day (dry weight basis: Wood, Reference Wood and Brian1978; Wood & Sands, Reference Wood, Sands and Brian1978; Bignell & Eggleton, Reference Bignell, Eggleton, Abe, Bignell and Higashi2000), a difference of more than one order of magnitude. However, these are based on only a small number of individual studies, none of which were conducted outside the tropical or sub-tropical zones (Bignell & Eggleton, Reference Bignell, Eggleton, Abe, Bignell and Higashi2000). Estimates of population respiration rates in moist savanna systems, the most thoroughly investigated, suggest that roughly 20% of C mineralization could be attributed to termites (Wood & Sands, Reference Wood, Sands and Brian1978; Collins, Reference Collins1981), but this is equivalent to the consumption of 55% of surface litter, including about a quarter of the standing crop of dry grass. In semi-arid systems, the proportion of litter removed by termites may be even higher, up to 90% or 100% in particular sites (Bodine & Ueckert, Reference Bodine and Ueckert1975; Buxton, Reference Buxton1981), although the process is slow (Lee & Butler, Reference Lee and Butler1977; Bodine & Uekert, Reference Bodine and Ueckert1975; Buxton, Reference Buxton1981, reviewed by Bignell & Eggleton, Reference Bignell, Eggleton, Abe, Bignell and Higashi2000). In most tropical forests, C fluxes are dominated by the metabolism of the trees, and the relative contribution of termites is small, although termite abundance and biomass may be higher than in savannas (Bignell et al., Reference Bignell, Eggleton, Nunes, Thomas, Watt, Stork and Hunter1997). However, it was still possible for Matsumoto & Abe (Reference Matsumoto and Abe1979) to estimate that the termites of Pasoh Forest (Malaysia) consumed more than 30% of tree leaf litter.
There is, thus, often a high visibility to termite feeding activity, although its importance in terms of overall terrestrial decomposition processes is rather variable. Almost no information exists on the partitioning of C mineralization between termites and other (largely microbial) decomposers in any ecosystem although fungi would be expected to make a very significant contribution where moisture conditions permit. A useful summary of the consumption role of termites in African savannas is given by Deshmukh (Reference Deshmukh1989), who argued that the drier the ecosystem the more the relative consumption of litter by termites compared with other agents. By contrast, foraging in wetter savannas and humid tropical forests appears to peak in the dry seasons (Lepage, Reference Lepage1983). Foraging patterns, therefore, may be determined by local conditions, with moisture conditions being the major influence on the timing and extent of activities.
Conclusions
Subterranean termites are apparently significant wood decomposers in the temperate Mediterranean forest system studied, with an average of approximately 30% of dead wood items showing signs of attack by the single species available.
Subterranean termites select wood with larger diameter, with an apparent preference for material already decayed by fungi. Alternatively, both termite and fungal attack on wood may be promoted by higher moisture levels, such as prevail in larger litter items and during seasonal rains. These findings have practical significance for termite control and baiting studies, as they can improve understanding of the probability of termite attack on woody materials.
Acknowledgements
We thank João Cappas e Sousa for making the field site available to us. The work was partially supported by a grant given by the Portuguese Foundation for Science and Technology (SFRH/BD/8761/2002). We are grateful to Amélia Soares, Joaquim Paulo Fernandes, José Luís Louro and Laura Santos for technical assistance.