I. INTRODUCTION
Control rods are very important in both operating and accident conditions because the nucleon reactivity must be controlled to safely operate a nuclear reactor. Reference Kim, Joung, Lee, Kim and Sohn1,Reference Franceschini and Petrovic2 The advantages of using gray control rods to control nuclear reactivity are that they greatly reduce the daily dealing with reactor coolant, distinctly simplify the chemical and tolerant control system and its operation, significantly decrease high expense for short time change, and also make the nuclear reactor safer. The gray control rods will provide nuclear reactivity control for both load following process and full power operation, Reference Carelli, Paramonov, Miller, Lombardi, Ricotti, Todreas, Greenspan, Yamamoto, Nagano, Ninokata, Robertson and Oriolo3 which have been successfully applied in the AP600/AP1000 nuclear power plants designed by Westinghouse Corporation. Reference Onoue, Kawanishi, Carlson and Morita4
The key to gray control rods controlling and adjusting nuclear reactivity is in their internal neutron absorbers, which can be prepared from bulk with elemental boron, materials with lanthanide such as Tm, Dy and Tb, Ag–In–Cd alloys, tungsten and silver and their alloys. Reference Drudi, Carlson, Connor, Gordon Mansfield, Hoorn, Lang, Parkinson and Bhomer Leiah5,Reference Lu, Tang, Li, Yang, Li, Ding, Zhu and Liu6 Boron carbide bulk is not suitable as the neutron absorber used in gray control rods because of large neutron absorption cross section of boron element and large radiation swelling caused by (n, a)-reactions, void formation, and gas bubble growth. Reference Risovany, Klochkov and Varlashova7 In fact, Dy2TiO5 materials have been used as neutron absorbers in the control rods in nuclear power plants such as MIR and VVER-1000 RCCAs, Reference Risovany, Klochkov and Varlashova7,Reference Risovany, Varlashova and Suslov8 which utilizes the nuclear characteristics of the chemical element dysprosium. The natural dysprosium consists of five stable isotopes with high thermal neutron absorption cross section. The decay products are Ho and Er, which are also able to absorb neutrons. All of the radionuclides have low gamma activity and short half-life periods. The neutron absorption cross sections of dysprosium isotopes range from 130 to 2600 barns. The region of resonance absorption is 1.6–25 eV, in which the absorption cross section can reach approximately 1000 barns. Reference Kermit and Theilacker9 However, the effective ability of neutron absorption will decrease with increasing service time. Other lanthanide elements such as terbium are needed to a reinforcement component to balance the neutron absorption ability to keep the stability of the nuclear reaction.
Ag–In–Cd alloys are usually used in black control rods because of their strong neutron absorbing ability. If they were used in gray control rods, the nuclear reactivity worth of gray control rod assemblies drops to approximately 80% of its initial value after running five years, which no longer meet the control condition of mechanical shim mode. The gray control rod assembly must be then replaced by a new one. Therefore, Ag–In–Cd alloys are not appropriate as neutron absorbers in gray control rods.
According to the in-service condition of gray control rods, a material with excellent stable neutron absorptivity, good thermo-physical properties, high resistance of neutron radiation, and other outstanding performance can be used as the neutron absorber in gray control rods. After nucleon calculation, nuclear property assessment, and burnup analysis, Fe–Tb4O7–Dy2O3 composites are excellent candidates for using as neutron absorbers in gray control rods. Meanwhile, the size factor and fabricability of neutron absorber pellets in a practical application must also be considered. Actually, the effective ability of neutron absorption of Tb element increases with in-service time increase, while an opposite trend is found for Dy element. Therefore, a long-time stable neutron absorption ability of Fe–Tb4O7–Dy2O3 composites with a certain chemical composition ratio will be obtained. Moreover, Fe-based materials have been widely used in many fields based on their excellent properties. Reference Trudeau, Schulz, Dussault and Van Neste10 Iron-based Tb4O7–Dy2O3 composites are designed and considered as excellent neutron absorbers based on its excellent characteristics of Fe component such as high melting temperature, high temperature strength, and excellent thermal conductivity. Especially, Fe has an outstanding ability of irradiation resistance. Pure iron was irradiated in the range of 2–15 × 107 dPa/s at 345–650 °C to very high neutron doses in the BOR-60 and BN-350 fast reactors, which was used to study void swelling and variation of mechanical properties. Reference Budylkin, Mironova and Chernov11 The results indicated that iron was not obviously affected by transmutation products because much less helium was generated. Meanwhile, thermal neutron absorption cross section of Fe (2.3 barns) is much smaller than that of 159Tb (23.3 barns) and 161Dy (600 barns), which has little effect on the behavior of nuclear characteristics of Tb and Dy elements during long-time burnup. Reference Baum, Ernesti, Knox, Miller, Waston and Travis12
In the designed Fe–Tb4O7–Dy2O3 powder mixtures, both Tb4O7 and Dy2O3 are rare earth oxides with same crystalline structure. To fully understand the microstructural evolution of Tb4O7 and Dy2O3 in the powder mixtures during ball milling and then sintering, a separate investigation of Fe–Tb4O7 and Fe–Dy2O3 powder mixtures must be first conducted. Especially, the Tb4O7 will be transformed to Tb2O3 during the sintering process. Reference Ushakov, Heleanal, Nanrotskyal and Boatnera13 Therefore, in the present work, the microstructural evolution of Fe–Dy2O3 powder mixtures during ball milling will be investigated in detail. Actually, metal-based ceramic composites are usually prepared by ball milling and sintering, because high-energy ball milling is an efficient method to obtain homogenous powder mixtures with nanocrystalline size that have excellent sintering ability, low-sintering temperature, and a tendency for the density increase. Reference Ferkel and Hellmig14 Meanwhile, the microstructure evolutions such as crystal structure transformation, amorphization, formation of new compounds and solid solution will be probably occurring during ball milling.
Therefore, in the present work, the microstructural evolution and kinetics of Fe–Dy2O3 powder mixtures during ball milling were investigated. Meanwhile, the corresponding mechanism was also analyzed and discussed. The current experimental results can provide sufficient support for subsequent research of triple components of Fe–Tb4O7–Dy2O3 powder mixtures.
II. EXPERIMENT
The powders of Dy2O3 (99.6% purity) and Fe (99.9% purity) with an average particle diameter of 5 μm and 38 μm, respectively, were used as raw materials. The raw powders of both Fe and Dy2O3 were purchased from Beijing HWRK Chem Co., Ltd. (Beijing, China). Fe–25.68 wt% Dy2O3 (mass fraction, %) powder mixtures were milled in a SFM-1 high-energy planetary ball mill at room temperature under argon atmosphere. The mass fraction of Fe–25.68% Dy2O3 was equal to the molar fraction of Fe–4.92% Dy2O3. Stainless steel balls of 5 mm diameter were used as the milling media and stainless steel vials of 250 mL in volume were used as the milling cans. The ball-to-powder mass ratio was 10:1, and the rotational speed was 380 rpm. No more than 1.5 wt% stearic acid was added in the powder mixtures as a process control agent to prevent the agglomeration of powders during ball milling. A 5 min interval stop was used after running 55 min to prevent excess generated heat that had an obvious effect on the ball-milling procedure. The powder mixtures used for microstructural analysis were extracted from loose powders in the steel can, not from powders adhered to the surface of the stainless balls or the steel can wall.
After various ball-milling times, a small amount of ball-milled powders taken from the steel can were characterized and analyzed by X-ray diffraction (XRD) on a Rigaku Ultima IV X-ray diffractometer (Rigaku Corporation, Tokyo, Japan) with Cu Kα radiation (=0.1540598 nm) and transmission electron microscopy (TEM) on a JEM-2100 instrument (JEOL Ltd., Tokyo, Japan). The ball-milled mixtures were first put in ethyl alcohol, and then adequately dispersed by ultrasonic vibration. A carbon-coated copper grid was used to collect the dispersed powders in ethyl alcohol and then dried by ultraviolet lamp. After that, the prepared samples were observed by TEM instrument. Element mappings of Dy, Ti, and O in a typical ball-milled particle were carried out by energy dispersive spectrometer under the scanning TEM (STEM) mode. The lattice constant of Fe was obtained by Rietveld refinement method in JADE software and the three main diffraction peaks of Fe were applied to calculate the lattice parameter. The grain size was calculated using Suryanarayana and Grant Norton’s formula. Reference Suryanarayana and Grant Norton15
III. RESULTS AND DISCUSSION
A. Phase evolution and microstructure analysis
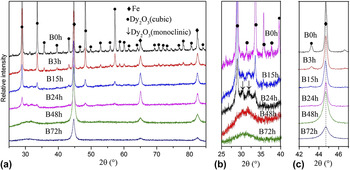
The XRD patterns of Fe–25.68 wt% Dy2O3 powder mixtures milled for different times are shown in Fig. 1(a). In the XRD spectrum of the original powder mixtures, there are the diffraction peaks of Fe with body-centered cubic crystal structure and Dy2O3 with cubic crystal structure. The diffraction peaks of Dy2O3 and Fe are broadened and reduced in intensity with increasing milling time. The broadening of the XRD peaks is associated with the refinement of grain size, lattice distortion, and instrument-induced factor. Reference Vives, Gaffet and Meunier16 After 72 h of ball milling, the diffraction peaks of Fe phase can still be observed, which indicates that Fe phase keeps a crystal structure. Ball milling does not induce Fe phase transform from the crystal to the amorphization. Similar experiment phenomena were also observed in a Co–15 wt% Y2O3 system, in which the diffraction peaks of Co phase could be detected after 52 h of ball milling in spite of the almost disappearance of Y2O3 diffraction peaks, Reference Zhang, Ukai, Hoshino, Hayashi and Qu17 and in a Fe–9 wt% Cr–10 wt% Y2O3 system, in which the diffraction peaks of Fe component could be still observed after 48 h of ball milling although the diffraction peaks of Y2O3 phase disappeared. Reference Toualbi, Ratti, André, Onimus and de Carlan18
XRD patterns of the Fe–Dy2O3 powder mixtures milled for different times at 2θ from (a) 25°–85°; (b) 25°–40°; and (c) 42°–47°.

Meanwhile, ball milling induces the transformation of crystalline structure of Dy2O3 phase from the cubic to the monoclinic as indicated by black arrows in Fig. 1(b). A diffraction hill is also detected, which indicates the formation of amorphous phase during ball milling. The peak of amorphous hill locates at the location of diffraction peak of monoclinic Dy2O3 phase, not at the location of diffraction peak of cubic Dy2O3 phase, which indicates that the formed amorphization derives from the monoclinic Dy2O3 phase, not from the cubic Dy2O3 phase. After further ball milling, the transformation amount is increased. Only a diffraction hill of Dy2O3 phase can be observed at 2θ from 25° to 40° after 72 h of ball milling. Meanwhile, the diffraction intensity of amorphous hill decrease with increasing ball-milling time, which can be attributed to both (i) fragmentation of Dy2O3 amorphization to few nanometer particles because Dy2O3 is belong to brittle component and (ii) dissolution of Dy and O atoms into Fe crystal structure to form a supersaturated nanocrystalline solid solution of Fe (Dy, O). In fact, the atomic radius of Dy is much larger than that of Fe. The dissolution of Dy atoms into Fe crystal structure will induce a large increase of Fe lattice parameter, which will lead to the position shift of diffraction peaks of Fe phase. However, the offset of Fe diffraction peaks shifting to low angle is very small as shown in Fig. 1(c), which indicates that the dissolution amount of Dy atoms into Fe crystal structure is few. In addition, no other diffraction peaks like DyFeO3 phase except for Fe diffraction peaks is detected in the XRD patterns. Therefore, ball milling does not induce the chemical reaction between Fe and Dy2O3. Even if it is true, the amount forming Dy–Fe–O phase like DyFeO3 is very little. In fact, whether alloying occurs or not in a ductile–brittle system depends on the solid solubility of brittle component in ductile matrix. Reference Suryanarayana19 According to the Fe–Dy equilibrium phase diagram, there is a limited solid solubility of Dy atoms in the Fe crystal structure. So alloying between Fe and Dy2O3 is unlikely to happen. Meanwhile, Dy has low effective Debye temperatures, which indicates that Dy atoms located on the Fe particle surface with weak bonds rather than situated inner Fe lattice in an equilibrium conditions.
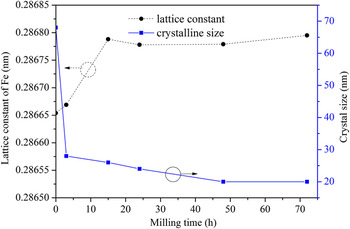
The change of lattice parameter of Fe phase with the ball-milling time increase is indicated by dashed line in Fig. 2. The lattice parameter increases from 0.28665 to 0.2868 nm when the ball-milling time increases from 0 to 72 h. The change rate is about 3.5%. The increment is small, which indicates that the dissolution amount of Dy atoms into Fe crystal structure is few. Because if 8.24 at.% Dy atoms dissolved completely into Fe crystal structure, the lattice parameter of Fe phase should be increased much more. In addition, the lattice parameter increases rapidly at the initial stage and then keeps a constant at the later stage. The present results are different with Bai’s reports that showed Fe lattice parameter increased a lot during ball milling, which was due to the formation of Fe (Al) solid solution in a Al–59 wt% Fe2O3 system. Reference Bai, Xing, Wu, Liu, Huang, Ma and Gao20 However, our results are similar with Toualbi’s results, which indicated the Fe lattice parameter changed only from 0.2868 to 0.286823 nm in a Fe–9 wt% Cr–10 wt% Y2O3 system. The change of Fe lattice parameters was caused by a few dissolution of Y2O3 into Fe crystal structure when the ball-milling time was increased from 0 to 48 h. Reference Toualbi, Ratti, André, Onimus and de Carlan18
Curves of the lattice parameter and crystal size of Fe phase versus the ball-milling time.

The size of Fe grain varied with the ball-milling time is indicated by full line in Fig. 2, which is calculated from Fe phase, not from Dy2O3 phase, because Dy2O3 phase is almost transformed to the amorphization after 48 h of ball milling. The crystal size of Fe phase first decreases rapidly during 0–3 h of ball milling and then reduces slowly after further ball milling, which indicates that further refinement on grain size occurs slowly after extended milling. Especially, Fe grain size almost keeps a 20 nm constant from 48 to 72 h of ball milling. The grain refinement rate of Fe component is roughly logarithmic with the ball-milling time. Similar results were reported by Gaffet Reference Gaffet, Faudot and Harmelin21 that the grain size of Si phase decreased continuously in a Ge–Si system and increased in the grain boundaries.
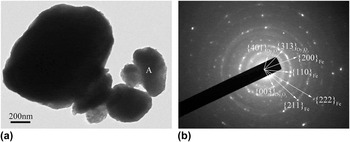
Figure 3 is bright field TEM image and the corresponding selected area electron diffraction (SAED) pattern of Fe–Dy2O3 powder mixtures milled for 48 h. It can be observed that the ball-milled particles with small-sized aggregate to form a large-sized particle as shown in Fig. 3(a), which is due to high active surface energy induced by ball milling. After indexing and analyzing the ring-shaped SAED pattern taken from area denoted by letter “A” in Fig. 3(a), it is indicated that the SAED pattern includes the diffraction of Fe phase with body-centered cubic crystal structure and the diffraction of Dy2O3 component with monoclinic crystal structure. However, the diffraction intensity of SAED pattern of Dy2O3 phase is low, which indicates that the amount of Dy2O3 grain is few. Simultaneously, the diffuse halo indicating the amorphization is also observed in the SAED pattern, which comes from the amorphous Dy2O3 phase that is also proved by the XRD pattern in Fig. 1.
(a) Bright field TEM image and (b) SAED pattern of Fe–Dy2O3 mixtures milled for 48 h.

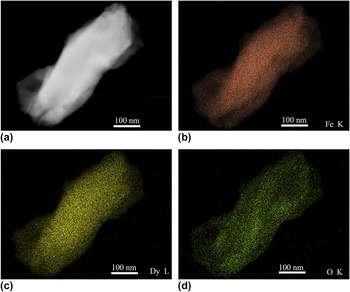
Figure 4(a) is a high angle annual dark field STEM image of Fe–25.68 wt% Dy2O3 powder mixtures milled for 48 h, which shows a rectangle particle with 600 nm size in the long axis direction. Figures 4(b), 4(c), and 4(d) are Fe K, Dy L, and O K element mappings of the particle in Fig. 4(a), respectively. It can be seen that Fe, Dy, and O atoms distribute uniformly in the particles. Every location contains Fe, Dy, and O elements, which demonstrates that the Dy2O3 phase distributes homogeneously in the Fe particle. The chemical homogeneity of the powder mixtures is obtained after 48 h of ball milling.
STEM analysis results, (a) high angle annul dark field STEM image; (b), (c), and (d) element mappings of Fe K, Dy L, and O K in the Fe–Dy2O3 powder mixtures milled for 48 h, respectively.

The powder mixtures are fined, nanocrystallized, and homogenized during ball milling. Meanwhile, many fresh surfaces, lattice defects, and broken bonds are created. Fe–Dy2O3 powder mixtures are consisted of the ductile Fe component and the brittle Dy2O3 component. In the initial stage, the ductile Fe powder particles get flattened by the ball-powder-ball collisions, while the brittle Dy2O3 powder particles get fragmented. These fragmented brittle particles tend to become occluded by the ductile constituents and trapped in the ductile matrix. The brittle constituent is closely spaced along the interlamellar spacings. Reference Suryanarayana19 With further ball milling, the ductile Fe powder particles get work hardened. Then, Fe lamellae get convoluted and refined. The increased defect densities in the Fe phase further enhances the diffusion rates of Dy and O atoms by providing short diffusion paths. The size of grain and particle of Dy2O3 component get further reduced. In the meantime, Dy2O3 is gradually transformed from the cubic to the monoclinic crystal phase and then transformed from the monoclinic phase to the amorphization as shown in Fig. 1(b). The reason can be attributed to the accumulation of structural defects such as vacancies, dislocations, grain boundaries, and antiphase boundaries that cause the destabilization of crystal phase during ball milling. Reference Murty, Naik, Mohan Rao and Ranganathan22 Therefore, when the local distortions reach a critical value, the long-range order of Dy2O3 crystalline structure is destroyed and then transformed to the amorphous phase. The atom arrangement in the amorphous phase is disordered over long distances, but ordered over very short distances. Dy and O atoms exist in the free form in an amorphization system and can diffuse into Fe crystal structure. Meanwhile, fresh surfaces of powder particles created by the repeated welding and fracturing increases with increasing ball-milling time, which makes Fe and Dy2O3 contact in an atomic level. With the ball-milling time increase, the powders of Dy2O3 and Fe become homogeneous mixtures. The high interfacial energy provides the driving force for Dy2O3 decomposition. Finally, all of Dy2O3 particles are completely decomposed into Dy and O atoms. Similar results were reported in Ref. Reference Kimura, Hidaka and Takaki23, which showed that the interfacial energy increased with the refinement of Y2O3 particles and then provided the driving force for Y2O3 decomposition. After further ball milling, Dy and O atoms final uniformly distribute in the ductile Fe particles. There are at least four nearby chemical bonds: Fe–Dy, Fe–Fe, Fe–O, and Dy–O bonds.
B. Kinetics analysis
High-energy ball milling is an extreme and non-equilibrium state powder technology, which is widely used to prepare various types of materials such as supersaturated solid solutions, metastable crystalline materials, quasicrystal phases, nanostructured materials, and amorphous alloys. Reference Suryanarayana19 The thermodynamics in the equilibrium state is not suitably used to explain the microstructural evolution in that extreme environment. The driving force is mainly provided by the mechanical dynamics. Actually, during high-energy ball milling, the impact pressure will easily reach up approximately 10 GPa, which provides the kinetic energy of the fine, homogenization, nanocrystalline, amorphization, decomposition, and dissolution of the powder mixtures.
To calculate the impact pressure, assume that two impacting balls have the same elastic properties, and taking γ = 0.3, the calculation process is shown as follows Reference Timoshenkoo and Goodier24 :
 $$\alpha = 1.23 \times \root 3 \of {{{{P^2}} \over {{E^2}}}{{{R_1} + {R_2}} \over {{R_1}{R_2}}}} \quad ,$$
 $${q_0} = {3 \over 2}{P \over {\pi {\alpha ^2}}} = 1.5\bar q = 0.388\root 3 \of {P{E^2}{{\left( {{{{R_1} + {R_2}} \over {{R_1}{R_2}}}} \right)}^2}} \quad ,$$
where, α is the amount of elastic deformation of two colliding mill balls; P is the compression force under the colliding process; E is Young’s modulus; R
1 and R
2 are the radius of the colliding balls; q
0 is the pressure at the center of the contact surface, which is the maximum pressure of the contact surface; and
 $\bar q$
is the average pressure on the contact surface of two colliding mill balls.
Using the ball radius R 1 = R 2 = 0.0025 m and E = 2.1 × 10¹¹ Pa, Eqs. (1) and (2) can be transformed to the following equations:
 $$\alpha = 3.232 \times {10^{ - 7}}{P^{\,{2 \over 3}}}\quad ,$$
 $${q_0} = 8.78 \times {10^9}{P^{\,{1 \over 3}}}\quad ,$$
 $$P = 5.442 \times {10^9}{\alpha ^{\,{2 \over 3}}}\quad .$$
In the present work, the velocity of the stainless steel balls during ball milling can be taken as v = 2.37 m/s. Reference Gong and Que25 The weight of mill ball is 0.51 g. The calculated impact energy is E k = 2 × 1/2mv 2 = 0.00294 J.
Therefore, the pressure q of two impacting balls can be obtained according to the following integral Eq. (6):
 $${E_{\rm{k}}} = 2\int_0^{{\alpha \over 2}} {P\,{\rm{d}}x} \quad .$$
Using Eqs. (5) and (6), E k is
 $${E_{\rm{k}}} = 2.1768 \times {10^9} \times {\alpha ^{{5 \over 2}}}\quad .$$
According to E
k = 0.00294 J, α can be obtained and is α = 1.787 × 10⁻⁵ m. Therefore, the compression force P can then be calculated and is P = 411 N. According to Eq. (2), q
0 = 8.78 GPa and
 $\bar q = 5.85\;{\rm{GPa}}$
.
Because the atomic radius of the Fe atom and Dy atom is 0.156 and 0.228 nm, respectively, Reference Gu26 so the difference in atomic radium is up to 46.2% of Fe atom radius. In the equilibrium state, it is very difficult for Dy atom dissolution into Fe crystal structure. However, if when the radius of the Dy atom is equal to or less than that of the Fe atom, the Dy atom will easily dissolve into the Fe crystal structure. At high pressure, the radii of the Dy atom and Fe atom will reach the same value. The colliding of two mill balls with high speed can provide that high pressure.
If the radii of the Fe atom and the Dy atom reach the equal value, the pressure should be achieved a certain value. The required pressure is given by the calculation process as follows:
 $${R_{{\rm{Fe}}}}\left( {1 - {\varepsilon _{{\rm{Fe}}}}} \right) = {R_{{\rm{Dy}}}}\left( {1 - {\varepsilon _{{\rm{Dy}}}}} \right)\quad ,$$
where
 ${\varepsilon _{{\rm{Fe}}}} = {q \over {{E_{{\rm{Fe}}}}}}$
,
 ${\varepsilon _{{\rm{Dy}}}} = {q \over {{E_{{\rm{Dy}}}}}}$
. Therefore, Eq. (9) can be rewritten as follows:
 $${R_{{\rm{Fe}}}}\left( {1 - {q \over {{E_{{\rm{Fe}}}}}}} \right) = {R_{{\rm{Dy}}}}\left( {1 - {q \over {{E_{{\rm{Dy}}}}}}} \right)\quad ,$$
where R Fe and R Dy are the initial atom radii, R Fe = 0.156 nm and R Dy = 0.228 nm; q is the pressure; E is the bulk elastic modulus, E Fe = 170 GPa and E Dy = 41 GPa; and ε is the amount of strain. According to Eq. (9), q can be obtained and q = 15.51 GPa.
The calculated results indicate that the radii of the Fe atom and the Dy atom will become equivalence when the pressure reaches up to 15.51 GPa. But in fact, the 15.51 GPa pressure is difficultly obtained in the present work. The average pressure value q 0 is 8.78 GPa as mentioned above. Therefore, it is difficult to induce a lot of Dy atoms to be diffused into Fe crystal structure by ball milling. The dissolution amount of Dy atoms is few, which is also proved by XRD patterns in Fig. 1(c). Certainly, at the above discussion, the calculation is an ideal condition. Actually, the collision of two balls is random. The values of collisional pressure are a Gaussian distribution and the maximum pressure q 0 can over the q value, which will induce the radius of Dy atom to reach that of Fe atom. Meanwhile, a large amount of mechanical energy is transformed into intrinsic energy in the Fe–Dy2O3 mixtures, which induces the formation of numerous defects in the Fe crystal structure, such as vacancies, interstitials, cavities, and dislocations, which are always in a non-equilibrium state. The defects and structural disorders will increase the mobility of Dy atom diffusion. Therefore, after a long time ball milling, a few Dy atoms can dissolve into Fe lattice structure.
IV. CONCLUSIONS
The microstructural evolution of Fe–25.68% Dy2O3 (mass fraction, %) powder mixtures during ball milling was investigated by using XRD and TEM. The experiment results can be made as:
-
(1) During the whole ball mining process, a rapid decrease in Fe grain size was observed over the initial time period, while a constant value was presented in the later stage, resulting in a final size of about 20 nm. The grain refinement rate of Fe component was roughly logarithmic with the ball-milling time. Fe lattice parameter increased from 0.28665 nm to 0.2868 nm when the ball-milling time increased from 0 to 72 h.
-
(2) Ball milling induced the transformation of Dy2O3 phase from cubic to monoclinic crystal structure and then to amorphization. After 72 h of ball milling, Dy2O3 phase completely transformed to the amorphization. A few Dy atoms dissolved into Fe crystal structure, which was induced by the mechanical kinetics. After 48 h of ball milling, the homogenous powder mixtures of the supersaturated nanocrystalline solid solution of Fe (Dy, O) and Dy2O3 amorphization were formed and the elements of Fe, Dy, and O distributed uniformly in the ball-milled particles.
ACKNOWLEDGMENT
The work was supported by the National Natural Science Foundation of China, through Grant No. 11305136.