1 Introduction
During the last decades the chirped pulse amplification method (Strickland & Mourou Reference Strickland and Mourou1985; Mourou, Tajima & Bulanov Reference Mourou, Tajima and Bulanov2006) enabled laser systems to undergo a rapid power increase. Once the laser intensity exceeds  ${\sim}10^{18}~\text{W}~\text{cm}^{-2}$ then an isotropic proton emission is observed from the laser interaction with a flat foil (Maksimchuk et al. Reference Maksimchuk, Gu, Flippo, Umstadter and Bychenkov2000), with proton energies exceeding
 $1~\text{MeV}$. Recently, two groups approached the
 $100~\text{MeV}$ proton energy threshold (Kim et al. Reference Kim, Pae, Choi, Lee, Kim, Singhal, Sung, Lee, Lee and Nickles2016; Higginson et al. Reference Higginson, Gray, King, Dance, Williamson, Butler, Wilson, Capdessus, Armstrong and Green2018) by using a
 ${\sim}5\times 10^{20}~\text{W}~\text{cm}^{-2}$ intensity laser but at the cost of using nanometre-thickness targets which hardly survive the interaction with the finite contrast prepulse of multi-PW laser systems available in the near future (Rus et al. Reference Rus, Batysta, Čáp, Divoký, Fibrich, Griffiths, Haley, Havlíček, Hlavác, Hřebíček, Silva, Korn, Gizzi, Edwards and Hein2011; Zamfir Reference Zamfir2012; Bashinov et al. Reference Bashinov, Gonoskov, Kim, Mourou and Sergeev2014; Zou et al. Reference Zou, Le-Blanc, Papadopoulos, Cheriaux, Georges, Mennerat, Druon, Lecherbourg, Pellegrina and Ramirez2015).
In contrast with conventionally accelerated proton beams, laser-driven proton beams contain a high number of particles generated in a time comparable to the laser pulse duration, although the divergence of the beam is of  ${\sim}30^{\circ }$ full angle (Daido, Nishiuchi & Pirozhkov Reference Daido, Nishiuchi and Pirozhkov2012; Macchi, Borghesi & Passoni Reference Macchi, Borghesi and Passoni2013). However, the reduced cost of laser-driven proton beams make them extremely attractive to several existing and/or proposed applications, including the fast ignition of thermonuclear fusion targets (Roth et al. Reference Roth, Cowan, Key, Hatchett, Brown, Fountain, Johnson, Pennington, Snavely and Wilks2001; Atzeni, Temporal & Honrubia Reference Atzeni, Temporal and Honrubia2002), hadron therapy (Bulanov & Khoroshkov Reference Bulanov and Khoroshkov2002; Bulanov et al. Reference Bulanov, Daido, Esirkepov, Khoroshkov, Koga, Nishihara, Pegoraro, Tajima and Yamagiwa2004; Murakami et al. Reference Murakami, Hishikawa, Miyajima, Okazaki, Sutherland, Abe, Bulanov, Daido, Esirkepov and Koga2008; Bulanov et al. Reference Bulanov, Wilkens, Esirkepov, Korn, Kraft, Kraft, Molls and Khoroshkov2014; Kurup et al. Reference Kurup, Pasternak, Taylor, Murgatroyd, Ettlinger, Shields, Nevay, Gruber, Pozimski and Lau2019), isotope production (Santala et al. Reference Santala, Zepf, Beg, Clark, Dangor, Krushelnick, Tatarakis, Watts, Ledingham and McCanny2001), material sciences (Boody et al. Reference Boody, Höpfl, Hora and Kelly1996) and proton imaging (Borghesi et al. Reference Borghesi, Campbell, Schiavi, Haines, Willi, MacKinnon, Patel, Gizzi, Galimberti and Clarke2002, Reference Borghesi, Romagnani, Schiavi, Campbell, Haines, Willi, Mackinnon, Galimberti, Gizzi and Clarke2003). Specifically, for cancer therapy,
 ${\sim}250~\text{MeV}$ protons are required to treat a patient, setting a socially accepted minimum proton energy boundary.
A laser beam that mimics the planned High-Repetition-Rate Advanced Petawatt Laser System (HAPLS) in the Extreme Light Infrastructure (ELI) Beamlines (Rus et al. Reference Rus, Batysta, Čáp, Divoký, Fibrich, Griffiths, Haley, Havlíček, Hlavác, Hřebíček, Silva, Korn, Gizzi, Edwards and Hein2011), Czech Republic, is assumed for studying the processes discussed in this work. It is estimated that HAPLS will deliver  $30~\text{J}$ energy within
 $27~\text{fs}$ pulse duration at full width half-maximum (FWHM), resulting in a peak power of
 $1~\text{PW}$, while the central wavelength,
 $\unicode[STIX]{x1D706}$, of the laser radiation equals
 $815~\text{nm}$. The focal spot diameter is assumed to be
 $4.75~\unicode[STIX]{x03BC}\text{m}$ FWHM, which corresponds to a peak intensity of
 $5.2\times 10^{21}~\text{W}~\text{cm}^{-2}$. The resulting amplitude of the maximum electric field is
 $1.98\times 10^{14}~\text{V}~\text{m}^{-1}$ (corresponding to a dimensionless amplitude,
 $\unicode[STIX]{x1D6FC}_{0}$, of
 ${\sim}50$) and its spatial extent of
 $6.72~\unicode[STIX]{x03BC}\text{m}$ FWHM, equals
 ${\sim}8\unicode[STIX]{x1D706}$.
1.1 Acceleration mechanisms
The most well-known laser driven ion acceleration mechanism is the target normal sheath acceleration (TNSA) (Wilks et al. Reference Wilks, Langdon, Cowan, Roth, Singh, Hatchett, Key, Pennington, MacKinnon and Snavely2001; Passoni, Bertagna & Zani Reference Passoni, Bertagna and Zani2010; Daido et al. Reference Daido, Nishiuchi and Pirozhkov2012; Macchi et al. Reference Macchi, Borghesi and Passoni2013) which dominates at intensities of  $10^{20}~\text{W}~\text{cm}^{-2}$ and requires the incidence of a finite contrast laser pulse on a thick (in the micrometre range) flat foil, where the electron number density of the target is higher than the critical electron number density,
 $n_{\text{cr}}$. Due to the laser–foil interaction, a hot electron population is created with a fraction of it permanently escaping the target. As a consequence of the electron ejection, a longitudinal electric field is established on the target rear surface along with an expanding plasma cloud. Since protons are present on the target as contaminants, they are favourably accelerated due to their high charge to mass ratio, resulting in a spectrum characterised by a double temperature and a sharp cutoff energy.
Once the laser intensity reaches  $10^{21}~\text{W}~\text{cm}^{-2}$ the radiation pressure acceleration (RPA) mechanism (Esirkepov et al. Reference Esirkepov, Borghesi, Bulanov, Mourou and Tajima2004; Klimo et al. Reference Klimo, Psikal, Limpouch and Tikhonchuk2008; Robinson et al. Reference Robinson, Zepf, Kar, Evans and Bellei2008; Bulanov et al. Reference Bulanov, Esarey, Schroeder, Bulanov, Esirkepov, Kando, Pegoraro and Leemans2016) becomes important, where its experimental indications have already been observed (Kim et al. Reference Kim, Pae, Choi, Lee, Kim, Singhal, Sung, Lee, Lee and Nickles2016; Higginson et al. Reference Higginson, Gray, King, Dance, Williamson, Butler, Wilson, Capdessus, Armstrong and Green2018). The RPA mechanism is based on the concept of the relativistic mirrors, where the radiation pressure of the laser pulse pushes the foil (in the interaction region) as a whole. The energy of the pulse is transferred to the foil due to reflection by the co-moving foil mirror. The RPA mechanism requires a circularly polarised laser to be effective, while for a
 $1~\text{PW}$ laser then nanometre-thick foils are required (Kim et al. Reference Kim, Pae, Choi, Lee, Kim, Singhal, Sung, Lee, Lee and Nickles2016; Higginson et al. Reference Higginson, Gray, King, Dance, Williamson, Butler, Wilson, Capdessus, Armstrong and Green2018). One drawback of the RPA mechanism is that it requires high laser contrast for the foil not to be destroyed by the prepulse prior to the arrival of the main pulse. In the present work only linear polarisation is used and the RPA mechanism is not involved.
If the laser is able to extract almost all electrons from a foil region, then the Coulomb explosion (CE) acceleration mechanism (Bulanov et al. Reference Bulanov, Brantov, Bychenkov, Chvykov, Kalinchenko, Matsuoka, Rousseau, Reed, Yanovsky and Litzenberg2008; Morita et al. Reference Morita, Esirkepov, Bulanov, Koga and Yamagiwa2008; Ogura et al. Reference Ogura, Nishiuchi, Pirozhkov, Tanimoto, Sagisaka, Esirkepov, Kando, Shizuma, Hayakawa and Kiriyama2012) occurs. Several requirements must be met for CE to be effective, such as a high laser contrast and an optimum target thickness, depending on the pulse parameters and target density. In order for the CE mechanism to occur, electrons must be ejected within a duration defined by the electron ejection time and the ion response time. Approximately, only electrons within the focal spot contribute to CE. The sudden electron ejection leaves the target with a positively charged ion core. The strong repulsive forces between ions lead to an explosion of the ion core, where the ion spectrum is characterised by a non-thermal distribution. The maximum ion energy is proportional to the maximum electrostatic potential value within the ion core prior the explosion.
If the target has an electron number density near the critical electron number density for relativistically intense electromagnetic waves,  $n_{\text{cr}}^{\text{rel}}$, then the incident pulse can channel through the target setting the basis for the magnetic vortex acceleration mechanism (MVA) (Bulanov & Esirkepov Reference Bulanov and Esirkepov2007; Yogo et al. Reference Yogo, Daido, Bulanov, Nemoto, Oishi, Nayuki, Fujii, Ogura, Orimo and Sagisaka2008; Bulanov et al. Reference Bulanov, Bychenkov, Chvykov, Kalinchenko, Litzenberg, Matsuoka, Thomas, Willingale, Yanovsky and Krushelnick2010b; Park et al. Reference Park, Bulanov, Bin, Ji, Steinke, Vay, Geddes, Schroeder, Leemans and Schenkel2019). Once the pulse exits the target then a quasi-static magnetic field is established, related with the vortex trajectories of electrons in that region. The resulting magnetic field sustains a longitudinal electric field, which is responsible for ion acceleration.
1.2 Structured targets and holed-target geometry
Not long after the first MeV laser generated protons were demonstrated by laser irradiation of flat foils, simulations proposed that a curved foil could collimate the proton beam (Bulanov et al. Reference Bulanov, Esirkepov, Califano, Kato, Liseikina, Mima, Naumova, Nishihara, Pegoraro and Ruhl2000; Sentoku et al. Reference Sentoku, Liseikina, Esirkepov, Califano, Naumova, Ueshima, Vshivkov, Kato and Mima2000; Wilks et al. Reference Wilks, Langdon, Cowan, Roth, Singh, Hatchett, Key, Pennington, MacKinnon and Snavely2001) and an experimental demonstration came soon after (Patel et al. Reference Patel, Mackinnon, Key, Cowan, Foord, Allen, Price, Ruhl, Springer and Stephens2003), setting the new path of laser irradiated microstructured targets. A few notable target proposals include a foil doped with a proton-rich region (Bulanov & Khoroshkov Reference Bulanov and Khoroshkov2002; Esirkepov et al. Reference Esirkepov, Bulanov, Nishihara, Tajima, Pegoraro, Khoroshkov, Mima, Daido, Kato and Kitagawa2002; Schwoerer et al. Reference Schwoerer, Jäckel, Amthor, Liesfeld, Ziegler, Sauerbrey, Ledingham and Esirkepov2006), a hollow microsphere (Burza et al. Reference Burza, Gonoskov, Genoud, Persson, Svensson, Quinn, McKenna, Marklund and Wahlström2011), foils with solid microspheres attached on their front surface (Klimo et al. Reference Klimo, Psikal, Limpouch, Proska, Novotny, Ceccotti, Floquet and Kawata2011; Margarone et al. Reference Margarone, Klimo, Kim, Prokůpek, Limpouch, Jeong, Mocek, Pšikal, Kim and Proška2012), foils attached to hollow cones (Bartal et al. Reference Bartal, Foord, Bellei, Key, Gaillard, Flippo, Offermann, Patel, Jarrott and Higginson2012; Qiao et al. Reference Qiao, Foord, Wei, Stephens, Key, McLean, Patel and Beg2013), foils with a series of microslits (Nagashima et al. Reference Nagashima, Takano, Izumiyama, Barada, Kawata, Gu, Kong, Wang, Ma and Wang2013; Kawata et al. Reference Kawata, Nagashima, Takano, Izumiyama, Kamiyama, Barada, Kong, Gu, Wang and Ma2014), atomic clusters (Ditmire et al. Reference Ditmire, Tisch, Springate, Mason, Hay, Smith, Marangos and Hutchinson1997), microwires developed on the target front surface (Jiang et al. Reference Jiang, Ji, Audesirk, George, Snyder, Krygier, Poole, Willis, Daskalova and Chowdhury2016; Bargsten et al. Reference Bargsten, Hollinger, Capeluto, Kaymak, Pukhov, Wang, Rockwood, Wang, Keiss and Tommasini2017; Rocca et al. Reference Rocca, Shlyaptsev, Hollinger, Bargsten, Pukhov, Kaymak, Tommasini, London, Park and Capeluto2017) and laser irradiated microtubes/microchannel plates (Ji et al. Reference Ji, Snyder, Pukhov, Freeman and Akli2016; Ji, Snyder & Shen Reference Ji, Snyder and Shen2019; Snyder et al. Reference Snyder, Ji, George, Willis, Cochran, Daskalova, Handler, Rubin, Poole and Nasir2019). Fabrication of microstructures is now considered a routine process and features of  ${\sim}100~\text{nm}$ can be created by direct laser writing (Fischer & Wegener Reference Fischer and Wegener2013).
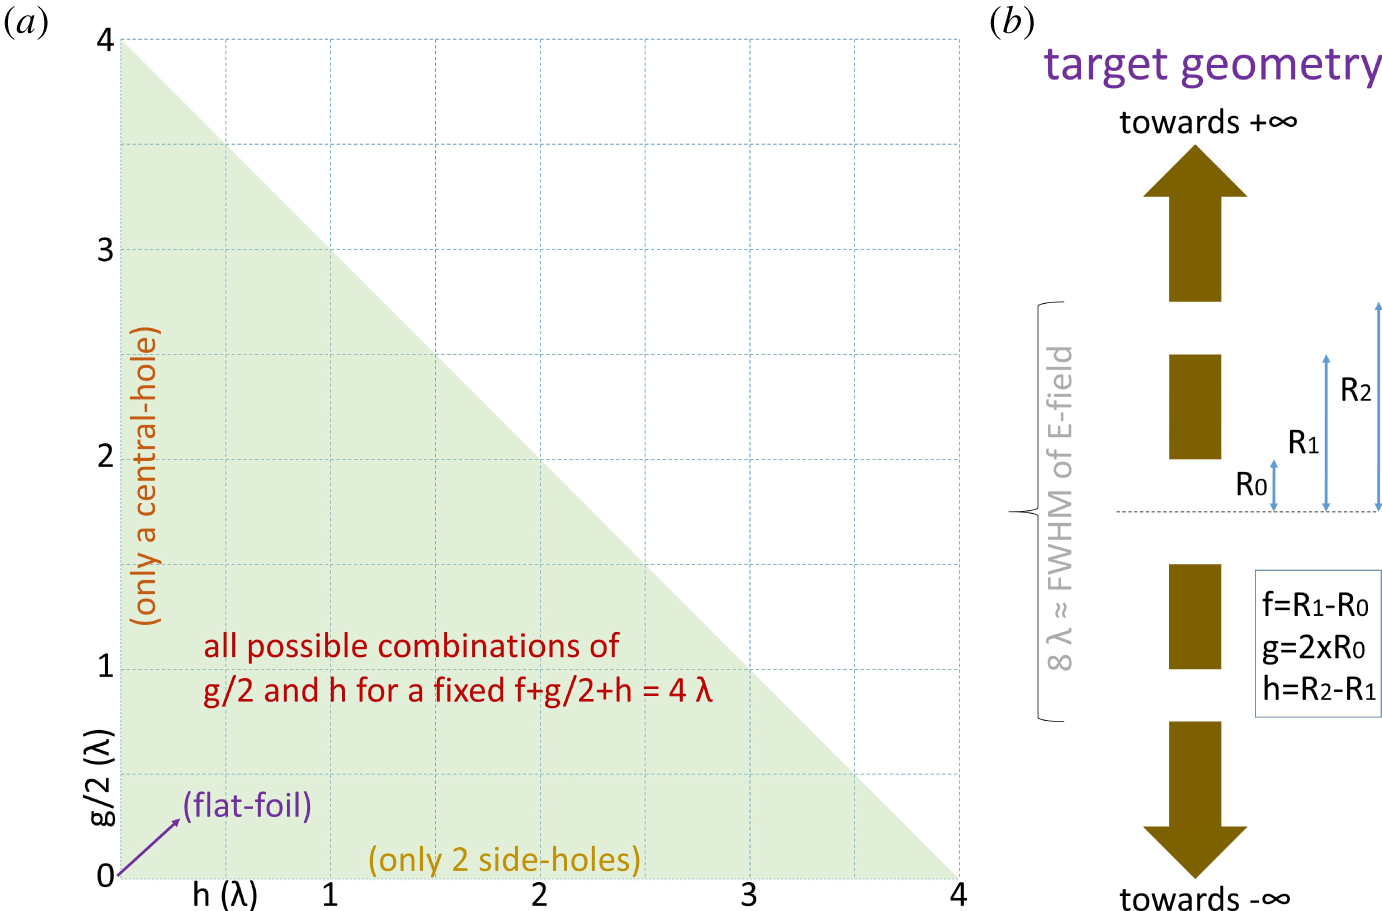
Here, we propose an innovative holed-target geometry where a central hole is drilled into a  $1~\unicode[STIX]{x03BC}\text{m}$ thick polyethylene (Bamberger & Tschirner Reference Bamberger and Tschirner1900) foil, centred on the laser focal spot. In addition, two side holes are drilled on the two-dimensional (2-D) foil geometry, symmetrically to the central hole, as shown on the right side of figure 1. The central-hole radius, side-hole inner edge and side-hole outer edge correspond to radii of
 $R_{0}$,
 $R_{1}$ and
 $R_{2}$ respectively, as labelled in figure 1. The foil segment corresponding to a length of
 $R_{1}{-}R_{0}$ is called the inner segment (defined as
 $f$) and the segment extending from
 $R_{2}$ to
 $\infty$ is called the outer segment. The extent of the central-hole radius (defined as
 $g/2$), the side-hole extent (defined as
 $h$) and the inner-segment extent equal a length of
 $4\unicode[STIX]{x1D706}$, meaning that the electric field amplitude (Gaussian with
 $4.75~\unicode[STIX]{x03BC}\text{m}$ FWHM) at the interaction point and at
 $R_{2}$ have a ratio of 2. The targets considered in the present work cover all combinations of central-hole radius and side-hole extent. From these combinations, since the length sum of the target components (ignoring the outer segment) is
 $8\unicode[STIX]{x1D706}$ the effect of the inner-segment length can also be extracted. Although the target holes are adjusted to a focal spot with dimensions usually used in laser-proton acceleration experiments, a larger spot (Steinke et al. Reference Steinke, Bin, Park, Ji, Nakamura, Gonsalves, Bulanov, Thévenet, Toth and Vay2020) allows more flexibility on the dimension of the holes.
A graphical representation of all possible holed-target geometries if the condition  $f+g/2+h=4\unicode[STIX]{x1D706}$ is met is shown on the left side of figure 1, where only the green triangle corresponds to allowed combinations of the extent of central-hole and the extent of the side-holes. Notably, the general holed-target geometry corresponds to two significantly simplified geometries, one at the base and one at the height of the triangle. If one considers only the combinations at the base of the triangle then the target transforms to a centred mass-limited (ML) target plus an outer segment, named the holed target with 2 side holes (HT2SH); if the combinations at the height of the triangle are considered then the target corresponds to a flat foil with a hole in the centre, named the holed target with 1 central hole (HT1CH). The intersection of the base and height of the triangle correspond to a flat foil. All cases along the hypotenuse of the triangle correspond to the same case as a holed target (where the inner segments are removed) regardless of the value of either
 $g$ or
 $h$ as long as their sum is
 $4\unicode[STIX]{x1D706}$. The only exception is presented in § 3.5 for a HT2SH, where the central foil radius is kept at
 $0.5\unicode[STIX]{x1D706}$ and the side-holes’ extent is gradually increased.
(a) The green orthogonal triangular area contains the combinations of the central-hole radius and the side-holes’ extent, where the length sum of the central hole, the two side holes and the two inner segments equals  $8\unicode[STIX]{x1D706}$. The base and the height of the triangle correspond to HT2SH and HT1CH respectively. The intersection of the two catheti corresponds to a flat foil and the hypotenuse is a sub-case of the holed-target geometry where the two inner segments are removed. (b) Schematic representation of a sampled holed target used in the simulations. The target consists of a central hole, defined as
 $g$, two side holes, each represented by
 $h$, two inner segments, each noted as
 $f$, and two outer segments which extend to infinity.

2 Simulations
The results of this work are obtained through the 2-D version of EPOCH (Arber et al. Reference Arber, Bennett, Brady, Lawrence-Douglas, Ramsay, Sircombe, Gillies, Evans, Schmitz and Bell2015) particle-in-cell (PIC) code. The EPOCH version  $4.17.19$ is compiled with the Higuera–Cary (Higuera & Cary Reference Higuera and Cary2017; Ripperda et al. Reference Ripperda, Bacchini, Teunissen, Xia, Porth, Sironi, Lapenta and Keppens2018) instead of the default Boris solver (Boris Reference Boris1970; Ripperda et al. Reference Ripperda, Bacchini, Teunissen, Xia, Porth, Sironi, Lapenta and Keppens2018). Protons with a velocity exceeding
 $0.5c$ (where
 $c$ is the speed of light) and electrons approaching
 $c$ are expected. Therefore, the use of the Higuera–Cary solver is necessary to simultaneously preserve volume and the
 $\boldsymbol{E}\times \boldsymbol{B}$ velocity, where
 $\boldsymbol{E}$ and
 $\boldsymbol{B}$ is the electric and magnetic field vector respectively (Higuera & Cary Reference Higuera and Cary2017). In the present work, although a spectrum comparison of the two solvers exhibits minor differences for protons, the electron spectra are significantly different.
A combination of three overlapping particle species is used, namely electrons, protons (H) and carbon ions (C), consisting a polyethylene foil with a mass density of  $0.93~\text{g}~\text{cm}^{-3}$ and a chemical formula of
 $(\text{C}_{2}\text{H}_{4})_{n}$, where the subscript
 $n$ is an integer and denotes a macroscopic chain. Electrons, protons and C are assigned to a mass of
 $1,1836.15$ and
 $12\times 1836.15$ times the electron rest mass, a charge of
 $-1,1$ and
 $6$ times the elementary charge and a number density of
 $3.2\times 10^{23}~\text{cm}^{-3}$,
 $8\times 10^{22}~\text{cm}^{-3}$ and
 $4\times 10^{22}~\text{cm}^{-3}$, respectively. All holed targets are
 $1~\unicode[STIX]{x03BC}\text{m}$ thick, with the location and extent of the three holes varying in each simulation.
The simulations use ‘open’ boundaries in all directions apart the negative (left) $x$-boundary, which is set to ‘simple laser’ allowing the launch of a laser pulse from it. The ‘open’ boundaries allow both fields and particles reaching the box boundary to freely exit the simulation, although the simulation box is large enough to ensure that neither particles nor fields escaped within the simulation time. The laser pulse is launched along the target normal (along
 $\hat{\boldsymbol{x}}$), following the focusing equations of a Gaussian beam (Siegman Reference Siegman1986), focused at the
 $(0,0)$. The laser is P-polarised with a wavelength of
 $815~\text{nm}$. The electric field on the focus is described by a Gaussian spatial profile of
 $\sqrt{2}\times 4.75~\unicode[STIX]{x03BC}\text{m}$ FWHM (equal to
 ${\sim}8\unicode[STIX]{x1D706}$) and a temporal profile of
 $27~\text{fs}$ FWHM (equal to
 ${\sim}10\unicode[STIX]{x1D706}$), where the temporal profile is delayed by two standard deviations,
 $\unicode[STIX]{x1D70E}$ (where for a Gaussian,
 $\unicode[STIX]{x1D70E}$ equals
 $[2\sqrt{2\ln (2)}]^{-1}$ FWHM), in order for the rising pulse profile to be accurately generated. All simulations use a peak intensity of
 $5.2\times 10^{21}~\text{W}~\text{cm}^{-2}$.
The simulations are performed on the ECLIPSE cluster, using for each simulation 36 nodes with 16 processors per node, where these processors are distributed to a square arrangement of  $24\times 24$. To avoid numerical heating by the open boundaries, the dimensions of the simulation box in each direction are set to
 $122.88~\unicode[STIX]{x03BC}\text{m}\times 122.88~\unicode[STIX]{x03BC}\text{m}$. The length of each cell in each direction is
 $10~\text{nm}$, which approximately equals the skin depth of polyethylene by ignoring the correction due to the relativistically intense electromagnetic waves, while by considering the relativistic correction then the skin depth becomes more than five times larger than the cell size (
 $56~\text{nm}$). Therefore, each dimension corresponds to
 $3\times 2^{12}$ cells and
 $9\times 2^{25}$ macroparticles are assigned to each specie. By considering that macroparticles are assigned only to cells with non-zero density, initially each cell contains
 ${\sim}40$ macroparticles, with the exact number depending on the holes of each holed target. By considering that the laser pulse needs
 ${\sim}200~\text{fs}$ to reach the focal spot at the centre of the box, during the initial
 $160~\text{fs}$ evolution of particles is disabled to approximately half the computational time. Each simulation runs for
 $400~\text{fs}$ with
 $21199$ steps (time-step multiplier factor of 0.8), with a time step equal
 ${\sim}1.77$ times the cell size over
 $c$.
3 Results and discussion
This section provides a detailed description of the results of the general holed-target geometry simulations. Initially, § 3.1 explains how the initial Gaussian pulse profile is rearranged in space after being diffracted and/or reflected by a holed target. Following this, § 3.2 emphasises electron ejection and propagation following the laser–target interaction, along with the resulting charge separation. In addition, § 3.2 quantifies the amount of laser energy transferred to the target particles. In § 3.3 the acceleration of protons and carbon ions is studied for the general holed-target configuration. Emphasis on the electron and proton spectra extracted from two limit cases of HT2SH and HT1CH is given in § 3.4. The results close with § 3.5, where a transition from the holed-target geometry to a ML target is made.
3.1 Diffracted fields
Every laser interaction with a general target geometry results in the same laser energy rearrangement, where a portion of the laser energy is transferred to the target particles (§ 3.2), a small portion is captured by the target as a surface field (Quinn et al. Reference Quinn, Wilson, Cecchetti, Ramakrishna, Romagnani, Sarri, Lancia, Fuchs, Pipahl and Toncian2009; Tokita et al. Reference Tokita, Sakabe, Nagashima, Hashida and Inoue2015), a third portion is reflected and a fourth portion is transmitted towards the laser propagation direction. In general, the holed-target geometry consists of an infinite flat foil on which three gaps are created. Therefore, it can be described by the theory of diffraction and interference of a planar wave by multiple slits (Born & Wolfl Reference Born and Wolfl1999).
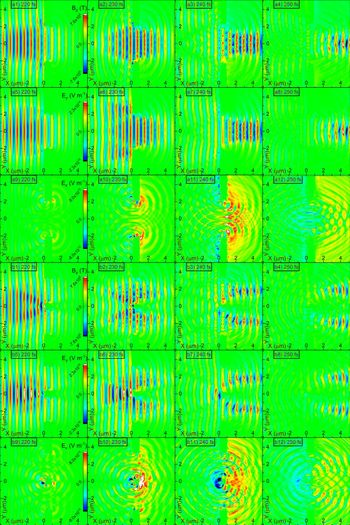
Evolution of the magnetic ( $B_{z}$) and electric (
 $E_{y}$ and
 $E_{x}$) field components corresponding to a (a1–a12) HT1CH with a central hole of
 $5\unicode[STIX]{x1D706}$ and (b1–b12) HT2SH with two side holes of
 $3.5\unicode[STIX]{x1D706}$.

However, although a theoretical model can predict the evolution of the laser field after the interaction with the polyethylene foil, several assumptions make a precise analytical prediction hardly possible. Although analytical solutions of the diffracted intensity do exist for an infinite planar wave incident on multiple slits, in our case the pulse has a spatial Gaussian envelope. Furthermore, during the laser–target interaction the target geometry is gradually altered, meaning that the final field configuration is not a result of a single diffraction and interference behaviour. Therefore, the complex field configuration is accurately obtained only through simulations.
The resulting field evolution is shown in figure 2, where the upper half corresponds to a HT1CH with a central hole of  $5\unicode[STIX]{x1D706}$ and the lower half to a HT2SH with two side holes of
 $3.5\unicode[STIX]{x1D706}$. In both cases, due to the large extent of the holes (large fraction of the pulse spatial profile), most of the laser pulse is transmitted through the target forming an approximately predictable diffraction pattern. The extent of the diffraction effect can be better visualised by considering the longitudinal component of the electric field,
 $E_{x}$, which although initially absent, appears once the pulse passes through the holed target. Notably, a strong
 $E_{x}$ field is created in the area between the central hole of the HT1CH. The diffracted field intensity,
 $I$, is approximated by the diffraction of a plane wave from a single slit,
 $$\begin{eqnarray}I=I_{0}\left[\operatorname{sinc}\left(\frac{\unicode[STIX]{x03C0}\unicode[STIX]{x1D6FC}}{\unicode[STIX]{x1D706}}\sin (\unicode[STIX]{x1D703})\right)\right]^{2}.\end{eqnarray}$$
Here,  $I_{0}$ is the intensity of the assumed plane wave,
 $\unicode[STIX]{x1D6FC}$ is the slit opening and
 $\unicode[STIX]{x1D703}$ is the angle at which the diffracted intensity is estimated. In agreement with the low divergence in figure 2, for
 $5\unicode[STIX]{x1D706}$ the intensity at FWHM is associated with an angle of
 ${\sim}5^{\circ }$. Additionally, an even stronger
 $E_{x}$ appears on the rear surface of the inner segment of the HT2SH. Notably,
 $E_{x}$ in both cases has a duration approximately equal to the laser pulse duration.
Since the laser spatial extent is larger than the holes’ extent, a portion of the pulse is reflected by the front target surface. The reflection is not identical for all holed-target configurations, resulting in various complex interference patterns. The final picture is further complicated since the interference can be either constructive or destructive as time evolves. In the case of a HT1CH and a large hole to wavelength ratio, interference is not important since practically only the edges of the pulse are reflected. However, for a HT2SH, the central part of the pulse faces a solid inner segment. Therefore, if the inner segment is large enough, the pulse is reflected in a manner similar to reflection from a flat foil. The destructive interference of the magnetic field and constructive interference of the electric field can be seen in figures 2(b2) and 2(b6) respectively, where a dimmer region of the magnetic field is accompanied by a brighter region of the electric field.
3.2 Energy transfer, electron evolution and charge separation
When the rising front of the laser pulse (assumed zero for distances greater than two standard deviations from the pulse peak) reaches the holed target, it is reflected at the locations where inner segments and outer segments exist. However, due to the initially low field amplitude of the pulse rising front (approximately one order of magnitude less than the peak), the field penetrates the target at a depth approximately given by the skin depth of polyethylene (it is equal to  ${\sim}10~\unicode[STIX]{x03BC}\text{m}$) creating a hot electron population. At a time of
 ${\sim}23~\text{fs}$ the electric field on target gets its peak value, penetrating at
 ${\sim}56~\unicode[STIX]{x03BC}\text{m}$ within the target, further heating electrons.
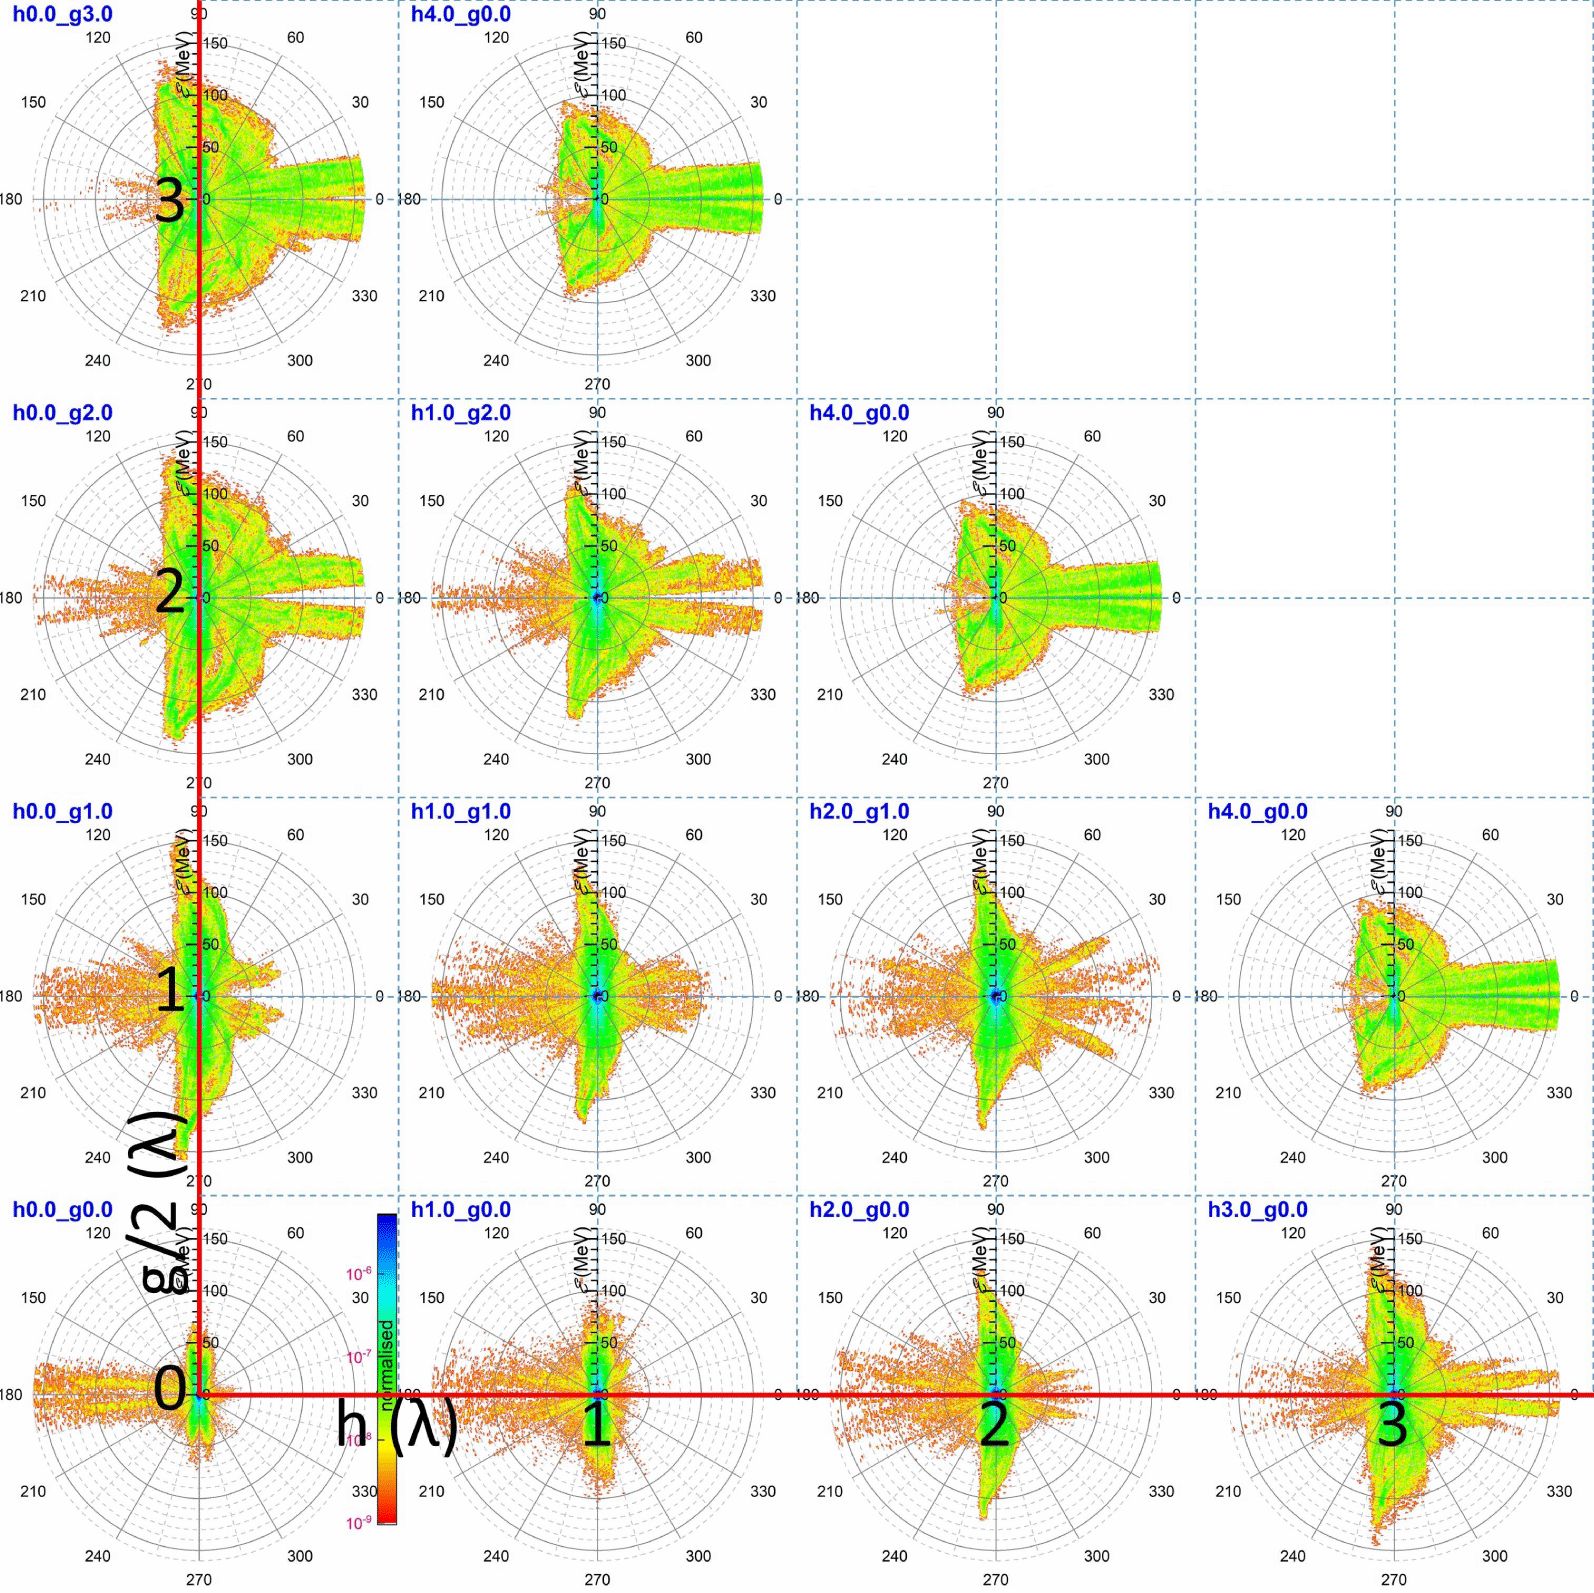
Electron energy polar diagrams for various combinations of the central-hole radius and the side-hole extent. The red lines form a Cartesian system where the holed-target characteristic dimensions ( $h$ and
 $g/2$) are given by the centre of each contour.

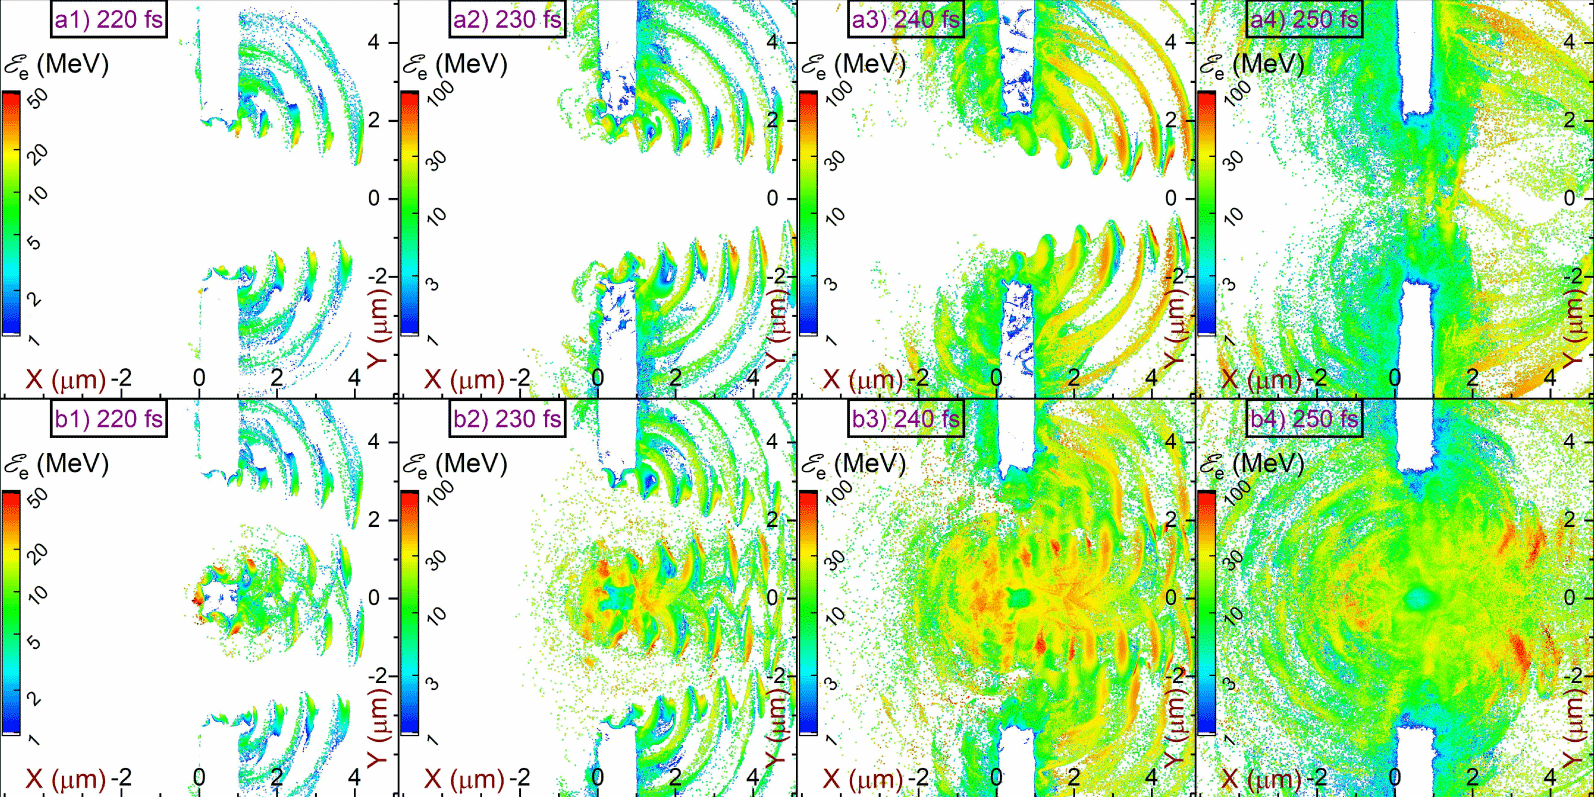
Evolution of the electron mean energy per cell corresponding to a (a1–a4) HT1CH with a central hole of  $5\unicode[STIX]{x1D706}$ and (b1–b4) HT2SH with two side holes of
 $3.5\unicode[STIX]{x1D706}$.

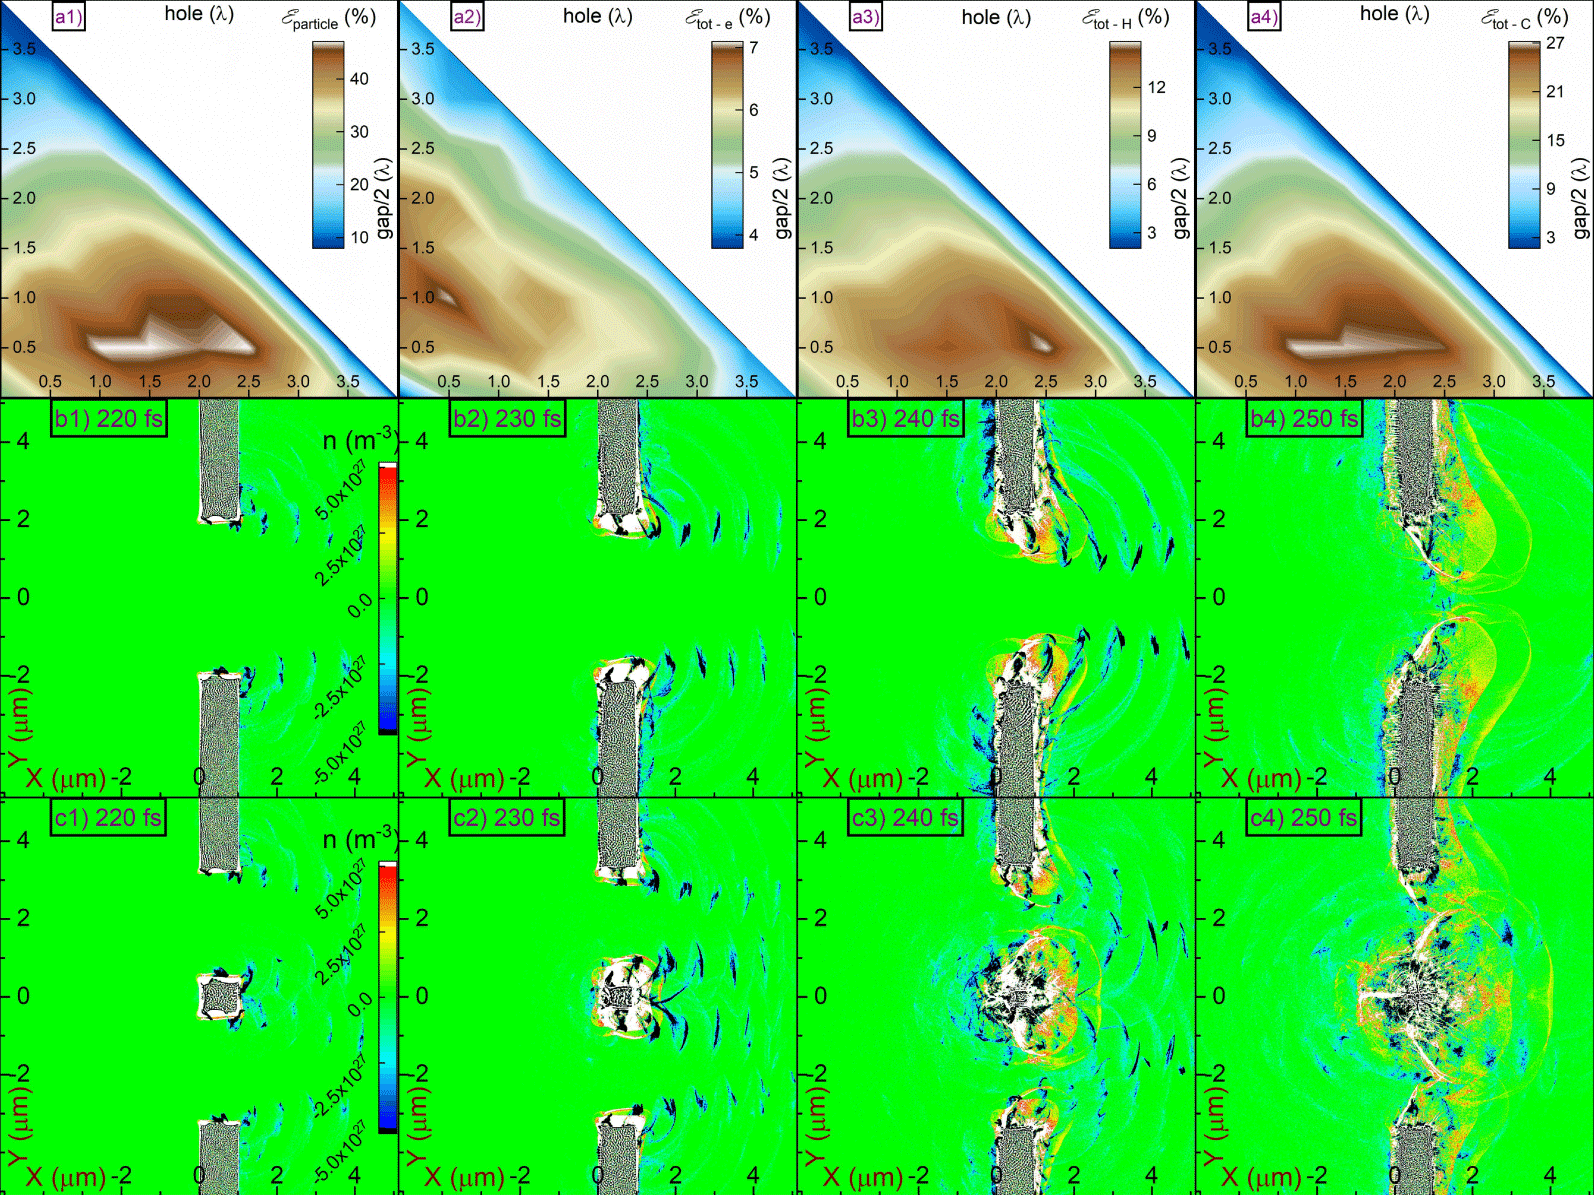
The percentage of laser energy transferred to (a1) all particles, (a2) electrons, (a3) protons and (a4) carbon ions by the end of the simulation. Evolution of the charge density per cell for a (b1–b4) HT1CH with a central hole of  $5\unicode[STIX]{x1D706}$ and (c1–c4) HT2SH with two side holes of
 $3.5\unicode[STIX]{x1D706}$.

The initial hot electron distribution eventually leads to several distinct populations. The largest population corresponds to a hot electron cloud refluxing the target, where this behaviour is known as electron ‘stochastic heating’ (Bulanov et al. Reference Bulanov, Yogo, Esirkepov, Koga, Bulanov, Kondo and Kando2015; Yogo et al. Reference Yogo, Bulanov, Mori, Ogura, Esirkepov, Pirozhkov, Kanasaki, Sakaki, Fukuda and Bolton2015, Reference Yogo, Mima, Iwata, Tosaki, Morace, Arikawa, Fujioka, Johzaki, Sentoku and Nishimura2017). In our case, these electrons are visualised as the small blue dot in figure 3, at the centre of each image. Another electron fraction moves along the foil in both directions, following a portion of the laser field trapped by the foil and propagating outwards. These electrons have been observed experimentally in cases where the laser pulse had a large incidence angle on a flat foil and a strong electron signal was observed as originating from the foil edges (Li et al. Reference Li, Yuan, Xu, Zheng, Sheng, Chen, Ma, Liang, Yu and Zhang2006; Mao et al. Reference Mao, Chen, Ge, Zhang, Yan, Li, Liao, Ma, Huang and Li2012; Wang et al. Reference Wang, Chen, Mao, Huang, Ma, Zhao, Zhang, Yan, Li and Ma2013). A similar effect was observed by wires directly interacting with a laser pulse (Tokita et al. Reference Tokita, Otani, Nishoji, Inoue, Hashida and Sakabe2011; Nakajima et al. Reference Nakajima, Tokita, Inoue, Hashida and Sakabe2013; Tokita et al. Reference Tokita, Sakabe, Nagashima, Hashida and Inoue2015).
A third electron fraction escapes the target as seen by the highest energy electrons in figure 4. Notably, the spatial distribution of the mean electron kinetic energy partially overlaps with the spatial distribution of  $E_{x}$, as seen by comparing figure 3 with figure 2. This effect is mentioned as ‘electron capture’ by the laser field (Wang et al. Reference Wang, Ho, Kong, Zhu, Feng, Scheid and Hora1998; Zhu et al. Reference Zhu, Ho, Wang and Kong1998; Wang et al. Reference Wang, Ho, Yuan, Kong, Cao, Sessler, Esarey and Nishida2001; Braenzel et al. Reference Braenzel, Andreev, Abicht, Ehrentraut, Platonov and Schnürer2017), where similar electron patterns are observed in Bulanov et al. (Reference Bulanov, Esirkepov, Kamenets, Kato, Kuznetsov, Nishihara, Pegoraro, Tajima and Khoroshkov2002, Reference Bulanov, Litzenberg, Krushelnick and Maksimchuk2010a). Therefore, those captured electrons are continuously accelerated for as long as they are kept in phase with the pulse (Wang et al. Reference Wang, Ho, Yuan, Kong, Cao, Sessler, Esarey and Nishida2001; Bulanov et al. Reference Bulanov, Esirkepov, Kamenets, Kato, Kuznetsov, Nishihara, Pegoraro, Tajima and Khoroshkov2002).
For HT1SH the electron mean energy contours (see figure 4a) do not completely correspond to the field spatial distributions (see figure 2a). The partial overlap of the two patterns is due to the lack of an inner segment, since the produced electrons originate only from the edges of the pulse. On the other hand, for HT2SH, a plethora of electrons are ejected from the inner segment. That behaviour is also related to the different extents of the hot electron cloud. If no inner segment exists in the path of the pulse then less electrons recirculate the interaction region, as indicated by the reduced size of the central blue dot at the first column and outer diagonal in figure 3, where it is also realised by comparing figure 4(a4) with figure 4(b4).
The distinction of the several electron populations in combination with the holed-target geometries explain the form of all images grouped in figure 3. In the case of a flat foil (see the intersection of the catheti in figure 3), most of the laser pulse is reflected, capturing a portion of hot electrons driving them to hundreds of MeV energies. Furthermore, the portion of the pulse captured by the foil drives electrons along the foil surface at an energy of  ${\sim}50~\text{MeV}$.
The first column of figure 3 corresponds to HT1CH, where the hole extent is increasing towards the hypotenuse. As the hole extent increases, smaller amplitude fields are reflected, decreasing the energy and number of the target front electrons. On the other hand, the percentage of the diffracted pulse increases, preserving the initial shape of the pulse due to weaker diffraction by the increased hole. As a result, the target rear electrons are accelerated to hundreds of MeV energies. Notably, this behaviour has an optimum hole extent, since for an extremely large hole a drastic lowering of the pulse amplitude allows no electron ejection.
The last row of figure 3 corresponds to HT2SH, where the side-holes’ extent is increasing towards the hypotenuse. Practically, by increasing the side-holes’ extent the inner-segment extent is decreased and, a smaller portion of the pulse is reflected by the inner segment. For small inner segments, electrons are preferably accelerated towards the target rear, but not as strongly as in the case of HT1CH. This is because the inner segment (located in the middle of the incident pulse) reflects the highest field amplitude but it also diffracts the remaining pulse, significantly attenuating it.
Ejection of hot electrons from the target leads to a charge imbalance, as seen in figure 5. The blue regions indicate an excess of negative charge, due to the capture of electrons by the laser field. However, the white (saturated) regions indicate an excess of protons and carbon ions, which eventually leads to CE. The positive core is stronger for a HT2SH with two side holes of  ${\sim}3.5\unicode[STIX]{x1D706}$ since in that case most electrons are ejected from the inner segment at
 ${\sim}230~\text{fs}$, as can be realised by the large positively charged region in figure 5(c2). The conditions under which CE dominates are given in equations (1) and (2) of Bulanov et al. (Reference Bulanov, Esarey, Schroeder, Bulanov, Esirkepov, Kando, Pegoraro and Leemans2016), which can be rearranged as
 $$\begin{eqnarray}l<\frac{2\unicode[STIX]{x1D700}_{0}E}{en_{e}}.\end{eqnarray}$$
Here,  $l$ is the foil thickness,
 $\unicode[STIX]{x1D700}_{0}$ is the permittivity of free space.
 $E$ the electric field,
 $e$ the elementary charge and
 $n_{e}$ the electron number density. For a HT2SH with a central segment of
 $\unicode[STIX]{x1D706}$, due to the
 $7\unicode[STIX]{x1D706}$ total gap in the FWHM of the electric field, the target thickness should be 8 times larger since
 $l$ in the equation above is volumetrically associated with the number of hot electrons. Therefore, for that specific case one should expect complete electron ejection at a central-segment thickness of
 ${\sim}0.55~\unicode[STIX]{x03BC}\text{m}$. However, due to the complex diffraction patterns the pulse is able to penetrate the central segment and extract electrons from both its front and rear surfaces, further relaxing the minimum target thickness required.
The percentage of the laser energy transferred to particles is also directly connected with the geometry of the holed target, as seen in figure 5(a1). Although for a flat foil only  ${\sim}25\,\%$ of the energy is transferred to particles, this value approximately doubles for a holed target with a central hole of
 $0.5\unicode[STIX]{x1D706}$ and side holes of
 $1{-}2.5\unicode[STIX]{x1D706}$. The drop of the conversion efficiency for larger holes is because, in this case, less particles interact with the laser pulse. Furthermore, the conversion efficiency for each particle species is maximised for different holed targets. For electrons (see figure 5a2), a clear peak is formed for a central hole of
 $1\unicode[STIX]{x1D706}$ and side-holes of
 $0.5\unicode[STIX]{x1D706}$, while for protons (see figure 5a3) this value shifts to
 $0.5\unicode[STIX]{x1D706}$ for the central hole and
 $2.5\unicode[STIX]{x1D706}$ for the side holes. As for carbon ions (see figure 5a4), since they define most of the energy absorbed by particles, their optimum absorption corresponds to the same hole values as those of the total system, but with a slight optimisation for side holes of
 $1\unicode[STIX]{x1D706}$.
3.3 Ion energy evolution and polar distribution
A direct consequence of electron ejection from the target is acceleration of protons and carbon ions and a brief report on the main laser driven ion acceleration mechanisms is made in § 1.1. As described in § 1.2, the general holed-target geometry corresponds to two limiting cases (HT1CH and HT2SH), where a flat foil is the common geometry of these limits. Therefore, the holed-target geometry does not follow a single acceleration mechanism, and for different target parameters different acceleration mechanisms dominate.
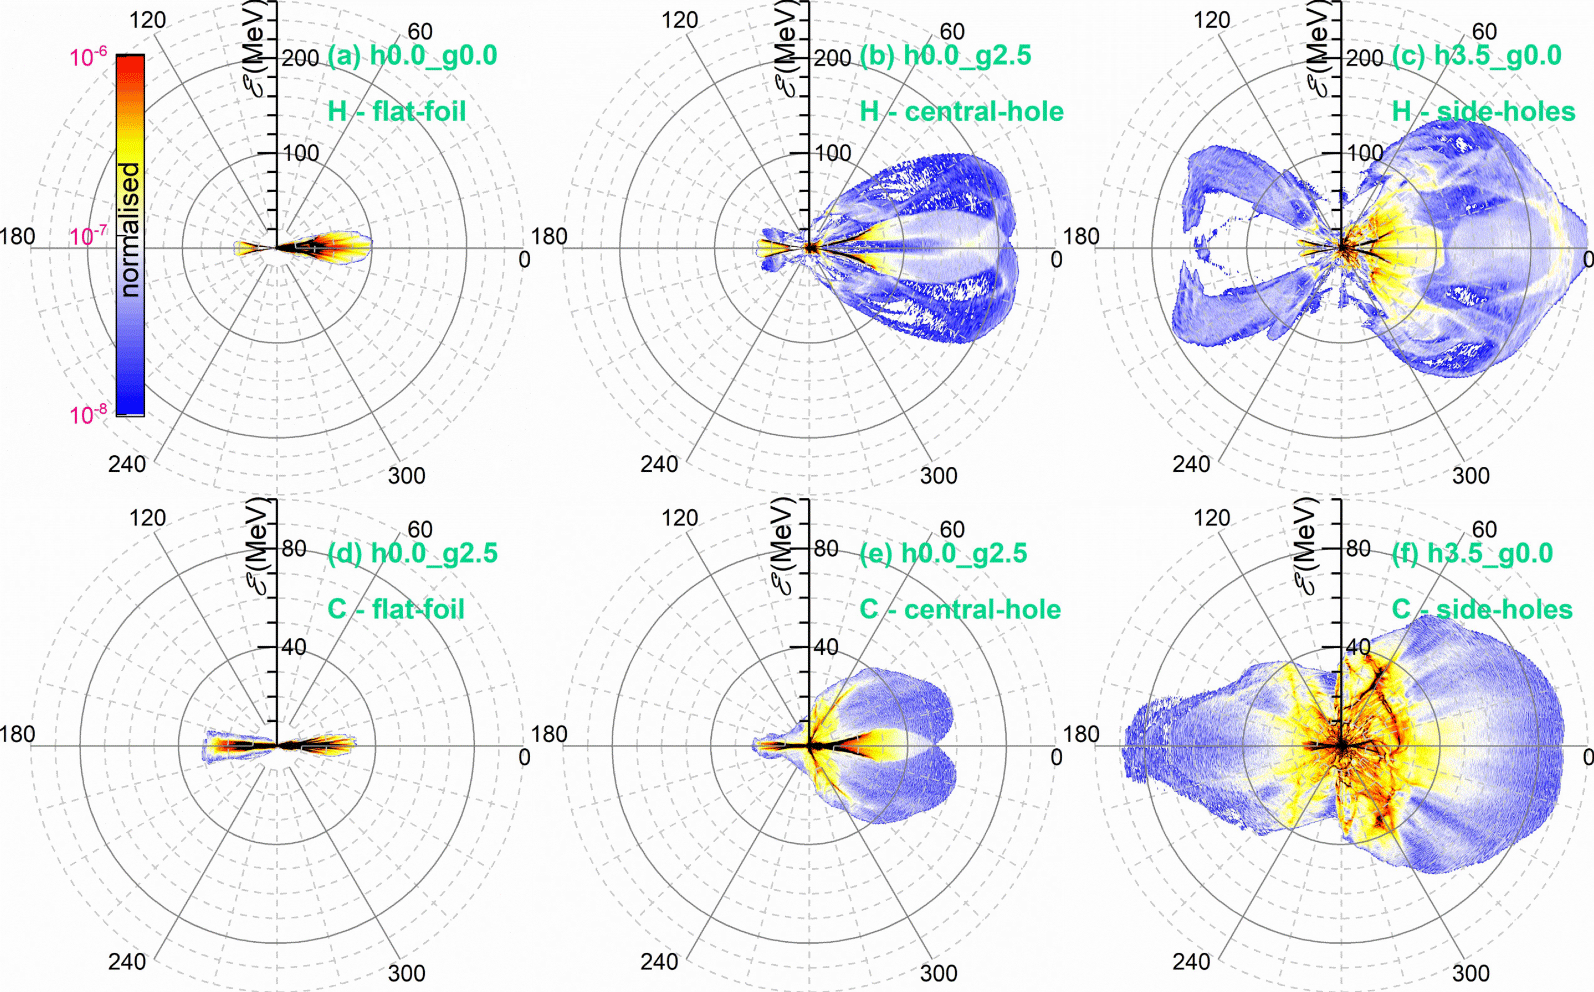
Proton energy polar diagrams corresponding to a (a) flat foil, (b) HT1CH with a central hole of  $5\unicode[STIX]{x1D706}$ and (c) HT2SH with two side holes of
 $3.5\unicode[STIX]{x1D706}$. Carbon ion energy polar diagrams corresponding to a (d) flat foil, (e) HT1CH with a central hole of
 $5\unicode[STIX]{x1D706}$ and (f) a HT2SH with two side holes of
 $3.5\unicode[STIX]{x1D706}$.

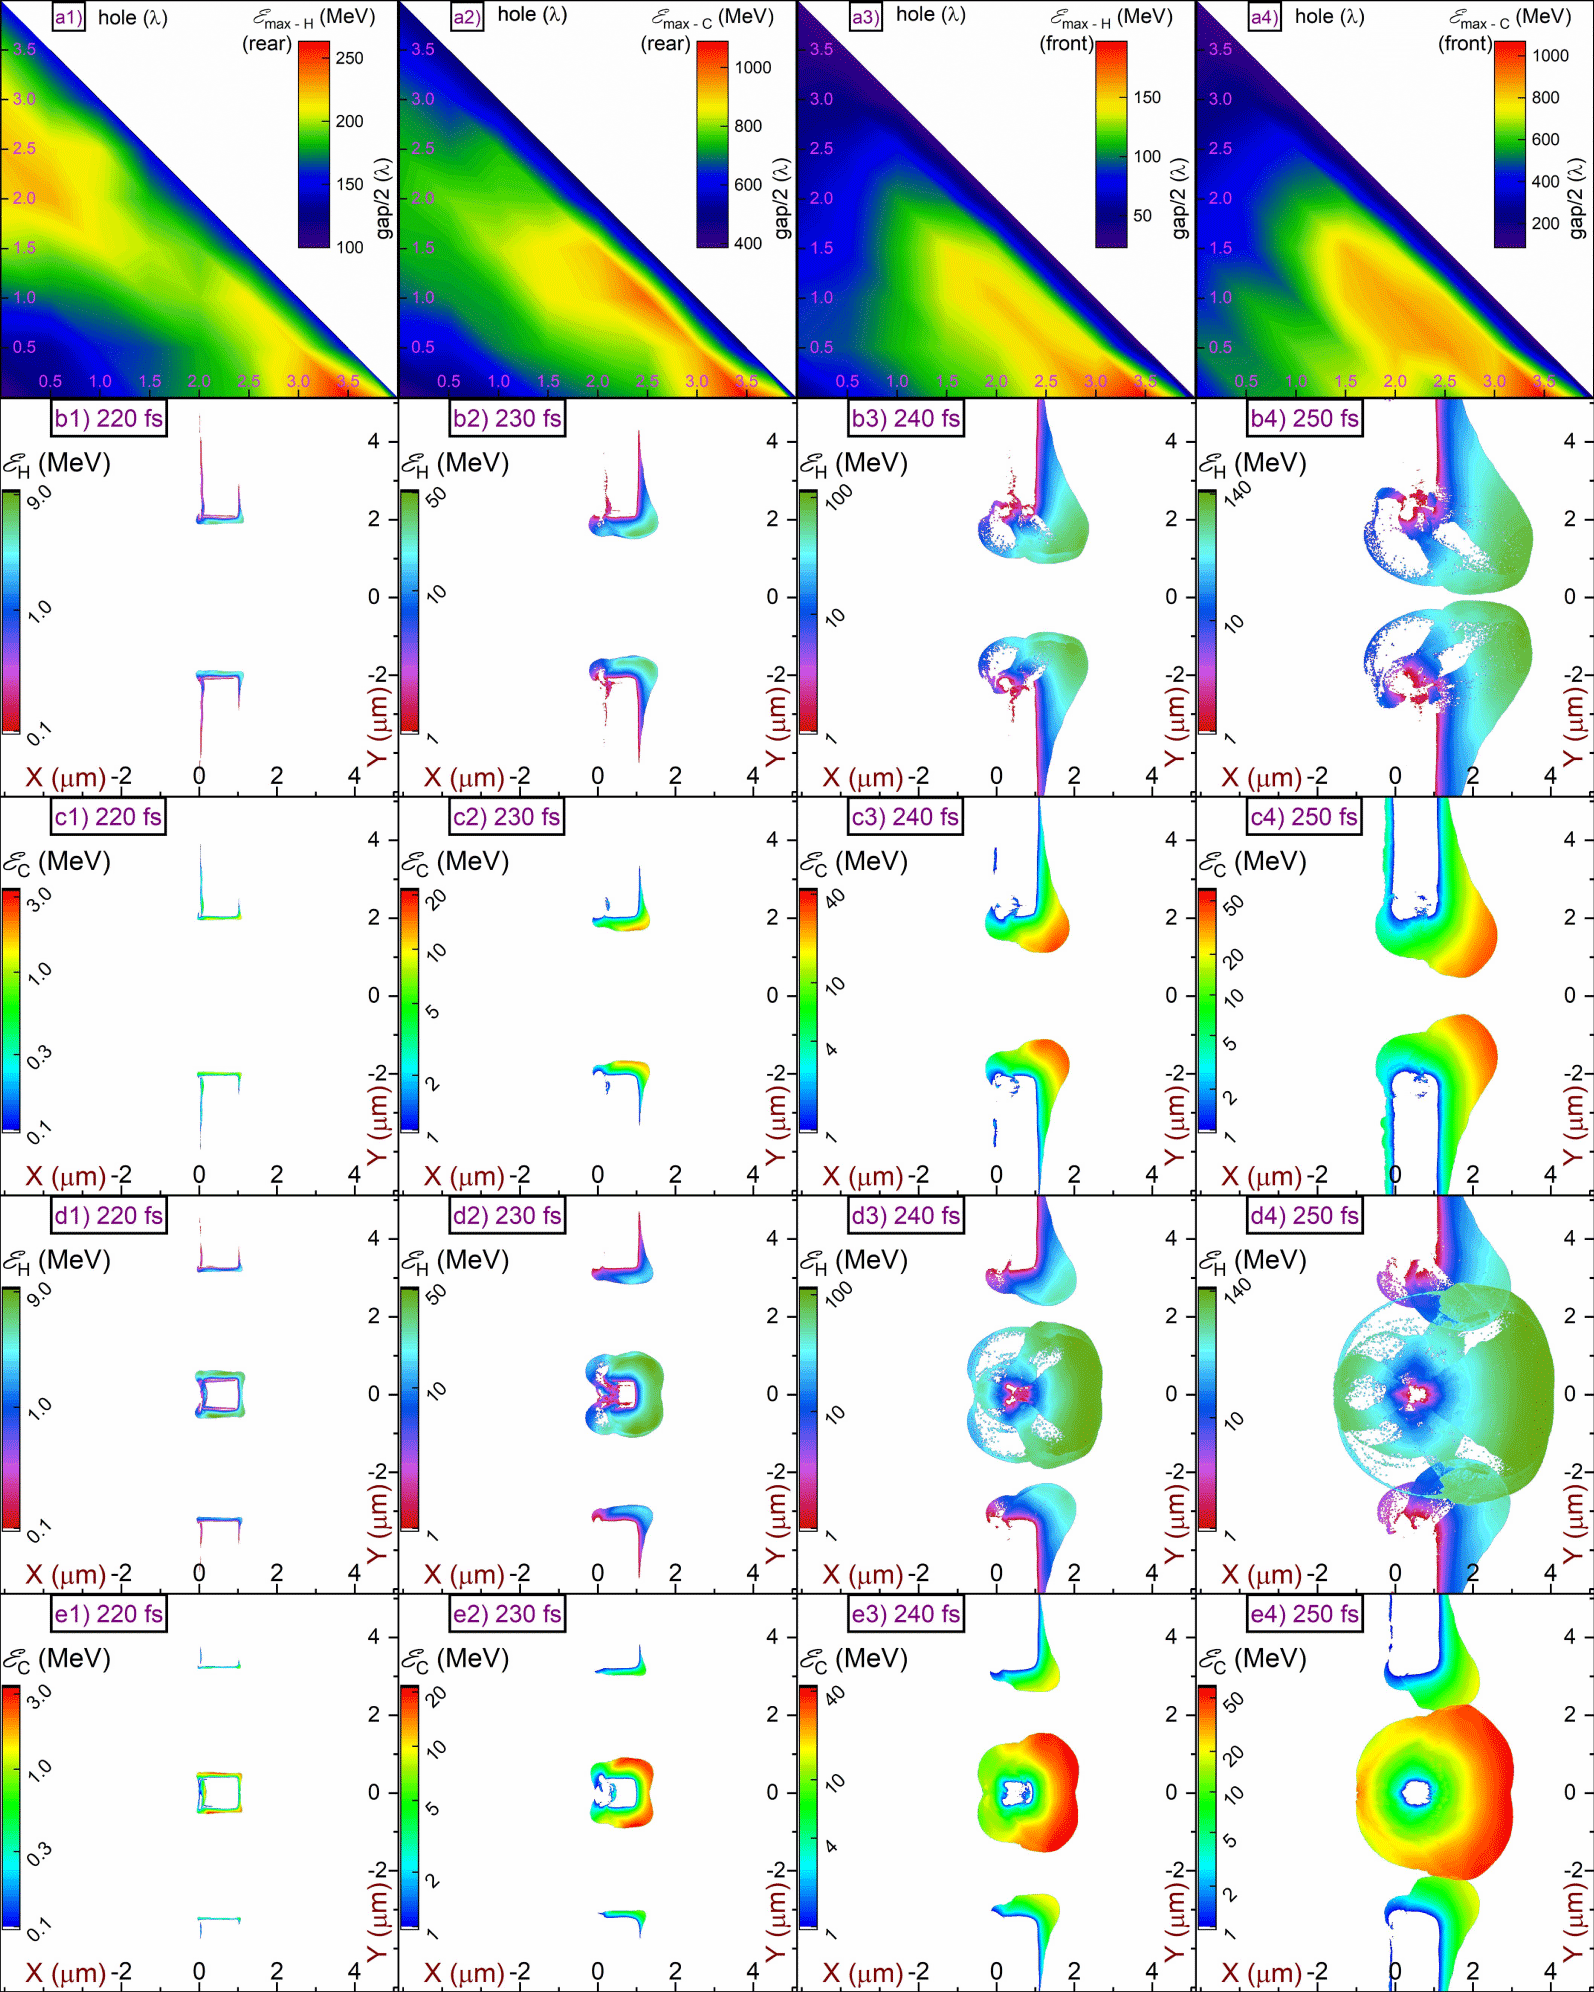
The maximum energy of holed-target (a1) rear protons, (a2) front protons, (a3) rear carbon ions and (a4) front carbon ions, by the end of the simulation. Evolution of the mean kinetic energy per cell for (b1–b4) protons and (c1–c4) carbon ions, for a HT1CH with a central hole of  $5\unicode[STIX]{x1D706}$. Evolution of the mean kinetic energy per cell for (d1–d4) protons and (e1–e4) carbon ions, for a HT2SH with two side holes of
 $3.5\unicode[STIX]{x1D706}$.

In the unique case of the flat foil, the proton acceleration is due to the TNSA mechanism. In our case the target is a  $1~\unicode[STIX]{x03BC}\text{m}$ polyethylene foil and the pulse is P-polarised, excluding any contribution of the RPA mechanism at the present intensity. Furthermore, the solid foil density does not allow the MVA mechanism to develop. Therefore, the simulations for a flat foil give only
 ${\sim}100~\text{MeV}$ protons and
 ${\sim}30~\text{MeV}$ per nucleon carbon ions, as shown in figure 6. The divergence of the beam is
 ${\sim}30^{\circ }$ full angle, as expected from the TNSA mechanism (Macchi et al. Reference Macchi, Borghesi and Passoni2013).
Let us first consider the geometrically simplest limiting case, of a HT1CH. To understand how protons are accelerated from this configuration, one must consider the proton and carbon ion mean energy evolution, shown in figures 7(b) and 7(c), respectively, along with the evolution of the field components, shown in figure 2(a). Initially, the edges of the Gaussian pulse interact with the outer segments resulting in electron ejection. Therefore, a sheath field is created at the outer segments (practically they are two independent foils) weakly accelerating protons by a TNSA-like mechanism; since the acceleration is normal on the foil surfaces (both target rear and inner), protons originate from the target corners, as shown in figure 7(b2,c2). Furthermore, electron ejection leads to accumulation of a localised net positive charge (weak CE), as seen in figure 4(b2). As a result, protons reach the target rear region, as seen in figure 7(b3,c3). There, diffraction of the laser pulse leads to development of a longitudinal electric field (see figure 2a7–a12) which then accelerates the protons, as seen in figure 7(b4,c4). Since the diffracted longitudinal electric field exists only in the target rear region, protons in the target front region are only weakly accelerated due to the initial weak CE acceleration. The simulations show that although protons are emitted with a divergence of  ${\sim}90^{\circ }$ full angle, the vast majority are confined within
 ${\sim}30^{\circ }$, as shown in figure 6(b).
The acceleration mechanism governing the second holed-target limiting case, of HT2SH, is the well-examined CE mechanism, where the expected maximum proton energy is given by  ${\mathcal{E}}_{p}\approx 173\sqrt{{\mathcal{P}}[\text{PW}]}~\text{MeV}$ (
 ${\mathcal{P}}[\text{PW}]$ is the laser power in
 $\text{PW}$) (Bulanov et al. Reference Bulanov, Daido, Esirkepov, Khoroshkov, Koga, Nishihara, Pegoraro, Tajima and Yamagiwa2004, Reference Bulanov, Wilkens, Esirkepov, Korn, Kraft, Kraft, Molls and Khoroshkov2014) and for the present intensity corresponds to
 ${\sim}180~\text{MeV}$. The strong charge imbalance observed in figure 5(c3) indicates that the CE regime has been reached. Another indication of the CE mechanism is the similar energies of both the target front and target rear protons, as shown in figure 6(c); the same applies for carbon ions, seen in figure 6(f). Again, although protons have an overall divergence of
 ${\sim}90^{\circ }$, an increased proton number is observed within a
 ${\sim}30^{\circ }$ full angle. The simulations suggest a maximum proton energy of
 ${\sim}260~\text{MeV}$, or
 ${\sim}30\,\%$ higher, than what predicted in Bulanov et al. (Reference Bulanov, Wilkens, Esirkepov, Korn, Kraft, Kraft, Molls and Khoroshkov2014). However, the holed targets do not obey a single acceleration mechanism, and additional acceleration due to the diffracted longitudinal electric field component (although not the dominant mechanism) must be acknowledged, as in the HT1CH case. Notably, if the inner segment is large enough to reflect most of the laser pulse, then electrons are not effectively ejected and the inner segment does not undergo strong CE. In that case, the situation resembles an intermediate regime of CE and TNSA, where the TNSA dominates for larger inner segments. Therefore, by increasing the inner-segment extent, the maximum proton energy is reduced, approaching the energy obtained from a flat foil.
The results for the many geometrical combinations of the holed targets are visually represented in figure 7(a1–a4), where the maximum proton and carbon ion energy is plotted as a function of the side-hole and central-hole dimensions, for both the target front and rear surfaces. From figure 7(a1) it is observed that two local maxima exist at the contour of the rear surface proton energy (figure 7a1), corresponding to the transition of the general holed-target geometry to the two limiting cases. The highest energy maximum corresponds to the HT2SH. Since in that geometry CE dominates, an energy maximum exists for the same geometric configuration (same contour location) in figure 7(a3) corresponding to the target front protons, but also in figures 7(a2) and 7(a4) corresponding to carbon ions. The extent of the inner segment suggests an optimum proton energy value, where all electrons are ejected from the inner segment, leaving an ion core. However, if the inner segment is further reduced, the ion core becomes smaller, resulting in a weaker CE. On the other hand, for the case of a HT1CH, the energy maximum is observed only in figure 7(a1) due to the absence of the longitudinal electric field in the target front region; the energy maximum is weaker in figure 7(a2) due to the lower charge to mass ratio of carbon ions compared to protons.
3.4 Electron and ion spectra from holed targets
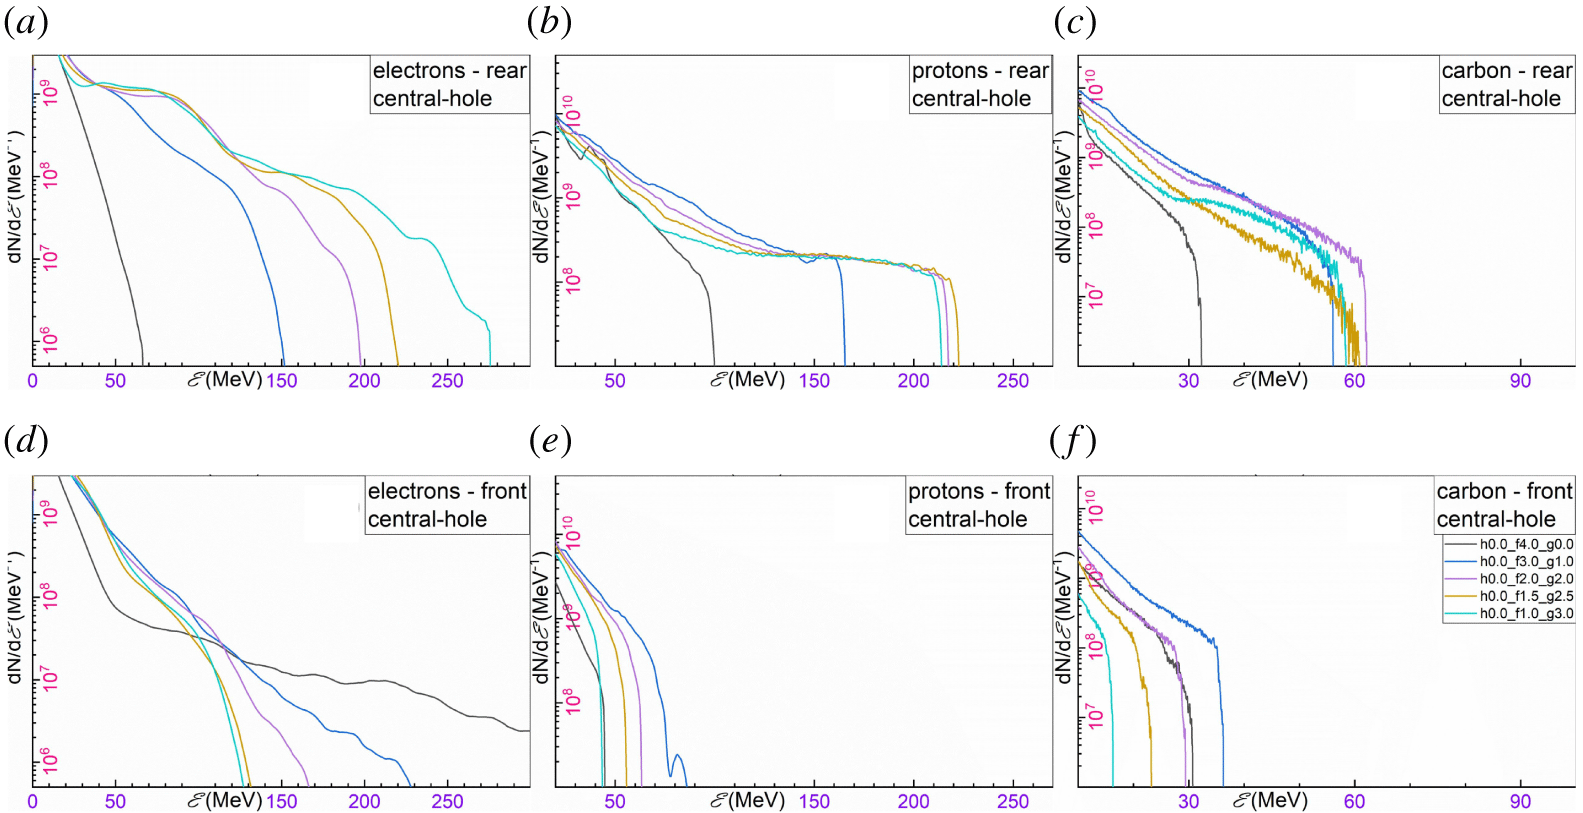
The qualitative results of figure 7(a1–a4) are quantified in figures 8 and 9, where spectra for electrons, protons and carbon ions are extracted for both limiting holed-target geometries. The spectra from the 2-D simulations have been rescaled to the equivalent 3-D spectra (Hadjisolomou et al. Reference Hadjisolomou, Tsygvintsev, Sasorov, Gasilov, Korn and Bulanov2020) assuming a  $4.75~\unicode[STIX]{x03BC}\text{m}$ emission region diameter.
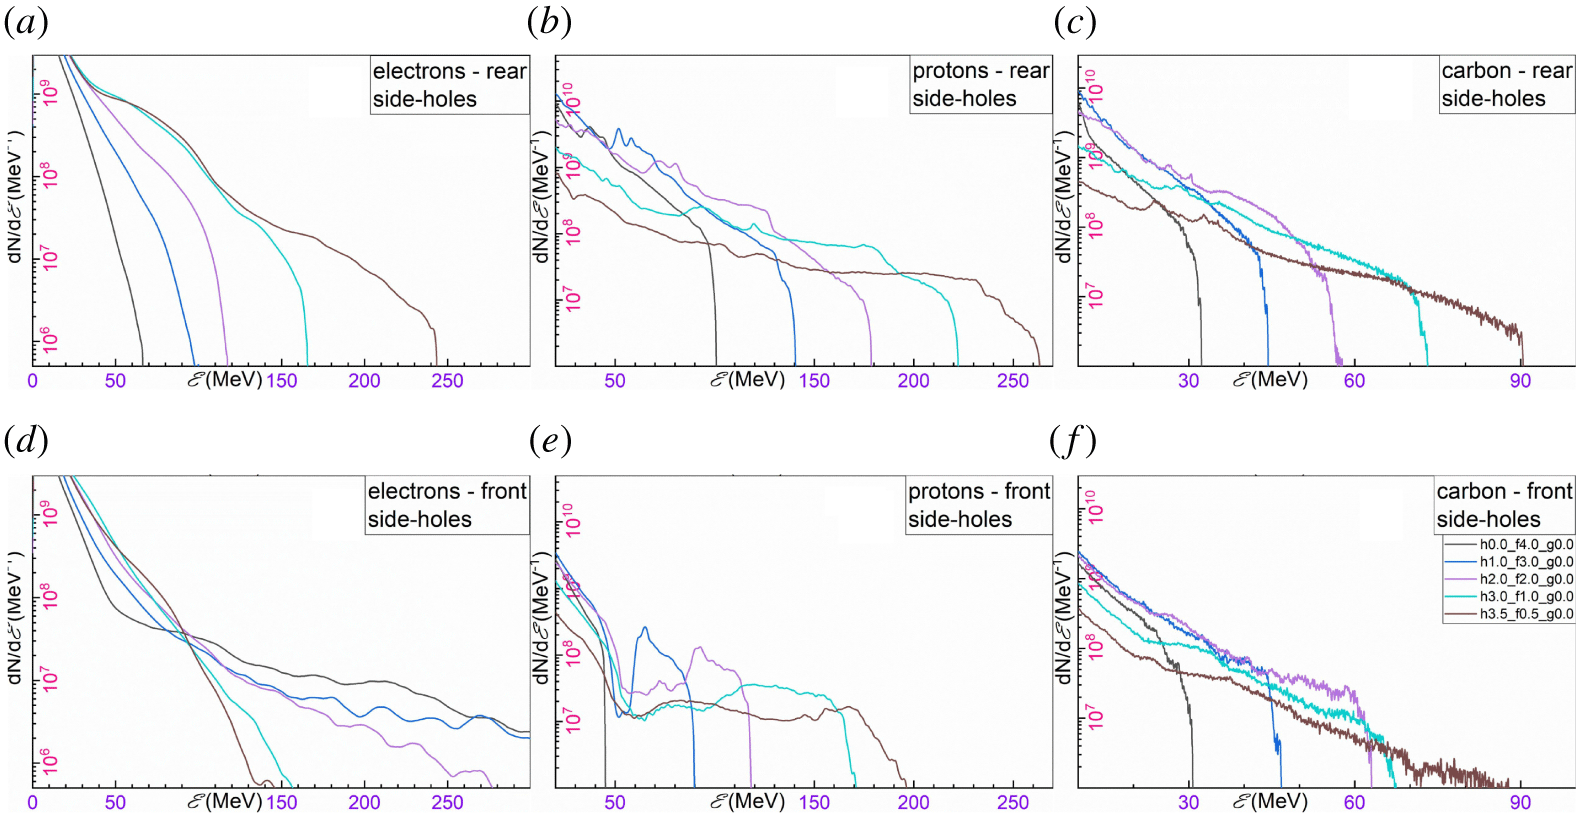
Energy spectra of (a) electrons, (b) protons and (c) carbon ions corresponding to the rear of a HT2SH. Energy spectra of (d) electrons, (e) protons and (f) carbon ions corresponding to the front of a HT2SH. The target geometry is defined by the  $g$ and
 $h$ parameters as labelled in (f), while the black line corresponds to a flat foil.

Energy spectra of (a) electrons, (b) protons and (c) carbon ions corresponding to the rear of a HT1CH. Energy spectra of (d) electrons, (e) protons and (f) carbon ions corresponding to the front of a HT1CH. The target geometry is defined by the  $g$ and
 $h$ parameters as labelled in (f), while the black line corresponds to a flat foil.

The energy gain of several hot electron populations is explained in § 3.2 and pictured in figure 3. However, the target rear electron spectra from holed targets reveal a significantly enhanced flux compared to flat foils (black line in figures 8 and 9); notably, the opposite behaviour occurs for target front electrons. The flat-foil simulations suggest a hot electron temperature of  ${\sim}5.5~\text{MeV}$; for the intensity used, Haines scaling (Haines et al. Reference Haines, Wei, Beg and Stephens2009) gives
 ${\sim}4~\text{MeV}$ and Kluge scaling (Kluge et al. Reference Kluge, Cowan, Debus, Schramm, Zeil and Bussmann2011) gives
 ${\sim}7~\text{MeV}$. On the other hand, the holed-target geometry suggests an electron temperature of
 ${\sim}30~\text{MeV}$ for HT2SH and
 ${\sim}40~\text{MeV}$ for HT1CH (brown lines in figures 8(a) and 9(a) respectively).
The target rear proton spectra for a HT2SH is shown in figure 8(b). Although the cutoff proton energy is also shown in figure 7(a), the spectra reveal the reduction of the total number of accelerated protons for increased maximum proton energy due to shrinkage of the inner segment from which the high energy protons originate. Despite the proton number reduction, a continuously increasing temperature is observed for increasing maximum proton energy (see figure 8b). Therefore, the envelope of all cases of maximum proton energy appears with an exponential-like decaying behaviour. A similar trend is also seen for carbon ions, as shown in figure 8(c).
On the other hand, the target rear proton spectra for HT1CH exhibit several qualitative differences. The maximum proton energy follows an increasing trend with increasing the central-hole extent, up to  ${\sim}2\unicode[STIX]{x1D706}$. Then, for an increasing central hole up to
 ${\sim}3\unicode[STIX]{x1D706}$ the maximum proton energy remains practically unchanged, with a maximum at
 ${\sim}2.5\unicode[STIX]{x1D706}$. Following that maximum region, further increase in the central-hole extent drastically reduces the maximum proton energy. Regardless of the target geometry, all spectra are characterised by a double exponential decaying function and a sharp cutoff energy (see figure 9b). Notably, the volumetric reduction of the number of accelerated protons is not obvious, since the accelerated protons originate from the perimeter of the central hole. For a large central hole, although a larger perimeter suggests a larger number of protons available for acceleration, a weaker combination of TNSA and CE drives less protons into the region of the accelerating component of the diffracted electric field.
3.5 Towards mass-limited targets
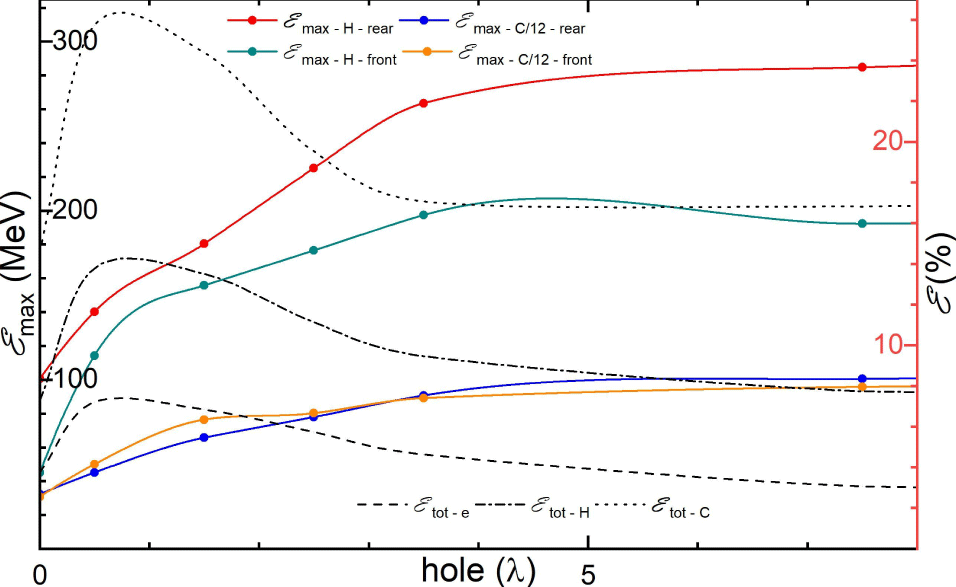
Although the concept of ML targets is very attractive due to promising simulation results on enhancement of the maximum proton energy (Limpouch et al. Reference Limpouch, Psikal, Andreev, Platonov and Kawata2008; Bulanov et al. Reference Bulanov, Litzenberg, Krushelnick and Maksimchuk2010a; Kluge et al. Reference Kluge, Enghardt, Kraft, Schramm, Zeil, Cowan and Bussmann2010; Lezhnin et al. Reference Lezhnin, Kamenets, Esirkepov, Bulanov, Klimo, Weber and Korn2016), an experimental verification and implementation of the method is challenging (Sokollik et al. Reference Sokollik, Paasch-Colberg, Gorling, Eichmann, Schnürer, Steinke, Nickles, Andreev and Sandner2010; Paasch-Colberg et al. Reference Paasch-Colberg, Sokollik, Gorling, Eichmann, Steinke, Schnürer, Nickles, Andreev and Sandner2011). However, a ML foil is the limit of a HT2SH, when the extent of the side holes tends to infinity. A summary of the simulation results is shown in figure 10, where the inner segment has  $1\unicode[STIX]{x1D706}$ extent.
The target corresponds to a generalisation of the HT2SH. By increasing the side-holes’ extent and keeping the inner segment constant, the target transits from a flat-foil to a ML target. (Left) The maximum proton and carbon ion energy per nucleon for both the target rear and front, as indicated by the labels in the figure. (Right) The percentage of the laser energy transferred to electrons, protons and carbon ions is indicated by the dash, dash-dot and dot line respectively.

At the other side of the limit, where the side holes have a zero extent, the target corresponds to a flat foil. There, the target rear protons have an energy of  ${\sim}100~\text{MeV}$. However, the addition of two side holes of
 ${\sim}2\unicode[STIX]{x1D706}$ doubles the initial energy, while expansion of the side holes to infinity approximately triples the energy. Similar observations occur for the target front protons, where a flat-foil energy of
 ${\sim}50~\text{MeV}$ becomes four times higher when the side holes tend to infinity. The same qualitative results also apply for carbon ions, where the initial
 ${\sim}35~\text{MeV}$ per nucleon are tripled, for both the target front and rear. In conclusion, the concept of a ML target gives approximately the same maximum proton energy with a HT2SH with sufficiently large side holes, of
 ${\sim}5\unicode[STIX]{x1D706}$ extent.
As mentioned for figure 5, the holed-target geometry significantly increases the transfer of laser energy into particles. This effect can also be seen by the black lines in figure 10, where the dashed, dashed-dotted and dotted lines correspond to the percentage of the laser energy transferred to electrons, protons and carbon ions respectively; notably, the trend for all three particles is very similar regardless the value of the side holes. For the case of a flat foil, the overall particle energy is  ${\sim}25\,\%$, while the addition of two side holes of
 ${\sim}1\unicode[STIX]{x1D706}$ approximately doubles the absorbed energy. However, further increase of the side-holes’ dimensions lowers the laser energy transformation since a larger portion of the pulse does not interact with the target. By increasing the side holes to
 ${\sim}3.5\unicode[STIX]{x1D706}$ (equivalent to two standard deviations of the electric field) then only
 ${\sim}5\,\%$ of the pulse interacts with the outer segments and the contribution of the pulse can be ignored. At that point, the laser energy transformation is solely due to the inner segment, saturating at an energy conversion efficiency of
 ${\sim}28\,\%$. Therefore, one must compromise between the highest proton energy obtained from ML targets and the maximum laser energy conversion efficiency obtained from HT2SH with holes of
 ${\sim}1\unicode[STIX]{x1D706}$.
4 Summary and conclusions
Microstructured targets have gained significant popularity in laser-driven particle acceleration with many target designs already proposed. In the present work an innovative target geometry is introduced, where three holes are created on a flat foil. This general holed-target geometry has two limits, where at the first limit the inner segments can be joined together, leaving only two side holes in the target and is named HT2SH. At the second limit, the inner segments are joined to the outer segments, leaving only a central hole on the foil, named HT1CH. The length sum of the three holes plus the inner segments is constant at  $8\unicode[STIX]{x1D706}$, corresponding to the electric field FWHM of the laser pulse. By plotting the contour of the side holes and the central-hole extent, all geometrical combinations of the holed targets are represented in an orthogonal triangular area, where the orthogonal angle of the triangle corresponds to a flat foil which is the common geometry of the two limit groups.
The contour plots for the laser energy transformed into particle energy reveal that the holed-target geometry significantly enhances the laser energy conversion efficiency, where for some cases the improvement is approximately double compared to flat foils. The different particles constituting the polyethylene target used do not have optimum conversion efficiency for the same holed-target geometry; electrons have an optimum at a  ${\sim}1\unicode[STIX]{x1D706}$ central hole and
 ${\sim}0.5\unicode[STIX]{x1D706}$ side holes, while protons at
 ${\sim}0.5\unicode[STIX]{x1D706}$ central hole and
 ${\sim}2.5\unicode[STIX]{x1D706}$ side holes.
The holed targets take advantage of the laser pulse reflection, diffraction and interference to manipulate the electron energy spectra and their spatial distribution. If a hot electron population is captured by the laser pulse then it is continuously accelerated until it is dephased. In the case of a flat foil, most of the pulse is reflected by the foil front surface and the captured electrons are accelerated in a direction opposite to the laser pulse. On the other hand, the holed-target geometry diffracts the pulse on the target rear region, where the electrons are now favourably accelerated. In addition, the electron temperature is significantly enhanced by holed targets. However, this optimised behaviour ceases if the holes become extremely large, because the pulse edges do not sufficiently generate hot electrons at the initial stages of the interaction.
The maximum proton energy contour plots for the target rear create a pattern where two local maxima are observed. These two maxima correspond to the two limiting cases of the general holed-target geometry, where the highest is for the HT2SH. The dominant acceleration mechanism on that limit is the CE acceleration, where by reducing the dimensions of the inner segment to an optimum value, protons of  ${\sim}260~\text{MeV}$ are emitted. This value is higher than the
 ${\sim}180~\text{MeV}$ predicted for CE, indicating that the acceleration is slightly enhanced by a secondary mechanism. This secondary mechanism is the main acceleration mechanism for HT1SH. There, due to diffraction of the laser pulse, a longitudinal electric field is created which is responsible for the
 ${\sim}220~\text{MeV}$ proton energy observed. In contrast with CE, only low energy target front protons are emitted.
If the length sum of the side holes and the inner segments is not constant then another limiting case is considered by generalisation of the HT2SH (which is a sub-case itself), which is the transition from a flat foil to a ML target. This transition occurs by keeping the central foil constant and gradually increasing the extent of the side holes. It is found that the energy absorption is optimised for side holes of  ${\sim}1\unicode[STIX]{x1D706}$ and it rapidly drops as the transition to ML targets occurs, due to less available particles in the laser focal spot. On the other hand, the maximum proton energy is significantly increased for increased side-holes’ extent, where a near-maximum value is obtained for side holes of
 ${\sim}4\unicode[STIX]{x1D706}$, indicating that the ML targets have almost no benefit in particle acceleration compared to holed targets. Therefore, a compromise must be made regarding optimisation of both conversion efficiency and maximum proton energy.
Acknowledgements
The authors acknowledge fruitful discussions with P. Sasorov and T. M. Jeong, and thank A. Molodozhentsev for providing a significant part of the computational resources used. This work is supported by the project High Field Initiative (CZ.02.1.01/0.0/0.0/15_003/0000449) from the European Regional Development Fund. It was also in part funded by the UK EPSRC grants EP/G054950/1, EP/G056803/1, EP/G055165/1 and EP/M022463/1.