I. INTRODUCTION
In the last decades, transition metal diborides based ultrahigh temperature ceramics (UHTCs) have received wide attentions for the potential applications in extreme environments such as the nose tip and sharp leading edges of hypersonic vehicles and hot structure components for scramjet engines. Reference van Wie, Drewry, King and Hudson1,Reference Opeka, Talmy and Zaykoski2 They are also attractive for many other applications like cutting tools, impact resistant armor, wear resistant coating, and electrode materials owing to the combination of properties including high melting point, high hardness, high strength, electrical conductivity, absence of phase changes in the solid state, and exceptional corrosion and erosion resistance in many harsh environments. Reference Munro3–Reference Zhou, Xiang, Feng and Li5 Among them, titanium diboride (TiB2) is particularly intriguing because of its low density, remarkable thermal, and chemical stability. Despite having these excellent properties, the broader applications of monolithic TiB2 are rather limited because of poor sinterability and grain coarsening at high temperatures. Reference Murthy, Basu and Balsubramaniam6 Due to the anisotropic thermal expansion of TiB2, Reference Lönnberg7–Reference Xiang, Feng, Li and Zhou9 localized residual stress arises primarily from the thermal expansion mismatch between individual grains during the cooling process after sintering. Reference Evans10 The exaggerated grain growth and anisotropic crystallite morphology aggravate the mismatch and result in microcracking which is harmful to the mechanical properties. Since the grain size and grain morphology are strongly related to the surface stability, investigation on the surface stability of TiB2 becomes emergent to gain a deep insight into its grain coarsening mechanism.
Unfortunately, limited by the development of preparation techniques and test methods, experimental investigations of TiB2 surfaces are still absent. Since theoretical investigations on influence of microstructures, e.g., point defect and grain boundary, are found to be meaningful, Reference Liu, Cooper, Zhang and Weber11,Reference Zhang, Liu and Wang12 theoretical prediction could also be a promising way for the surface study and have attracted several attention. Han et al. revealed the different relaxations and charge accumulations within the top three atomic layers for both Ti- and B-terminated TiB2(0001) surfaces, and predicted that the Ti-terminated one was thermodynamically more favorable over a wide range of possible chemical potentials. Reference Han, Dai, Shu, Wang and Sun13 Volonakis et al. estimated the surface formation energy of TiB2 and studied the adsorption of H2, O2, and H2O on its surfaces with the help of density functional theory (DFT) calculations. Reference Volonakis, Tsetseris and Logothetidis14 Although these results are very useful in understanding the stability and the initial adsorption of TiB2, they are not sufficient to understand the grain morphology of TiB2 since a hexagonal plate-like grain shape was detected in the synthesized TiB2 powders. Reference Kang and Kim15–Reference Shahbahrami, Fard and Sedghi17
TiB2 crystallizes in an AlB2-type structure with the space group of P6/mmm (No. 191), where Ti atoms are located at 1a (0, 0, 0) Wyckoff positions and B atoms are located at 2d (1/3, 2/3, 1/2) Wyckoff positions. According to the hexagonal structure of TiB2, it is easy to identify that the basal plane of the plate-like grain shape is parallel to the (0001) plane. Since the presence of steps or crevices on a surface increases the growth rate by raising the sticking coefficient of approaching atoms, the surfaces with smaller facet indexes and higher atomic density tend to be more stable than the others and would appear in the final grain morphology.
Reference Newnham18
Then it also can be deduced that the side surfaces of plate-like TiB2 grains are covered with
 $\left( {11\bar 20} \right)$
or
 $\left( {10\bar 10} \right)$
surfaces. However, these two prismatic surfaces are seldom investigated, and the anisotropic surface stability is not well comprehended.
To get a clear view on the anisotropic surface stability, six types of TiB2 surfaces, including (0001)-Ti and (0001)-B [Ti- and B-terminated (0001) surfaces],
 $\left( {11\bar 20} \right)$
,
 $\left( {10\bar 10} \right)$
-Ti [Ti-terminated
 $\left( {10\bar 10} \right)$
surface],
 $\left( {10\bar 10} \right)$
-B(Ti) [B-terminated
 $\left( {10\bar 10} \right)$
surface with Ti as second layer], and
 $\left( {10\bar 10} \right)$
-B(B) [
 $\left( {10\bar 10} \right)$
surface terminated by two layers of B], are investigated in this work by using the first-principles calculations based on DFT. The surface energies are calculated by using a series of two-region models. The electronic structures and bonding features of these surfaces are also investigated, and their effects on the exaggerate grain growth and anisotropic crystallite shape are discussed. As we will show in later sections, the
 $\left( {11\bar 20} \right)$
surface is more stable than (0001) and
 $\left( {10\bar 10} \right)$
surfaces and the B-terminated surfaces are more stable than the Ti-terminated ones. The high surface energy of TiB2 is one of the main reasons for the easy coarsening of TiB2 grains during sintering. These results are helpful in understanding the grain coarsening mechanism, as well as controlling the grain morphologies and tailoring mechanical properties of TiB2.
II. CALCULATION METHODS
First-principles calculations are carried out based on the density functional theory using the Cambridge Serial Total Energy Package (CASTEP) code, Reference Segall, Lindan, Probert, Pickard, Hasnip, Clark and Payne19 wherein the Vanderbilt-type ultrasoft pseudopotentials Reference Vanderbilt20 are used to represent the interactions between the ionic cores and the valence electrons. The exchange-correlation energy is treated under generalized gradient approximation (GGA) of Perdew–Burke–Ernzerhof (PBE) scheme. Reference Perdew, Burke and Ernzerhof21 The plane-wave basis set cut-off energy is fixed at 450 eV for all calculations. The special point sampling integration over the Brillouin zone is used by using the Monkhorst Pack method, Reference Pack and Monkhorst22 and the k-point separations are set as 0.04 Å−1. To obtain the accurate surface properties, the surface models are optimized by using the Broyden–Fletcher–Goldfarb–Shanno (BFGS) minimization scheme. Reference Pfrommer, Côté, Louie and Cohen23 The tolerances for geometry optimization are different on total energy within 5 × 10⁻⁶ eV/atom, maximum ionic Hellmann–Feynman forces within 0.01 eV/Å, maximum stress within 0.02 GPa, and maximum ionic displacements within 5 × 10⁻⁴ Å. Our previous work Reference Zhou, Xiang, Feng and Li5 had demonstrated that the geometry optimized lattice constants of bulk TiB2 are a = 3.029 Å and c = 3.219 Å, which are close to the experimental data (a = 3.038 Å, c = 3.220 Å) Reference Vajeeston, Ravindran, Ravi and Asokamani24 and also agree with the calculated values reported in other theoretical works. Reference Han, Dai, Shu, Wang and Sun13,Reference Volonakis, Tsetseris and Logothetidis14 This bulk geometry is used as the initial input for the surface optimizations. The calculations of projected density of states (DOS) are performed using a projection of the plane-wave electronic states onto a linear combination of atomic orbitals (LCAO) basis set.
III. RESULTS AND DISCUSSION
A. Surface energy
The surface energy is the criterion to evaluate the surface stability, which is defined as the excess energy at the surface of a material compared to the bulk Reference Gale and Rohl25
 $${E_{{\rm{surf}}}} = {1 \over A}\left( {{E_{{\rm{slab}}}} - {E_{{\rm{bulk}}}}} \right)\quad ,$$
where A is the surface area, E
slab is the total energy of the surface slab, and E
bulk is the energy of the bulk material with the same component. The accurate E
surf can only be calculated when the surface model has the same stoichiometry as the bulk material. So the two-region modeling method is involved.
Reference Gale and Rohl25
As shown in Fig. 1, each model employs a two-dimensional slab that contains layers of Ti and B atoms and is separated by a 15 Å vacuum gap, and the slab has been divided into two regions. Region 1 contains the surface and several atomic layers below it, while region 2 is assumed as the inside part of the bulk material. The initial model is built according to the bulk crystal structure, and then its cell is locked both in size and shape. The atoms in region 1 are free to relax during the geometry optimization; in the meantime, those in region 2 are totally fixed. In other words, region 1 represents the real surface slab, and there is only one surface which needs to be considered in this configuration. In this way, the number of atomic layers for each model is more freely to choose to construct a stoichiometric surface slab. In addition, it is necessary to insure that region 1 and region 2 are thick enough because the properties of the innermost layer of region 1 must converge to those of the bulk. Then a convergence test on the relaxation of the interlayer distance, Δ
i–j
= d
ij
/d
bulk − 1, of the surface models with different layer numbers is arranged. As shown in Table I, when the layer numbers in region 1 and region 2 are set as 6 and 6 for (0001)-Ti, 8 and 6 for (0001)-B, 6 and 5 for
 $\left( {11\bar 20} \right)$
, 9 and 9 for
 $\left( {10\bar 10} \right)$
-Ti, and 12 and 9 for
 $\left( {10\bar 10} \right)$
-B(Ti) and
 $\left( {10\bar 10} \right)$
-B(B), geometry optimizations show that the relaxations of the innermost interlayer distance in all of these models are less than 0.16%, indicating a well converged lattice structure.
Side view of the two-region models of TiB2 (a) (0001)-Ti, (b) (0001)-B, (c)
 $\left( {11\bar 20} \right)$
, (d)
 $\left( {10\bar 10} \right)$
-Ti, (e)
 $\left( {10\bar 10} \right)$
-B(Ti), and (f)
 $\left( {10\bar 10} \right)$
-B(B) surfaces. The Ti atoms are shown as big gray balls, the B atoms are shown as small pink balls, and the dark blue balls represent the fixed atoms during the geometry optimization.

Interlayer distance relaxations, Δ i–j = d ij /d bulk − 1, for TiB2 surfaces.

The total energy of this two-region model can be divided into three parts,
 $${E_{{\rm{total}}}} = {E_{11}} + {E_{22}} + {E_{12}}\quad ,$$
where E 11 and E 22 represent the interaction energies within each region, and E 12 corresponds to the interaction energy between two regions. Since E 11 and E 22 can be calculated directly with the partial model by removing the atoms in the other region from the surface model, E 12 is obtained by deducting the former ones from the total energy
 $${E_{12}} = {E_{{\rm{total}}}} - {E_{11}} - {E_{22}}\quad .$$
Since region 2 is assumed to be the bulk part, the energy in region 2 should not be included by the surface energy. But the energy change of region 2 induced by the atoms in region 1 still contributes to the total energy. Therefore, the surface slab energy only contains the interaction energy within region 1 and half of the interaction energy between the two regions
 $${E_{{\rm{slab}}}} = {E_{11}} + {1 \over 2}{E_{12}} = {1 \over 2}\left( {{E_{{\rm{total}}}} + {E_{11}} - {E_{22}}} \right)\quad .$$
The reliability and accuracy of the two-region models have already been demonstrated in the investigation of ZrB2 surfaces.
Reference Sun, Liu, Xiang and Zhou26
In the same way, the surface energies of six kinds of TiB2 surfaces are calculated, as listed in Table II. The surface energy of (0001)-B is 4.207 J/m2, while that of (0001)-Ti is only 0.026 J/m2 higher. Compared with the two (0001) surfaces,
 $\left( {10\bar 10} \right)$
-B(B) has a lower surface energy of 4.192 J/m2, but the other
 $\left( {10\bar 10} \right)$
surfaces hold much higher energies. The
 $\left( {11\bar 20} \right)$
surface keeps the lowest surface energy of 4.112 J/m2.
Calculated surface energies of TiB2. M represents the metal element in diborides.

It is worth noting that the surface energies of TiB2 are much higher than those of ZrB2 with the similar structure (as listed in Table II). The surface energies of TiB2 arise for about 0.3 J/m2 on the (0001) surfaces, and the surface energy increases are even up to 0.5–0.8 J/m2 on
 $\left( {10\bar 10} \right)$
and
 $\left( {11\bar 20} \right)$
surfaces. This is because the chemical bonds in TiB2 are much stronger than those in ZrB2, which can be deduced from the higher modulus and shorter bond lengths of TiB2.
Reference Zhou, Xiang, Feng and Li5
In other words, a higher cleaving energy is required for breaking the stronger chemical bonds during the formation of surface, which finally leads to the higher surface energy of TiB2. Since a higher surface energy indicates a less stable surface, to reduce the surface area, the TiB2 grain will grow much bigger than that of ZrB2 if they were in the same condition. Thus, the grain coarsening may occur easily during the sintering of TiB2. It has been found that the TiB2 grain size increases quickly with the increasing temperature and dwell time in the course of hot pressing sintering of TiB2.
Reference Wang, Fu, Wang and Yuan27
Ferber et al. also reported that sintering of TiB2 at high temperatures resulted in grains above a critical size of 15 μm, which caused spontaneous microcracking of the material upon cooling.
Reference Ferber, Becher and Finch28
So the high surface energy of TiB2 is one of the essential factors for the difficulty of sintering.
B. Anisotropic surface stability
Besides the high surface energy, it is also noticeable that the surface stability of TiB2 is anisotropic. Since a lower surface energy always leads to an energetically stable surface, the surface stability sequence of TiB2 is
 $\left( {11\bar 20} \right)$
>
 $\left( {10\bar 10} \right)$
-B(B) > (0001)-B > (0001)-Ti >
 $\left( {10\bar 10} \right)$
-B(Ti) >
 $\left( {10\bar 10} \right)$
-Ti. It is also notable that although this sequence resembles that of ZrB2 surfaces, the surface energy differences in TiB2 are much different from those in ZrB2, which will lead to the different anisotropy in surface stability. This is a result of the anisotropic bonding feature on surfaces and will be discussed in the next section.
The anisotropy in surface stability is helpful in understanding the growth morphology of TiB2 grains. In general, crystal growth is a combination of mass transport, surface attachment, and crystallization. Since TiB2 is usually synthesized by a solid-state reaction, the crystal growth of TiB2 during synthesis can be regarded as following. TiB2 initially nucleates at the boundary between boron source and titanium source particles. The two source substances are separated by the grown TiB2 grain, and the subsequent reaction relies on the atomic diffusion across the TiB2 grain.
Reference Fan, Guo and Cantor29
Then the generated TiB2 units crystallize on the grain surfaces which results in the grain growth. Therefore, atomic diffusion and crystallization on surfaces are the main procedures dominating the crystal growth. Higher surface energy generally corresponds to strong attachment and quick crystallization. Hence, the crystallization rate on
 $\left( {11\bar 20} \right)$
,
 $\left( {10\bar 10} \right)$
-B(B), (0001)-B, and (0001)-Ti surfaces may be similar, which are slower than those on
 $\left( {10\bar 10} \right)$
-B(Ti) and
 $\left( {10\bar 10} \right)$
-Ti surfaces. Since the three
 $\left( {10\bar 10} \right)$
surfaces alternate during the growth, the crystallization rate along the direction normal to
 $\left( {10\bar 10} \right)$
surface can be faster than those along 〈0001〉 and the direction normal to
 $\left( {11\bar 20} \right)$
surface. Besides, the atomic diffusion within the (0001) plane requires lower activation energy than that along the normal direction, owing to the compact arrangement in the (0001) plane.
Reference Fan, Guo and Cantor29
In other words, diffusion rates along directions normal to
 $\left( {10\bar 10} \right)$
and
 $\left( {11\bar 20} \right)$
surfaces are faster than that along 〈0001〉. Combining both the fast diffusion rate and crystallization rate, the growth rate along the direction normal to
 $\left( {10\bar 10} \right)$
is faster than that along the direction normal to
 $\left( {11\bar 20} \right)$
, and much faster than that along 〈0001〉. This anisotropic growth rate suggests a hexagonal plate-like grain morphology of TiB2 with the plate perpendicular to 〈0001〉 directions, and the final grain is supposed to be covered by the more stable surfaces, i.e.,
 $\left( {11\bar 20} \right)$
and (0001)-B. This hexagonal shape coincides with the observations in as-synthesized TiB2 powders.
Reference Kang and Kim15–Reference Shahbahrami, Fard and Sedghi17
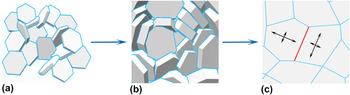
The grain coarsening procedure of TiB2 during high temperature sintering is schematically shown in Fig. 2. The initial TiB2 powders are thin plate like, then the grains become large sized and close packed during the sintering. Due to the smaller anisotropy in the grain growth at high temperatures, the aspect ratio of grains may be increased mildly in the course of growth. However, the anisotropy in grain morphology leads to the irregular grain distribution during packing [Fig. 2(b)], which also presents an opportunity of abnormal grain growth. As can be seen from Fig. 2(c), owing to the anisotropy in thermal expansion, Reference Xiang, Feng, Li and Zhou9 the mismatch of crystal orientations between neighboring grains can cause residual stress at the grain boundary during cooling. Then, microcracking occurs easily with the high residual stress, as the enlarged grain size will aggravate the mismatch of thermal expansion. Therefore, microcracking in sintered TiB2 cannot be avoided through this grain growth procedure.
Illustration of the grain coarsening procedure of TiB2: (a) The plate-like grains in TiB2 powders, (b) packed grown grains, and (c) densified TiB2. The anisotropic arrows illustrate the anisotropy in thermal expansion. The mismatch of thermal expansion can cause residual stress at the grain boundary (shown in red) and result in microcracking during cooling.

C. Bonding features on surfaces
The anisotropic surface stability of TiB2 is resulted from the anisotropic bonding features on the surfaces. The electronic structure and chemical bonding of bulk TiB2 had been discussed in our previous work. Reference Zhou, Xiang, Feng and Li5 There are both σ-type and π-type covalent bonds between the neighboring B atoms in the graphite-like B layer on the (0002) plane, and the interaction between Ti and B atoms is ionic-covalent, while only the metallic bond appears in the Ti layer. To further understand the anisotropic surface stability of TiB2, the electronic structure and bonding nature on these surfaces are investigated by analyzing the charge distribution and DOS of surface atoms.
Due to the different bonding environments, the DOS of the surface atoms is much different from those in the bulk, as can be seen from Fig. 3. The surface Ti atom contains much more electrons than that in the bulk. On (0001)-Ti and
 $\left( {10\bar 10} \right)$
-Ti, the surface Ti atom is only surrounded by 6 B atoms (versus 12 B atoms in the bulk). The excess electrons mainly fill in the high energy orbitals and cause a huge peak at the Fermi level [Figs. 3(b) and 3(e)]. On the
 $\left( {11\bar 20} \right)$
surface, although the Ti atom also appears in the first layer, it has a bigger coordination number of 8, so the DOS at the Fermi level is much smaller in Fig. 3(d). In contrast, the surface B atom is electron deficient owing to the lack of Ti–B and B–B interactions. To compensate for the bonding deficiency of surface atoms, the surrounding chemical bonds are automatically enhanced during the relaxation of surface structures, which can be deduced from the contracted bond lengths and the overlapping of DOS peaks. So the surface structure is stabilized through relaxation, and the surface energy is relatively lower than the cleaving energy that required for breaking the chemical bonds.
The projected DOS of the Ti and B atoms (a) in the bulk, (b) on (0001)-Ti, (c) (0001)-B, (d)
 $\left( {11\bar 20} \right)$
, (e)
 $\left( {10\bar 10} \right)$
-Ti, (f)
 $\left( {10\bar 10} \right)$
-B(Ti), and (g)
 $\left( {10\bar 10} \right)$
-B(B) surfaces of TiB2. The layer in which the atom locates is marked for each atom. The vertical dotted line at 0 eV marks the Fermi level.

On (0001)-B, as shown in Fig. 3(c), multiple electron states of the B atom overlap with those of the Ti atom from −2.5 eV to the Fermi level, indicating the new Ti–B interaction on (0001)-B, the additional charge accumulating between surface B atoms and the Ti atom in the second layer could also confirm the extra electron transfer from Ti to the surface B atom [Fig. 4(a)]. However, as can be seen from Fig. 3(b), there are no such new bonding states in the DOS on (0001)-Ti and the DOS of the B atom in the second layer of (0001)-Ti is very similar to that of the B atom in the bulk. As shown in Fig. 4(b), only a small part of the excess electrons of surface Ti atoms is involved by the B–B π bonds; the other parts still distribute in the (0001) Ti plane. In other words, the relaxations of the remaining bonds on the two (0001) surfaces are quite different. This is because the Ti atom in the second layer of (0001)-B still keeps several d electrons in the Ti–Ti metallic bonds, which can be deprived by the surface B atom to form new Ti–B bonds, but the orbitals of B atom in the second layer of (0001)-Ti are almost saturated. Thus, the Ti–B bond on (0001)-B becomes much stronger and the bond length is shorter than that on (0001)-Ti. This shorter bond length contributes to the bigger interlayer distance relaxation of (0001)-B (Table I), which coincides with the results of Han et al. Reference Han, Dai, Shu, Wang and Sun13 Since the required cleaving energies for the two (0001) surfaces are the same, the difference in the surface relaxation will lead (0001)-B to be more stable.
The differential charge density of (a) (0001)-B and (b) (0001)-Ti surfaces on the
 $\left( {11\bar 20} \right)$
plane. The positive charges are shown as blue, and negative ones are shown as red.

Besides the surface Ti atoms, B atoms also exist on the
 $\left( {11\bar 20} \right)$
surface. Different from that on (0001)-B, the B atom on the
 $\left( {11\bar 20} \right)$
surface is lack of one B–B covalent bond. The unbonded electrons of surface B atoms can participate in the π bonding in the B plane; as shown in Fig. 5(a), the surface B–B bond is enhanced and contracts from 1.749 to 1.684 Å in length. Meanwhile, as can be seen from Fig. 5(b), there is an electron accumulation between surface B and surface Ti atoms, which indicates that the covalent part of Ti–B interaction increases and it becomes stronger than those in the bulk. The surface B atom still keeps the sp
2 hybridization, and the unbonded sp
2 orbital combines with a part of the p
z
orbital and turns to a spindle shape perpendicular to the B plane. Then this large shape orbital can overlap with the 3d(t
2g) orbitals of two surface Ti atoms simultaneously. The overlapping of DOS near the Fermi level also indicates the strengthened interaction between surface Ti and B atoms [Fig. 3(d)]. In this way, the bonding statuses for both surface Ti and B atoms are ameliorated. Combined with the Ti–B bonds between first two layers, the interactions around the surface atoms make more contributions to the relaxation of the
 $\left( {11\bar 20} \right)$
surface, which results in a lower surface energy.
The differential charge density of the
 $\left( {11\bar 20} \right)$
surface on the (a) (0001) B-plane and (b)
 $\left( {11\bar 20} \right)$
plane across the surface B atoms. The positive charges are shown as blue, and negative ones are shown as red.

Because of the bonding deficiency of the atoms in the first two layers, the remaining bonds around the atoms on
 $\left( {10\bar 10} \right)$
surfaces are also obviously enhanced, which result in the more evident relaxations of the first interlayer distance (in Table I). Similar to the
 $\left( {11\bar 20} \right)$
surface, there is an enhanced Ti–B interaction on
 $\left( {10\bar 10} \right)$
-Ti due to the unfilled orbitals of the B atom in the second layer, which can be deduced from the overlapping of DOS at −2.5 eV [Fig. 3(e)]. Unfortunately, the B–B bonds between the second and third layers are not strengthened but extend to 1.757 Å in length, as can be seen from Fig. 6(a). So the contribution of the surface relaxation to the surface energy is limited on
 $\left( {10\bar 10} \right)$
-Ti. The B atom on
 $\left( {10\bar 10} \right)$
-B(Ti) can only form one B–B covalent bond with the B atom in the third layer. As shown in Fig. 6(b), this B–B interaction involves part of the unbonded electrons and contracts to 1.684 Å in length, but the other electrons still distribute in the unbonded p orbitals of the surface B atom and participate in the Ti–B interaction, which leads to the increased DOS at −2.1 eV [Fig. 3(f)]. However, on
 $\left( {10\bar 10} \right)$
-B(B), the unbonded electron of the surface B atom mainly fills in the B–B bond within the first two layers, which contract to 1.613 Å in length and become quite strong, as shown in Fig. 6(c). This significant change of chemical bonding can strongly make up the electron deficiency of B atoms in the first two layers simultaneously. Furthermore, there are also enhanced Ti–B interactions [the overlapped peaks at −0.5 eV in Fig. 3(g)] around the surface B atoms. Thus, despite the same cleaving energies,
 $\left( {10\bar 10} \right)$
-B(B) is much more stable than
 $\left( {10\bar 10} \right)$
-Ti owing to the more evident surface relaxation.
The differential charge density of (a)
 $\left( {10\bar 10} \right)$
-Ti, (b)
 $\left( {10\bar 10} \right)$
-B(Ti), and (c)
 $\left( {10\bar 10} \right)$
-B(B) surfaces on the (0001) B-plane. The positive charges are shown as blue, and negative ones are shown as red.

On the cleaving aspect, only Ti–B bonds are broken on (0001) surfaces, while B–B interactions are also involved on
 $\left( {10\bar 10} \right)$
and
 $\left( {11\bar 20} \right)$
surfaces. Since the strength difference between these two types of bonds in TiB2 is enlarged from that in ZrB2, the surface energies of
 $\left( {10\bar 10} \right)$
and
 $\left( {11\bar 20} \right)$
surfaces increase more evidently than that of (0001) surfaces in TiB2. And on the aspect of surface relaxation, the graphite-like conjugation structure in the B plane can gather electrons and contribute to the enhanced B–B and Ti–B interactions around the surface B atom. The contribution of enhanced interactions and the absence of huge peak at the Fermi level make the B-terminated surfaces to be more stable than the Ti-terminated ones. It is also obvious that the enhancement of B–B covalent bonding makes a greater contribution to compensate for the bonding deficiency of the surface atom than that of the Ti–B interaction. Thus, the relaxation aspect also plays an important role in surface energy, which even conquer the barrier of cleaving energy and lead to the better stability of the
 $\left( {10\bar 10} \right)$
-B(B) surface.
IV. CONCLUSION
In this work, the stability and bonding features of (0001),
 $\left( {11\bar 20} \right)$
, and
 $\left( {10\bar 10} \right)$
surfaces of TiB2 are investigated using DFT calculations. By employing the two-region modeling method, all surfaces are imitated and each of the surface energy is calculated. The
 $\left( {11\bar 20} \right)$
surface is found to be more stable than (0001) and
 $\left( {10\bar 10} \right)$
surfaces. The grains in as-synthesized TiB2 powders are predicted to be covered by (0001)-B and
 $\left( {11\bar 20} \right)$
surfaces, and present with hexagonal plate-like morphology which coincide with the experimental observations. The conjugation system in the B plane can collect the unbonded electrons of surface B atoms and enhance the B–B interaction on the surface, while the expanded B orbitals can also intensify the covalent Ti–B interaction. The different bonding conditions of surface Ti and B atoms result in the difference of surface structure relaxation between Ti- and B-terminated surfaces, and lead to the B-terminated one being more stable. It is also found that the surface energies of TiB2 are much higher than those of ZrB2 with a similar structure. This may be due to the stronger chemical bonding in TiB2 and is responsible for the easy coarsening of TiB2.
ACKNOWLEDGMENTS
This work was supported by the Natural Sciences Foundation of China under Grant No. U1435206 and No. 51672064, and Beijing Municipal Science & Technology Commission under Grant number Z151100003315012 and D161100002416001.