There is no doubt that overweight and obesity are the leading health problems among non-communicable diseases in the past century. According to the Non-Communicable Disease Risk Factor Collaboration, the global prevalence of obesity among adults doubled from 8·8 % in 1990 to 18·5 % in 2022 in women; and from 4·8 % to 14·0 % in men over the same period(1). The economic burden of overweight and obesity was estimated to account for 2·19 % of global gross domestic product in 2019, with projections rising to 3·29 % by 2060 if current trends continue(Reference Okunogbe, Nugent and Spencer2).
Both genetic and environmental factors are believed to be involved in the development of overweight and obesity. Among them, dramatic changes in macronutrient intake were reported to be associated with overweight and obesity and its related problems(Reference Gribbin, Enticott and Hodge3–Reference Tay, Quek and Lim5). Obesity is characterised by accumulation of body fat; at first, people worried about over-consumption of fat. However, since macronutrient (carbohydrate, fat and protein) metabolism is linked by the tricarboxylic acid cycle, over intake of any macronutrient will be converted into fat and stored by the human body, indicating that energy might be the key to solving the body weight problem. Based on NHANES (National Health and Nutrition Examination Survey), the proportion of energies derived from carbohydrate decreased by 2·02 %, and it decreased by 0·82 % for fat and 1·2 % for protein between 1999 and 2016 in American adults(Reference Shan, Rehm and Rogers6). Korean NHANES also reported that the proportion of energies from carbohydrate decreased from 65·0 % to 59·7 % in 10 years (2010 to 2020), while it increased from 15·2 % to 15·9 % for those from protein and from 19·7 % to 24·3 % for those from fat in Korean adults(Reference Chun, Kwon and Heo7). In contrast, carbohydrate and protein intake increased while fat intake decreased in Iranian adults between 2006 and 2017(Reference Aghayan, Asghari and Yuzbashian8). A review published in 2011 reported that energy from carbohydrate and fat decreased by 6 % and 7 %, respectively, between 1973 and 2004 in India(Reference Misra, Singhal and Sivakumar9). However, the prevalence of overweight and obesity continued to grow during the same period(Reference Chen, Wang and Liang10). China has also experienced a dramatic transition in diet: from a traditional dietary pattern (high intake of carbohydrate and low intake of fat and protein) to a Western dietary pattern (low intake of carbohydrate and high intake of fat and protein) since its Reform and Opening-up(Reference Wang, Wang and Zhang11,Reference Zhao, Su and Wang12) . The China Health and Nutrition Survey (CHNS) and NHANES are the nationally representative nutrition surveys in China and the USA, respectively, providing a unique opportunity to compare secular trends in macronutrient intake between populations with distinctly different dietary traditions. Hence, we aimed to evaluate secular trends in energy and macronutrient intake, and anthropometric measurements (BMI and waist circumference (WC)) over the periods of 1993–2015 (CHNS) and 1997–2016 (NHANES).
Methods
Study design and population
The CHNS is a large-scale longitudinal, international collaborative project between the Carolina Population Center at the University of North Carolina at Chapel Hill and the National Institute for Nutrition and Health (former National Institute of Nutrition and Food Safety) at the Chinese Center for Disease Control and Prevention. The data released included ten waves (1989, 1991, 1993, 1997, 2000, 2004, 2006, 2009, 2011 and 2015). Twelve provinces (Heilongjiang, Liaoning, Beijing, Shandong, Jiangsu, Shanghai, Henan, Hubei, Hunan, Guangxi, Guizhou and Chongqing) were selected in the CHNS. Details of the CHNS have been described elsewhere(Reference Wang, Wang and Zhang11,Reference Liang, Liu and Du13) . NHANES consistently gathers cross-sectional health data from a nationally representative sample of the noninstitutionalized US population. The survey used a complex, multistage probability sampling design, with data collected through in-home interviews followed by visits to a mobile examination centre. The NHANES programme began in the early 1960s, and the newest data were released in 2023. Details of NHANES can be found on the website (https://www.cdc.gov/nchs/nhanes). Both CHNS and NHANES are nationwide surveys focusing on social and economic transformation in human health. Although NHANES data were available before 1997, NHANES III (released in 1997) was selected as the starting point for the following reasons: first, NHANES III was conducted during 1988–1994; thus, it was similar to the baseline point of CHNS (started in 1993). For CHNS, the labelled years represented the actual time of data collection. For NHANES, it should be noted that the labelled years referred to the time when the data were released. Second, we sought to maximise the time range because it is helpful to achieve a reliable and stable secular trend.
Our analysis initially included 84 374 Chinese participants (aged 20–64 years) and 60 456 American participants (aged 20–64 years) with complete demographic, anthropometric and dietary recall data from a single survey year. Participants with implausible energy intake values (men: <800 kcal or >6000 kcal; women: <600 kcal or >4000 kcal) were excluded from the final analysis. These thresholds have been applied in previous CHNS- and NHANES-based studies(Reference Qi, Cao and Wang14,Reference Chen, Xu and Van Horn15) . For CHNS, 3926 participants were excluded (3619 below the lower limit and 307 above the upper limit). For NHANES, 5669 participants were excluded (4955 below the lower limit and 714 above the upper limit) (Supplemental Figure 1). After exclusion, the final analytical sample comprised 80 448 Chinese adults and 54 787 American adults.
Age-standardisation
Age-standardisation of all estimates was performed using a two-stage direct standardisation approach based on the WHO World Standard Population, which reflects the average world population age structure for the period 2000–2025. First, age-, sex- and survey year-specific means and their design-adjusted standard errors were calculated using the PROC SURVEYMEANS procedure in SAS, incorporating complex survey design features. Second, these stratum-specific estimates were combined using the WHO World Standard Population distribution as the reference to ensure comparability between the Chinese and US populations and across survey years.
Sedentary behaviour
For NHANES, data on sedentary behaviour were collected by a questionnaire, which was available from 2000. However, the method changed over time. Before 2007, sedentary behaviour was estimated by the total time spent on specific activities (e.g., watching TV). However, after 2007, it was assessed using a single standardised question on daily sitting time (variable PAD680). Given this methodological disagreement, the annual percent change trends for sedentary time (presented in Supplemental Figure 4) should be interpreted with caution. Sedentary time data for CHNS were not included because it was only available for four waves (2006, 2009, 2012 and 2015).
Dietary intake
Dietary intake at the individual level was assessed differently between the two surveys. In CHNS, trained field interviewers conducted face-to-face 24–h dietary recalls on three consecutive days (two weekdays and one weekend day), with the starting day randomly assigned from Monday through Sunday to ensure balanced coverage across the week(Reference Zhang, Zhai and Du16,Reference Zhai, Guo and Popkin17) . All household members were asked to report all foods and beverages consumed at home and away from home over the previous 24 h, using food models and pictures to assist portion size estimation. All field interviewers underwent a high-standard training course before each survey. In addition to individual dietary recalls, a household food inventory was conducted over the same 3-d period. All foods and condiments were weighed and recorded at the beginning and end of the survey, and all home-prepared and purchased foods were weighed daily. Quality control staff compared individual 24–h dietary recall with household inventory-based estimates. If significant discrepancies were found, interviewers revisited the households to verify individual consumption. In NHANES, two 24–h dietary recalls were administered using the United States Department of Agriculture Automated Multiple–Pass Method(Reference Blanton, Moshfegh and Baer18). The first recall was performed in-person in the Mobile Examination Center using three-dimensional measuring guides. The second recall was collected by telephone 3 to 10 d later. At the end of the Mobile Examination Center interview, participants were scheduled for a phone follow-up interview and were given a measuring toolkit (measuring cups, spoons, a ruler and a Food Model Booklet), which was used to increase the accuracy of dietary recall during the telephone interview. The phone follow-up interview was conducted by trained dietary interviewers using the same computer-assisted dietary interview system as the Mobile Examination Center interview. The interview included three sections: dietary recall, supplement and antacid use and post-recall questions. All participants in both surveys were asked to report all food and beverages consumed during the previous 24 h. For CHNS, energy and macronutrient intake were further calculated based on the Chinese Food Composition Table(Reference Yang19). For NHANES, energy and macronutrient intake were calculated based on the United States Department of Agriculture National Nutrient Database(20). Although CHNS and NHANES used different numbers of dietary recalls (three v. one to two), both methods were appropriate for estimating population-level means of dietary intake. Importantly, as our primary comparison focused on secular trends within each population rather than differences in absolute intake between countries, and each survey maintained consistent protocols over time, differences in recall frequency were not expected to systematically affect our trend estimates. In terms of survey timing, NHANES collected data continuously throughout the year, ensuring coverage across all seasons, while CHNS survey waves were conducted during the autumn and winter months. The consistency in survey time across waves minimised the potential influence of seasonality on the estimated secular trends within the database. We calculated total energy and energy from macronutrients, including carbohydrate, protein and fat, based on the FAO (2003) report(21). The energy from carbohydrate, protein and fat was calculated using the standard Atwater general factors: 4 kcal/g for carbohydrate and protein, and 9 kcal/g for fat(21). The proportion of energies from each macronutrient was calculated as follows: [macronutrient intake (g) × Atwater factor (kcal/g)]/total energy intake (kcal) × 100. Energies generated from dietary fibre could be dramatically affected by the ratio of soluble to insoluble fibre and magnitude of fermentation; therefore, we did not calculate energies from dietary fibre.
Anthropometric data
Body weight, height, waist and hip circumferences were measured by trained health workers according to the WHO protocols(22). Body weight was measured to the nearest 0·1 kg with the participants wearing light clothing, and height was measured to the nearest 0·1cm without shoes using a portable stadiometer. BMI was calculated by dividing the body weight (kg) by the square of height (m2) of each participant. For CHNS, WC was measured midway between the costal margin and the iliac crest at the end of a normal expiration. For NHANES, WC was measured with a measuring tape at the midaxillary line in the horizontal plane just above the highest point of the right iliac crest.
Statistical analysis
All statistical analyses were conducted using SAS version 9.4 (SAS Institute Inc., Cary, NC), and Joinpoint regression analyses were performed using the Joinpoint Regression Program (Version 5.4.0.0, National Cancer Institute, Bethesda, MD). A two-tailed P -value < 0·05 was considered statistically significant. Continuous variables were summarised as mean ± standard deviation or median (interquartile range) based on distribution normality, and categorical variables were expressed as counts (percentages).
To account for the complex sampling designs of both surveys, we employed survey analysis methods. For the CHNS, which does not provide nationally representative sampling weights, we specified the stratification variable (stratum) and the primary sampling unit (represented by ‘commid’) in the PROC SURVEYMEANS procedure to appropriately adjust for the multi-stage, stratified cluster sampling design. For NHANES, we incorporated the provided sampling weights, stratification and clustering variables to obtain nationally representative estimates.
Given differential missingness patterns between cohorts, we employed cohort-specific approaches. For NHANES (missing data: 2·3 %), complete-case analysis was used. For CHNS (missing data: 8·3 %), multiple imputation was implemented using SAS PROC MI with 20 imputations, including age, sex, education, urban/rural residence and other relevant covariates in the imputation model. Pooled estimates were obtained using Rubin’s rules in PROC MIANALYZE.
Secular trends in caloric intake, macronutrient composition, BMI and WC were assessed using sex-stratified Joinpoint regression analysis. This method models piecewise linear trends and identifies points at which the slope changes significantly (i.e., turning points). The maximum number of Joinpoint was set to three. The pooled annual estimates derived from the imputed datasets were entered into the Joinpoint Regression Program to model the trends(Reference Cook, Hurwitz and Geczik23,Reference Ahmed, Sultana and Greene24) . We calculated the annual percent change for each segment to identify short-term fluctuations and turning points, and the average annual percent change (AAPC) over the entire study period to summarise the long-term trend. All trend models were adjusted for age.
The association between daily energies, macronutrient intake and age-standardised BMI and WC was evaluated by Pearson correlation, which was stratified by sex and two cohorts.
Results
Participants’ characteristics
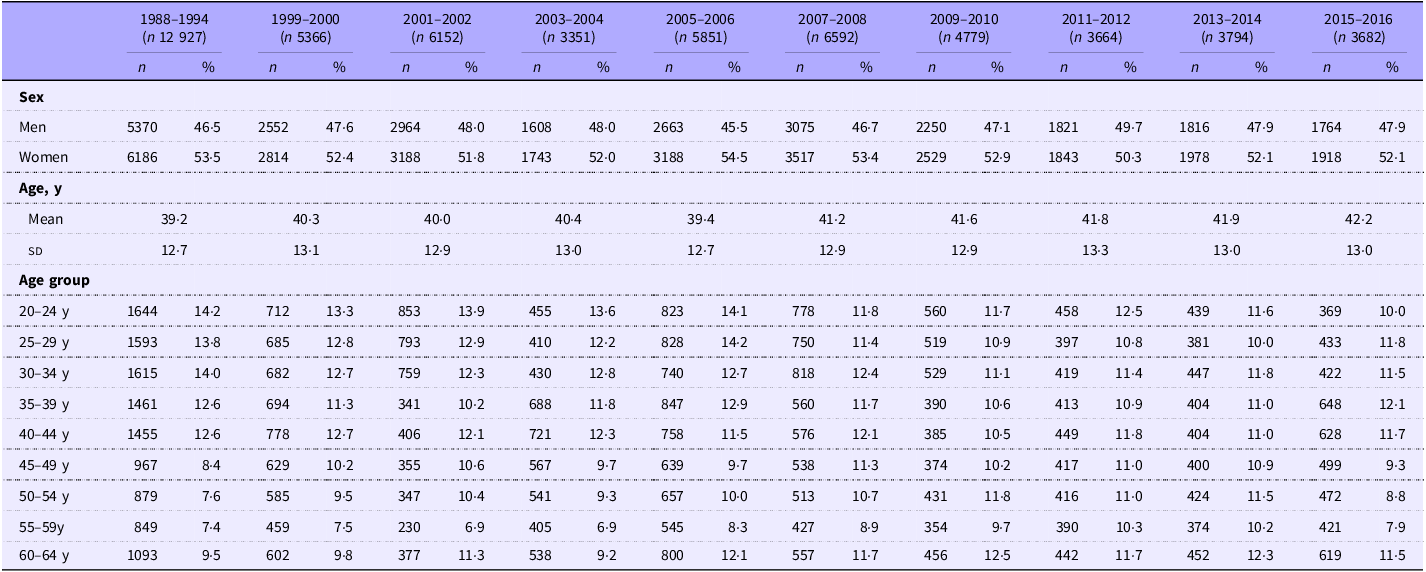
The current study included 80 448 Chinese adults (aged 20–64 years, 50·0 % men and 50·0 % women, shown in Table 1) and 54 787 American adults (aged 20–64 years, 47·2 % men and 52·8 % women, shown in Table 2).
Characteristics of participants in each survey of China Health and Nutrition Survey from 1993 to 2015

Table 1. Long description
Table 1 presents characteristics of CHNS participants in eight survey waves: 1993, 1997, 2000, 2004, 2006, 2009, 2011, and 2015. Sample sizes ranged from 9,005 to 12,223. The proportion of men increased from 49.3% in 1993 to 53.3% in 2015. Mean age increased from 39.4 years (SD 12.9) in 1993 to 46.5 years (SD 11.7) in 2015. The table also shows age-group distributions from 20–24 to 45–49 years; older age groups made up a larger share in later waves, while the 20–24 and 25–29 year groups declined.
Data are presented as number of participants (n), percentage (%) or mean (standard deviation, sd).
Data were obtained from the China Health and Nutrition Survey across eight survey waves from 1993 to 2015.
The age of participants is presented as mean (sd) and by age group distribution.
Numbers may not total 100 % due to rounding.
Characteristics of participants in each survey of American National Health and Nutrition Examination Survey from 1988 to 2016

Table 2. Long description
Table 2 presents characteristics of NHANES participants in ten survey waves from 1988–1994 to 2015–2016. Sample sizes ranged from 3,351 to 12,927. The proportion of men was approximately 46–50% and women 50–54% across waves. Mean age was around 39–42 years. The table also shows age-group distributions from 20–24 to 60–64 years; the age distribution was relatively stable across survey waves.
Data are presented as number of participants (n), percentage (%) or mean (standard deviation, sd).
Data were obtained from the US National Health and Nutrition Examination Survey across ten survey waves from 1988 to 2016.
The age of participants is presented as mean (sd) and by age group distribution.
Numbers may not total 100 % due to rounding.
Daily energy intake
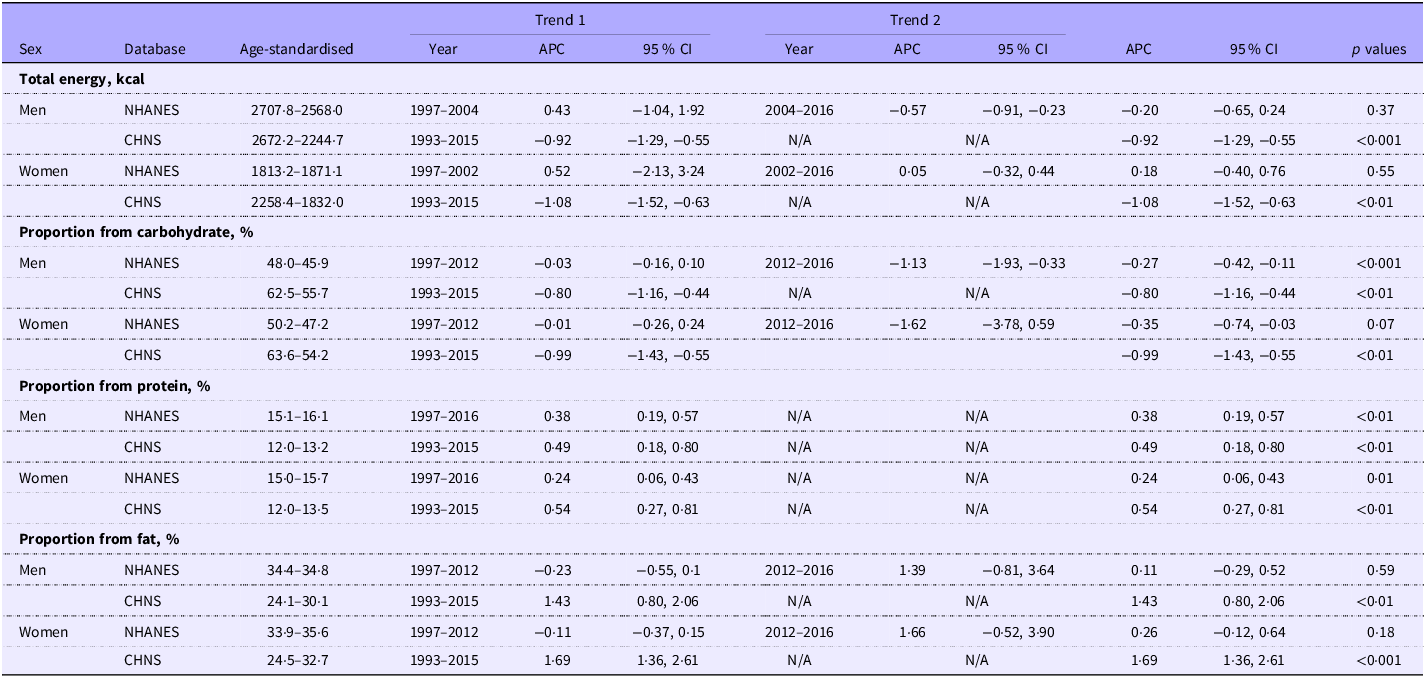
Joinpoint regression analysis revealed a significant downward trend in daily energy intake among Chinese adults from 1993 to 2015. For men, daily energy intake decreased from 2672 kcal (95 % CI: 2613 kcal, 2731 kcal) in 1993 to 2244 kcal (95 % CI: 2202 kcal, 2287 kcal) in 2015 (AAPC = −0·92 %; 95 % CI: −1·29 %, −0·55 %; P < 0·001). For women, daily energy intake also decreased from 2258 kcal (95 %CI: 2205 kcal, 2311 kcal) in 1993 to 1832 kcal (95 %CI: 1799 kcal, 1865 kcal) in 2015 (AAPC = −1·08 %; 95 % CI: −1·52 %, −0·63 %; both P < 0·001) (Supplemental Table 1, Table 3, and Figure 1). In contrast, daily energy intake remained stable among American adults between 1997 and 2016; no significant long-term trend was observed (men: AAPC = −0·20 %, 95 % CI: −0·65 %, 0·24 %; P = 0·37; women: AAPC = 0·18 %, 95 % CI: −0·40 %, 0·76 %; P = 0·55) (Supplemental Table 2, Table 3 and Figure 1).
Secular trends in total energy intake and macronutrient composition among Chinese and American adults, 1993–2015 (China) and 1988–2016 (USA). (A-D) Data from the China Health and Nutrition Survey (CHNS). (E-H) Data from the US National Health and Nutrition Examination Survey (NHANES). (A, E) Age-standardised total energy intake (kcal/day). (B, F) Age-standardised percentage of energy intake from carbohydrates. (C, G) Age-standardised percentage of energy intake from protein. (D, H) Age-standardised percentage of energy intake from fat. Colour represents CI. For NHANES, the labels referred to the release time, not the collection time. The label ‘1997’ indicated that the data were released in 1997, but the data were collected during 1988–1994. After 1997, the labels also indicated the release time, representing a two-year period of data collection (‘2000’ meant the data were collected during 1999–2000 and released in 2000). For CHNS, the label indicated the actual data collection years directly.

Energies from carbohydrate, fat and protein
Significant shifts in macronutrient composition were observed among Chinese adults. Energies derived from carbohydrate significantly decreased (men: AAPC = −0·80 %; 95 % CI: −1·16 %, −0·44 %; women: AAPC = −0·99 %; 95 % CI: −1·43 %, −0·55 %; both P < 0·01) while that from fat significantly increased (men: AAPC = 1·43 %; 95 % CI: 0·80 %, 2·06 %; women: AAPC = 1·64 %; 95 % CI: 0·84 %, 2·44 %; both P < 0·01). Energies from protein also demonstrated a significant increase (men: AAPC = 0·49 %; 95 % CI: 0·18 %, 0·80 %; women: AAPC = 0·50 %; 95 % CI: 0·27 %, 0·81 %; both P < 0·01) (Figure 1; Table 3).
Annual percentage change (APC) and average annual percentage change (AAPC) in total energy intake and the percentage of energy from macronutrient in Chinese and American adults

Table 3. Long description
Table 3 shows Joinpoint regression results for total calorie intake and percentage of calories from carbohydrate, protein, and fat in Chinese and US adults, by sex. In CHNS, total calorie intake decreased significantly in both men (AAPC -0.92%, P<0.001) and women (AAPC -1.08%, P<0.01). In NHANES, no significant long-term change was observed in men (AAPC -0.20%, P=0.37) or women (AAPC 0.18%, P=0.55). For carbohydrate percentage, CHNS men (AAPC -0.80%) and women (AAPC -0.99%) decreased significantly (both P<0.01); NHANES men also decreased (AAPC -0.27%, P<0.001), while women showed a borderline decrease (AAPC -0.35%, P=0.07). For protein percentage, both CHNS and NHANES showed significant increases in men and women (all P<0.01). For fat percentage, CHNS men (AAPC 1.43%) and women (AAPC 1.69%) increased significantly (both P<0.01), whereas NHANES showed no significant trend in men (P=0.59) or women (P=0.18).
Data are presented as APC, AAPC with 95 % CI or percent change.
For NHANES, the labels referred to the release time, not the collection time. The label ‘1997’ indicated that the data were released in 1997, but the data were collected during 1988–1994. After 1997, the labels also indicated the release time, representing a two-year period of data collection (‘2000’ meant the data were collected during 1999–2000 and released in 2000). For CHNS, the label indicated the actual data collection years directly.
APC and AAPC were derived from Joinpoint regression analysis of data from the China Health and Nutrition Survey (CHNS, 1993–2015) and the US National Health and Nutrition Examination Survey (NHANES, 1997–2016).
All estimates are age-standardised. Values in the ‘age-–standardised’ columns represent the age-standardised estimates at the start and the end of the study period for the respective dataset (NHANES: 1997–2016; CHNS: 1993–2015).
N/A, not applicable.
Between 1997 and 2016, energies from carbohydrates decreased among American adults, with a significant decrease in men (AAPC = −0·27 %; 95 % CI: −0·42 %, −0·11 %; P < 0·01) and a borderline decrease in women (AAPC − 0·35 %; 95 % CI: −0·74 %, −0·03 %; P = 0·07). Protein-derived energies increased significantly among American adults (men: AAPC = 0·38 %; 95 % CI: 0·19 %, 0·57 %; women: AAPC = 0·24 %;95 % CI: 0·06 %, 0·43 %; both P < 0·01). No significant trend in fat-derived energies was observed in either men (P = 0·59) or women (P = 0·18) (Figure 1; Table 3).
BMI and waist circumference
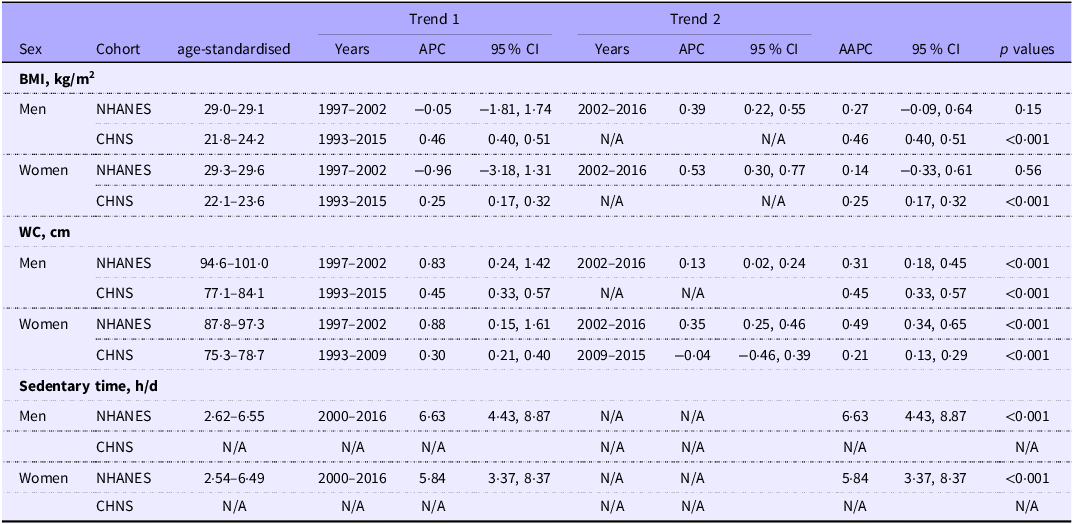
For Chinese adults, significant upward trends were observed for both BMI (men: AAPC = 0·46 %; 95 % CI: 0·40 %, 0·51 %; women: AAPC = 0·25 %; 95 % CI: 0·17 %, 0·32 %) and WC (men: AAPC = 0·45 %; 95 % CI: 0·33 %, 0·57 %; women: AAPC = 0·21 %; 95 % CI: 0·13 %, 0·29 %) (all P < 0·001) (Figure 2; Table 4). Pearson correlation showed that daily energy was negatively associated with age-standardised BMI and WC. Carbohydrate intake was negatively associated, while protein and fat intake were positively associated with age-standardised BMI and WC (Supplemental Figure 2).
Secular trends in BMI and waist circumference among Chinese and American adults, 1993–2015 (China) and 1988–2016 (USA). (A, C) Age-standardised BMI (kg/m2). (B, D) Age-standardised waist circumference (cm). Colour represents CI.
Data sources: (A, B) China Health and Nutrition Survey (CHNS). (C, D) US National Health and Nutrition Examination Survey (NHANES).
For NHANES, the labels referred to the release time, not the collection time. The label ‘1997’ indicated that the data were released in 1997, but the data were collected during 1988–1994. After 1997, the labels also indicated the release time, representing a two-year period of data collection (‘2000’ meant the data were collected during 1999–2000 and released in 2000). For CHNS, the label indicated the actual data collection years directly.

Trends in adult BMI and waist circumference (WC) with annual percentage change (APC) in the United States and China, 1997–2016: a comparison of NHANES and CHNS data

Table 4. Long description
Table 4 shows age-standardized trends in BMI and waist circumference in Chinese and US adults, by sex. For BMI in men, NHANES showed no significant overall trend (AAPC 0.27%, P=0.15), but a significant increase from 2002 to 2016 (APC 0.39%); CHNS men increased significantly (AAPC 0.46%, P<0.001). For BMI in women, NHANES increased significantly after 2002 (APC 0.53%); CHNS women increased significantly (AAPC 0.25%, P<0.001). For waist circumference, NHANES men (AAPC 0.31%), NHANES women (AAPC 0.49%), and CHNS men (AAPC 0.45%) all increased significantly (all P<0.001). The table also lists start and end age-standardized values and segmented APC estimates.
Data are presented as APC, average annual percent change (AAPC) with 95 % CI.
For NHANES, the labels referred to the release time, not the collecting time. The label ‘1997’ indicated that the data were released in 1997, but the data were collected during 1988–1994. After 1997, the labels also indicated the release time, representing a two-year period of data collection (‘2000’ meant the data were collected during 1999–2000 and released in 2000). For CHNS, the label indicated the actual data collection years directly.
APC and AAPC were derived from Joinpoint regression analysis of data from the China Health and Nutrition Survey (CHNS, 1993–2015) and the US National Health and Nutrition Examination Survey (NHANES, 1997–2016).
All estimates are age-standardised.
N/A, not applicable.
Analysis of American adults revealed more complex trends. Although no significant long-term trend in BMI was observed between 1997 and 2016 (men: AAPC = 0·27 %, P = 0·15; women: AAPC = 0·14 %, P = 0·56), segmented analysis showed a significant increase in BMI during the period from 2002 to 2016 (men: annual percent change = 0·39 %; 95 % CI: 0·22 %, 0·55 %; women: annual percent change = 0·53 %; 95 % CI: 0·30 %, 0·77 %; both P < 0·001). By comparison, WC showed significant upward trends among American adults over the entire study period (men: AAPC = 0·31 %; 95 % CI: 0·18 %, 0·45 %; women: AAPC = 0·49 %; 95 % CI: 0·34 %, 0·65 %; both P < 0·001). (Figure 2; Table 4). Additionally, daily energy intake was significantly associated with age-standardised WC in American women (r 0·69; P = 0·03), whereas no significant association was observed with age-standardised BMI in both men and women (Supplemental Figure 3).
Discussion
In this comparative study between CHNS and NHANES, we observed that despite a reduced or stable total energy intake, body weight continued to increase in both Chinese and American adult populations, as indicated by BMI and WC. These findings suggested that total energy intake alone was not the only determinant of the obesity epidemic.
The nutritional transition observed in both countries, characterised by a significant decrease in carbohydrate-derived energies and a concurrent increase in fat-derived energies, played a critical role in the increase in body weight. The decreased carbohydrate and increased fat and protein intake in China could represent a major shift from the traditional Chinese dietary pattern (characterised by high intake of cereals, predominantly refined rice and wheat flour and vegetables while low intake of animal products) to a Western pattern (high intake of animal fat and protein, refined sugar and processed food while low intake of vegetables and fibre)(Reference Huang, Wang and Wang25,Reference Zhai, Du and Wang26) . Among American adults, carbohydrate intake further decreased while fat intake increased, potentially associated with increased consumption of fried and fast foods.
Despite a decline in daily energy intake, BMI and WC increased substantially among Chinese adults, suggesting that changes in macronutrient composition, particularly the sustained annual increase in fat-derived energy, may have contributed to these trends. This upward trajectory is consistent with other national reports(Reference Wang, Zhou and Zhao27) and highlights the importance of dietary guidelines to consider not only total energy restriction but also macronutrient quality and distribution.
Comparative analysis against national dietary guidelines revealed a critical public health issue in both countries: excessive fat intake. According to the US Dietary Guidelines, the Acceptable Macronutrient Distribution Range for fat is 20–35 % of total energies for adults(28). Our analysis of NHANES data showed that average fat intake in American adults had already surpassed this upper limit. A similar situation was also observed in China, where fat intake exceeded the recommendation by the Chinese Dietary Guidelines 2022 (20–30 % of total energy)(29). Excessive fat intake in both countries may be a potential driving factor for the observed increases in BMI and WC.
The mechanisms by which high-fat diets promote adiposity were multifaceted. High-fat diets might lead to weight gain through low diet-induced thermogenesis and preferential fat storage efficiency(Reference Hariri and Thibault30,Reference de la Garza, Milagro and Boque31) . Another potential mechanism involved gut dysbiosis induced by an imbalanced diet, which triggered early pathophysiological changes that promoted systemic inflammation and insulin resistance(Reference Araújo, Tomas and Brenner32). Given the historically low baseline fat intake in China, the rapid increase in consumption of animal fats and cooking oil may have exceeded the capacity of metabolic adaptation(Reference Zhai, Du and Wang26). Furthermore, reduced physical activity due to urbanisation and poor dietary quality characterised by high consumption of energy-dense foods may have exacerbated the risk of obesity(Reference Zhai, Du and Wang26,Reference Wang, Zhai and Wang33) .
The discordance between energy intake and obesity trends challenged the ‘calories in-calories out’ paradigm(Reference Howell and Kones34), implicating the roles of poor dietary quality and reduced energy expenditure. First, low-quality carbohydrates (refined grains, fruit juice and added sugars) dominated American diets, constituting 41·8 % of energy intake, consistent with previous NHANES-based analyses of secular trends in carbohydrate quality(Reference Shan, Rehm and Rogers6). Second, unprocessed and processed red meat was associated with the risk of obesity and its related chronic diseases such as cardiovascular disease and diabetes(Reference Shi, Huang and Schooling35,Reference Rouhani, Salehi-Abargouei and Surkan36) ; national surveys have shown that burgers, meat mixed dishes and cold cuts were major sources for processed red meat intake in US diets(Reference Lau, Fulgoni and Van Elswyk37,Reference Frank, Taillie and Jaacks38) . Third, saturated fatty acids elevated the risk of obesity through multiple mechanisms, including reduced satiety, impaired insulin sensitivity, systemic inflammation and gut microbiota dysbiosis(Reference Ahmed, Sultana and Greene24,Reference Hariri and Thibault30) . These dietary changes were consistent with the broader nutrition transition observed in both countries, which in China has been characterised by decreased consumption of cereals and vegetables along with increased intake of animal-source foods(Reference Huang, Wang and Wang25,Reference Tian and Lin39) . Fourth, sedentary occupations and modernised transportation reduced energy expenditure(Reference Guthold, Stevens and Riley40). Data from NHANES showed that sedentary time significantly increased between 2000 and 2016 (from 2·62 h per day to 6·55 h per day in men; from 2·54 h per day to 6·49 h per day in women; details in Supplemental Table 3 and Supplemental Figure 4).
Analysis of the USA data revealed distinct trends across anthropometric measures. While BMI showed no significant long-term trend from 1997 to 2016, segmented analysis identified 2002 as a significant turning point. After the turning point, BMI increased consistently and significantly in both sexes. However, WC exhibited a significant and steady upward trend among American adults throughout the entire study period. This divergence suggested that WC may serve as a more sensitive indicator of changes in central adiposity over time, especially when overall BMI trends remained stable(Reference Ross, Neeland and Yamashita41). The significant increases in both BMI (after 2002) and in WC in the USA paralleled the sustained upward trends observed in the CHNS data.
The current study had several notable strengths. First, data from two nationally representative, large-scale databases enabled a cross-national comparative analysis over two decades, providing a unique perspective on observing obesity trends across different dietary cultures. Second, the application of Joinpoint regression analysis enabled the identification of significant turning points in trends, providing a more detailed understanding of the dynamics of the obesity epidemic. However, several limitations had to be acknowledged. First, the cross-sectional design of the data limited our ability to establish causal relationships. Second, differences in assessment methods across survey waves may have introduced bias, although the consistent protocols within each survey supported the validity of within-population trend estimates. For example, CHNS and NHANES used different numbers of dietary recalls (three v. one to two) and specific protocols for WC measurement, which may be inappropriate for comparing absolute values across cohorts. Both methods were commonly used and validated. Importantly, our primary aim was to evaluate long-term trends within each population rather than to compare absolute dietary intake between two cohorts; therefore, differences in dietary recall protocols were not expected to affect the main analyses. Third, although we adjusted for age, other potential confounding factors, such as physical activity and socioeconomic status, were not fully taken into consideration. Self-reported dietary recalls were also subject to recall bias and potential underreporting. Fourth, seasonality may have affected the evaluation of both total energy and macronutrient intake(Reference Zhu, Wu and Luo42), as NHANES collected data continuously throughout the year, while CHNS surveys were conducted during autumn and winter. However, because survey timing was generally consistent across waves in each survey, the influence of seasonality on the long-term trends was likely limited. Fifth, the absence of official sampling weights for the CHNS may have limited the generalizability of absolute prevalence estimates among the Chinese population, but it was less likely to affect the validity of within-population long-term trend comparisons. Furthermore, restricting the study population to adults aged 20–64 years limited generalizability of our findings to adolescent and elderly populations. However, this age range is broadly consistent with adult age categories used in international anthropometric and nutritional surveillance, including the WHO framework. Finally, although dietary assessment methods were consistent within each survey, potential methodological changes over the study period could not be fully accounted for.
Conclusion
Obesity remains a major public health challenge in both China and the USA. Despite different dietary patterns, adults in both countries show increasing trends in BMI and WC. These findings suggest that obesity prevention should consider factors beyond restricting total energy intake or limiting a single macronutrient. Comprehensive approaches should incorporate both macronutrient composition and overall dietary quality, together with lifestyle factors such as sedentary behaviour, eating patterns, sleep and psychological health. Effective obesity prevention strategies should integrate improvements in diet and physical activity with efforts to reduce broader social and environmental risk factors.
Supplementary material
For supplementary material/s referred to in this article, please visit https://doi.org/10.1017/S0007114526108782
Data availability statement
The analytic code and data coding schemes for this study can be shared with other researchers for replication purposes. If necessary, please contact the corresponding author (Renying Xu, email address: 721001735@shsmu.edu.cn).
Acknowledgments
Thanks to everybody involved in the design, investigation and data curation of the CHNS and NHANES studies.
Author contributions
Conceptualisation: H.L., Y.J. and R.X.; Methodology, Investigation, Visualisation, Formal analysis and Writing original draft: H.L. and Y.J.; Supervision of data analysis: P.S. and C.S.; Supervision and Writing-review & editing: R.X.
Financial support
This research received no specific grant from any funding agency, commercial or not-for-profit sectors.
Competing interests
The authors declare no conflict of interest.
Human ethics and consent to participate declarations
This study was conducted according to the guidelines laid down in the Declaration of Helsinki. All participants provided written informed consent. The CHNS study protocol was approved by the institutional review boards of the University of North Carolina at Chapel Hill and the National Institute for Nutrition and Health, Chinese Center for Disease Control and Prevention (Approval No. 2015017). Ethical oversight for the NHANES was granted by the research ethics review board of the National Center for Health Statistics (NCHS), Centers for Disease Control and Prevention.