

1. Introduction
Culture has been defined as ‘the ideas and thoughts, common to several individuals, which govern the interactions between them’ (Greif, Reference Greif1994: 915). Tabellini (Reference Tabellini2008: 259) is more specific when he defines culture as those ‘social conventions and individual beliefs that sustain Nash equilibria as focal points in repeated social interactions or when there are multiple equilibria’. Consistent with this view, North (Reference North1990) explains that culture includes informal constraints in the form of sanctions, taboos, customs, traditions, and codes of conduct. Finally, Alesina and Giuliano (Reference Alesina and Giuliano2013) indicate that culture encompasses the concept of social capital which has been famously expressed as ‘features of social organization, such as trust, norms, and networks, that can improve the efficiency of society by facilitating coordinated action’ (Putnam et al., Reference Putnam, Leonardi and Nanetti1993: 167).
A growing body of work in economics and political science has argued that culture is an important determinant of economic development and good government. Based on cross-section empirical work Knack and Keefer (Reference Knack and Keefer1997), Zak and Knack (Reference Zak and Knack2001), Williamson (Reference Williamson2009), and Tabellini (Reference Tabellini2010) among others, report a robust relationship between specific cultural traits and economic prosperity. Moreover, numerous scholars, including Putnam et al. (Reference Putnam, Leonardi and Nanetti1993), La Porta et al. (Reference La Porta, Lopez-de-Silanes, Shleifer and Vishny1997), Knack (Reference Knack2002), Licht et al. (Reference Licht, Goldsmith and Schwartz2007), Tabellini (Reference Tabellini2008), and Williamson and Kerekes (Reference Williamson and Kerekes2011) relate culture to a range of governance indicators which capture the extent to which the state protects property rights, respects the rule of law, is an efficient regulator and provider of public goods, or is free from corruption.
The importance of culture in the guise of informal constraints has also been brought to light by historical and country case studies. Informal constraints were important for the emergence of trade and financial activities between distant Maghribis communities in the Mediterranean during medieval times (Greif, Reference Greif2006), and they contributed towards the successful management of open fields in pre-industrial England (Allen, Reference Allen, Aoki and Hayami2001). In many African countries, a vast amount of daily business is based on social norms or conventions given the huge cost of formalizing contracts (Fafchamps, Reference Fafchamps2004). A sizeable literature in the field of environmental economics reports that the tragedy of the commons can be mitigated in small communities through the enforcement of informal constraints and sanctions (Ellickson, Reference Ellickson1991; Ostrom, Reference Ostrom1990). And of course, Douglass North (Reference North1991: 97) has argued that institutions – both informal constraints and formal rules – ‘provide the incentive structure of an economy; as that structure evolves, it shapes the direction of economic change towards growth, stagnation, or decline’.Footnote 1
In this article we will show that inter-personal income inequalities reduce the prevalence of cultural traits conducive towards both better institutions and development. Our contribution is related to previous work which has identified a negative relationship between income inequality and generalized trust (Bjørnskov Reference Bjørnskov2006; Rothstein and Uslaner Reference Rothstein and Uslaner2005; Uslaner, Reference Uslaner2002). We go beyond these contributions by considering the impact of inequality on an index of culture which, in addition to generalized trust, includes three values or norms which previous empirical work has related to economic development and good governance, namely, respect for others, a sense of control over one's life prospects, and the cultural trait of obedience. To deal with reverse causality, or the possibility that culture may perpetuate income inequalities, we instrument the latter by way of a country's fraction of land in the tropics, an instrument that we justify both conceptually and statistically. To isolate the effect of inequality, we control for a myriad of potentially confounding variables, capturing the effect of geography, history, social heterogeneity, religion, and contemporary economic, demographic, and political factors.
The article is structured as follows. Section 2 reviews those cultural traits which have been identified as important determinants of development and governance and relates them to income inequality. Section 3 presents our culture and inequality indicators as well as our empirical strategy. Section 4 reports our results and Section 5 concludes the article.
2. Culture and inequality
In empirically considering the relationship between culture and inequality, we draw from the work of Guido Tabellini who, in two contributions, considers the impact of a set of cultural traits on the quality of government in a cross-section of countries (Tabellini, Reference Tabellini2008) and on the economic development of Europe's regions (Tabellini, Reference Tabellini2010).
In particular, this author identifies four different cultural traits which are explored by the World Values Survey (WVS; 2009), namely: Trust, Respect, Control, and Obedience. Trust, refers to generalized trust and is constructed by taking the percentage of affirmative answers given to the question: ‘Generally speaking, would you say that most people can be trusted or that you can't be too careful in dealing with people’? Insofar, as Control is concerned it is measured as the percentage of people who give a high scale to the question: ‘Some people feel they have completely free choice and control over their lives, and other people feel that what they do has no real effect on what happens to them. Please use this scale where 1 means “none at all” and 10 means “a great deal” to indicate how much freedom of choice and control you feel you have over the way your life turns out’? Finally, the items Respect and Obedience emerge from the following question posed in the WVS: ‘Here is a list of qualities which children can be encouraged to learn at home. Which, if any, do you consider to be especially important’? The possible answers include Tolerance and Respect for other people as well as Obedience.
Tabellini (Reference Tabellini2008) suggests that Trust and Respect should be associated with better governance while Tabellini (Reference Tabellini2010) argues that these two cultural traits, together with Control, should make a positive contribution towards economic development. The effect of Obedience on the other hand, is expected to be negative. Trust reduces transaction costs in anonymous settings and thus facilitates cooperation in both the private and public sectors while respect for others means that both citizens and public officials are more likely to respect the rule of law and less likely to free-ride vis-à-vis collective action. People with a sense of control tend to believe that one's life's prospects are related to effort rather than chance and as such are more likely to be more enterprising. They are also more likely to be politically engaged (Littvay et al., Reference Littvay, Weith and Dawses2011). Alternatively, Obedience implies that civic behavior will only emerge in the presence of state coercion.
We suggest that culture, as measured by this index, is likely to be negatively associated with inter-personal income inequalities. People tend to be more trustful of people who are more similar to them and increasing income inequality implies increasing social heterogeneity to the detriment of generalized trust (Uslaner, Reference Uslaner2002). Moreover, it has been argued that generalized trust, respect for others, and individualism are likely to be less prevalent in hierarchical societies characterized by unequal agents in asymmetrical relationships (Platteau, Reference Platteau2000; Putnam et al., Reference Putnam, Leonardi and Nanetti1993; Tabellini, Reference Tabellini2010). Rather, in such societies, trust and respect are most likely to be afforded to small circles of relatives while parents will tend to inculcate obedience in their children because they perceive individualism to be harmful (see also, Banfield, Reference Banfield1958). Moreover, we would argue that in unequal societies, individuals are more likely to associate outcomes in the private and public spheres to one's social position or chance. All in all then, those cultural traits which have been identified as beneficial for economic development and good government may be weakened by economic inequalities. The rest of this article will be devoted towards testing this proposition.
3. Data and empirical strategy
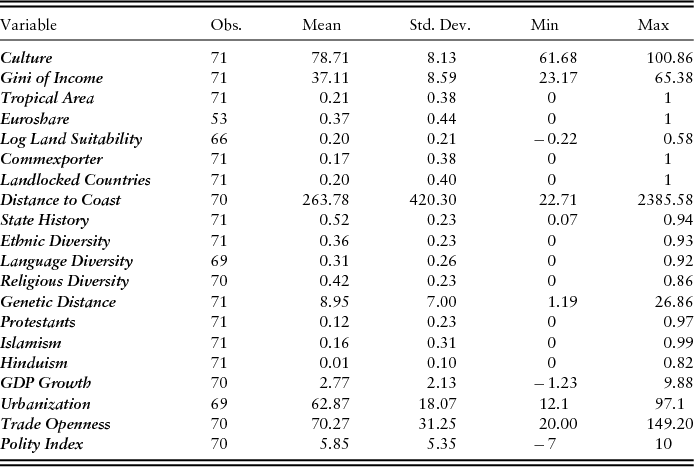
Our measure of culture is an aggregate indicator of responses to the Trust, Control, Respect, and Obedience questions posed in four waves of the WVS over the period 1990–2005. We aggregate individual responses to these questions to the national level. Moreover, because Trust, Control, and Respect are expected to promote economic development and good government while Obedience may have a harmful effect, we sum up the scores of the first three cultural traits and subtract the score of the last one (trust + control + respect – obedience). The resultant measure is highly correlated with the first principle component (FPC) extracted from these same traits but, unlike the FPC measure, it does not impose the same correlation structure in all countries (see Tabellini, Reference Tabellini2010, especially footnotes 4 and 5). In a sample of 71 countries the index ranges from 61.68 points attributed to Uganda to 100.86 points corresponding to Sweden (see Table 1 for descriptive statistics and the Appendix for the full list of variables and countries). Footnote 2
Descriptive statistics of relevant variables

Note: The Appendix describes in detail all the data and their sources. Obs. = observation; Std. Dev. = standard deviation; Min = minimum; Max = maximum; GDP = gross domestic product.
The data on income inequality come from the World Income Inequality Database (WIID) elaborated by UNU-WIDER in 2005. We average the Ginis of income inequality for each country, covering a 60-year period, from 1944 to 2003. Averaging minimizes the undesirable effects caused by the methodological changes experienced by the WIID data over time (see Li et al., Reference Li, Squire and Zou1998, for flaws of the current databases on income inequality). The Gini of Income was constructed with 982 Ginis for a maximum sample of 71 countries; it has a large variability across countries but a small standard deviation over time. We also constructed a second measure of income inequality, Middle Income Share, which covers the same period, but consists of the average share of income accrued by those people belonging to the 3rd and up to the 8th deciles of a country's income distribution.Footnote 3 The criteria followed to construct both measures are the following: income Ginis and deciles of income are preferred over expenditure Ginis, net income over gross income estimates, and household income over personal income. All income deciles and Ginis come from national surveys. Contrary to the suggestion of Li et al. (Reference Li, Squire and Zou1998), we do not correct for the potential underestimation of expenditure Ginis in order to use less favored data in our regressions in the pursuit of robustness. Zimbabwe has the highest Gini in the sample (65.38) while the lowest corresponds to the Czech Republic (23.17).
We propose to estimate the following model:
 \begin{equation}
{\rm Culture}_i = \alpha + \beta X + \delta {\rm ineq}_i + \varepsilon _i,\end{equation}
where Culturei is the index of culture in country i, X is a vector of control variables not correlated with the disturbance εi, while ineqi is proxied by Gini of Income. Estimating this model by way of Ordinary Least Squares (OLS) may yield a δ which is downward biased for two reasons. First, to the extent that our inequality indicator is plagued by measurement error this will tend to introduce attenuation bias in OLS estimates. Second, the causal relationship between Gini of Income and Culture may be a two-way one with the expectation that a lower prevalence of the cultural traits we focus on in this article – generally descriptive of less hierarchical societies characterized by more symmetric relationships – may also be conducive towards lower income inequalities. To address these issues, the second equation to be estimated in the context of Two Stage Least Squares (TSLS) will be
 \begin{equation}
{\rm ineq}_i = \mu + \pi X + \gamma {\rm Tropical}\,{\rm Area}_i + u_i,\end{equation}
where X is a vector of control variables, Tropical Areai is the share of country i's cultivated land area in the tropics, and ui is the error term. Tropical Area captures the role of both resource endowments and the disease environment in shaping the current patterns of income inequality. It is inspired by Engerman and Sokoloff's (Reference Engerman, Sokoloff and Haber1997, Reference Engerman and Sokoloff2002) insight that a tropical climate together with high native population densities led to plantation economies in South America and, consequently, a dominant class which shaped institutions to protect its privileges and prevent the access of the broad mass of the population to a wide array of civil rights and public goods. The use of Tropical Area as an instrument also draws from Acemoglu et al. (Reference Acemoglu, Johnson and Robinson2001, Reference Acemoglu, Johnson and Robinson2002) who have argued that in those European colonies with abundant indigenous labor and where tropical diseases were inimical to mass European settlement, European colonists set up extractive institutions promoting their interests to the detriment of the indigenous majorities – institutions which have persisted overtime, thus perpetuating income inequalities.Footnote 4
Several questions emerge with regard to the appropriateness of Tropical Area as an instrument. First, Tropical Area should be correlated with our chosen measure of income inequality. The empirical results reported in Section 4 below confirm this correlation since the F-statistics from the first-stage regressions of Gini of Income on Tropical Area and all our control variables is typically well above 10 (the critical value recommended by Staiger and Stock, Reference Staiger and Stock1997).
Second, we consider the persistence of income inequality over time. Most empirical work on the evolution of income inequality in the 19th century finds that economic inequality within modern countries is consistently stable (for example, Bourguignon and Morrison, Reference Bourguignon and Morrison2002; Lindert, Reference Lindert, Atkinson and Bourguignon2000). Furthermore, the inter-generational transmission of inequality appears to be a phenomenon common to both rich and poor societies (see Piketty, Reference Piketty, Atkinson and Bourguignon2000). For additional evidence of the link between Tropical Area and current income inequality, we consider the correlation between the percentage of land in the tropics and inequality in the late 19th and early 20th centuries and also the link between the latter and current inequality. Specifically, we consider the inter-temporal correlation between Tropical Area and past income inequality, by regressing data on the share of agricultural land occupied by family farms between 1858 and 1928 – a measure of inequality during this period – on Tropical Area (see also Easterly, Reference Easterly2007). The result is, as expected, a robust negative relationship between these variables. To test the link between past and current inequality, we, moreover, regress the share of land occupied by family farms in the past on Gini of Income. Our estimates confirm a strong positive correlation between contemporary inequality and that experienced in the past.Footnote 5
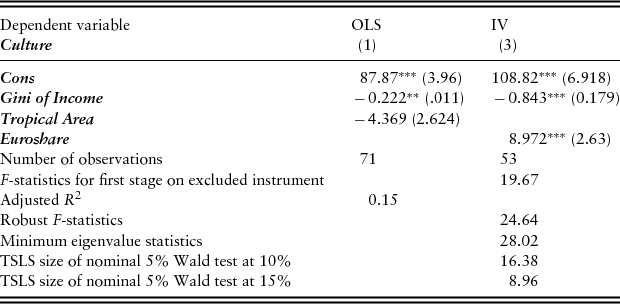
Another concern is the need to account for the possibility that Tropical Area may affect culture through other channels distinct from inequality (the exclusion restriction). As a basic check, in column 1 of Table 2 we show that Tropical Area is not an independent determinant of culture.Footnote 6 Next, we consider other channels – beyond inequality – through which Tropical Area could affect cultural traits. In particular we focus on the variable Euroshare which measures the fraction of the population speaking a European language. Since European colonists took with them both their human and social capital (Easterly and Levine, Reference Easterly and Levine2012; Glaeser et al., Reference Glaeser, La Porta, Lopez-de-Silanes and Shleifer2004; Hall and Jones, Reference Hall and Jones1999), mass European settlement would obviously have an important impact on a country's culture. Conversely, insofar, as tropical climate implied a disease environment which was inimical to mass European settlement, this may be indicative of the survival of pre-colonial culture traits. As can be seen in column 2 of Table 2, accounting for this variable does not invalidate our instrument: the F-statistics from the first stage is well above 10 and the robust F-statistics and eigenvalues are above the critical values of the Wald test at 10%.
The impact of inequality on culture: the exclusion restriction
Notes: Robust standard errors in parenthesis. ***, **, and * mean significant at 1%, 5%, and 10% respectively. Details of the variables are given in the Appendix. In the IV regression, inequality is instrumented by Tropical Area. OLS = Ordinary Least Squares; IV = instrumental variable; TSLS = Two Stage Least Squares.
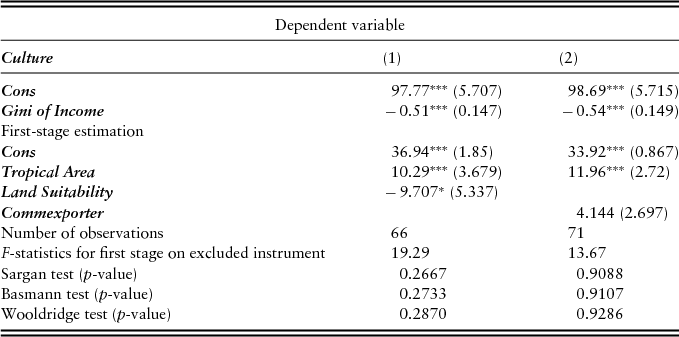
Finally, we also investigate the validity of our instrument by way of over-identification tests. We should recall that these tests presume that a proposed instrument is truly exogenous when testing for the exogeneity of alternative instruments. We run the test using two alternative instruments for inequality proposed by Easterly (Reference Easterly2007): Land Suitability, which represents the land suitable for growing wheat relative to sugarcane and thus could proxy for location in the tropics; and Commexporter, a dummy variable identifying those countries whose main exports are commodities and which, as a result, may be plagued by a ‘resource curse’, implying, in turn, the enrichment of political powerful and corrupt elites. The results of the over-identification tests are reported in Table 3. Overall, the p-values from the Sargan, Basman, and Wooldridge tests do not allow us to reject the null hypothesis of exogeneity in our instrument.
Over-identification tests
Notes: Robust standard errors in parenthesis. ***, **, and * mean significant at 1%, 5%, and 10% respectively. Wooldridge test is robust to heteroskedasticity. Details of the variables are given in the Appendix. All regressions employ Two Stage Least Squares (TSLS). Inequality is instrumented by Tropical Area.
4. Empirical results
We now proceed to test the robustness of our hypothesis that higher income inequality may be inimical to the presence of a culture conducive towards economic development and better governance. Five sets of control variables have been assembled: variables which account for possible regional specific effects; ones which control for an independent role of geography in shaping culture; variables that proxy for potentially confounding historical episodes; a group of variables which control for other dimensions of social heterogeneity; a set of variables which accounts for the influence of religion on culture; and a set which controls for the confounding influence of contemporary demographic, economic, and political factors.
It is important to clarify that we mostly calibrate the impact of inequality on culture while controlling for each of these groups of variables separately, due to the tendency of TSLS standard errors to grow excessively when too many exogenous regressors are correlated (Wooldridge, Reference Wooldridge2002). This procedure minimizes the negative effects of multicollinearity when a large sample is not at hand. Although for brevity we report the regressions based on instrumental variables, it is worth noting that the estimated impact of inequality when using TSLS is always higher than that which emerges from OLS estimates, something which is consistent with the presence of both a degree of measurement error in our key inequality indicator and reverse causality.
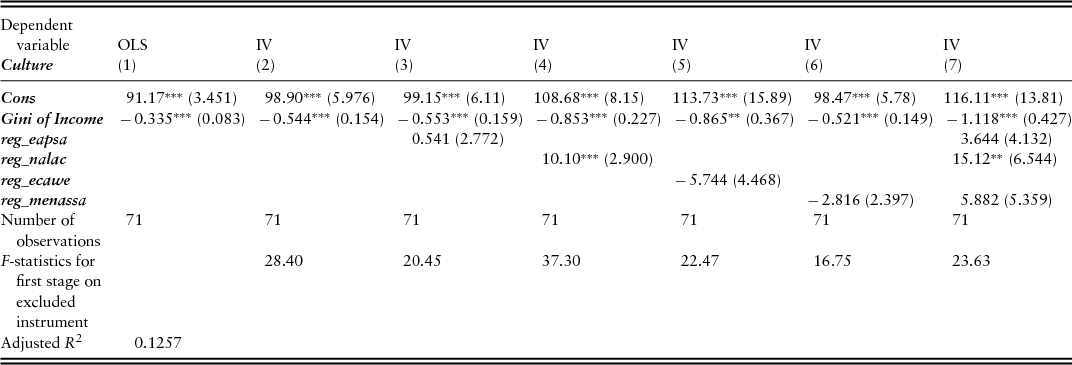
Table 4 reports the estimates of the impact of inequality on culture when allowing for the possibility that the results are driven by regional-specific factors. In particular we control for four regions namely, Europe and Central Asia, East Asia and the South Pacific, the Americas and, finally, the Middle East and Africa. The estimates reveal that Gini of Income continues to be negatively and statistically significantly associated with our indicator of culture.
The impact of inequality on culture: controlling for regional-specific effects
Notes: Robust standard errors in parenthesis. ***, **, and * mean significant at 1%, 5%, and 10% respectively. Details of variables are given in the Appendix. Regional dummies are based on the World Bank's regional classification: reg_eapsa for countries in East Asia and the South Pacific; reg_nalac for countries in North America and Latin America; reg_ecawe for countries in Europe and Central Asia; and reg_menassa for countries in the Middle East and Africa.
Regressions 2 to 7 employ Two Stage Least Squares (TSLS) and use Tropical Area as an instrument of inequality.
OLS = Ordinary Least Squares; IV = instrumental variable.
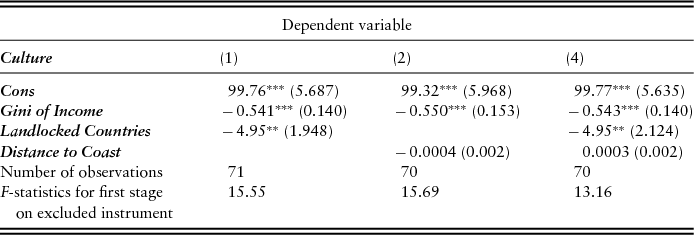
The results reported in Table 5 control for geographical variables. We include two variables, Landlocked Countries and Distance to Coast which some authors have related to the emergence of specific cultural traits (Ashraf et al., Reference Ashraf, Özak and Galor2010; Berkowitz and Clay, Reference Berkowitz and Clay2012; Durante, Reference Durante2010; Fenske, Reference Fenske2010). The results suggest that being a landlocked state is negatively associated with the cultural traits that we deal with in this article. The inclusion of these geographic variables does not alter the estimated impact or statistical significance of our measure of income inequality.
The impact of inequality on culture: controlling for geographic variables
Notes: Robust standard errors in parenthesis. ***, **, and * mean significant at 1%, 5%, and 10% respectively. Details of the variables are given in the Appendix. All regressions employ Two Stage Least Squares (TSLS). Inequality is instrumented by Tropical Area.
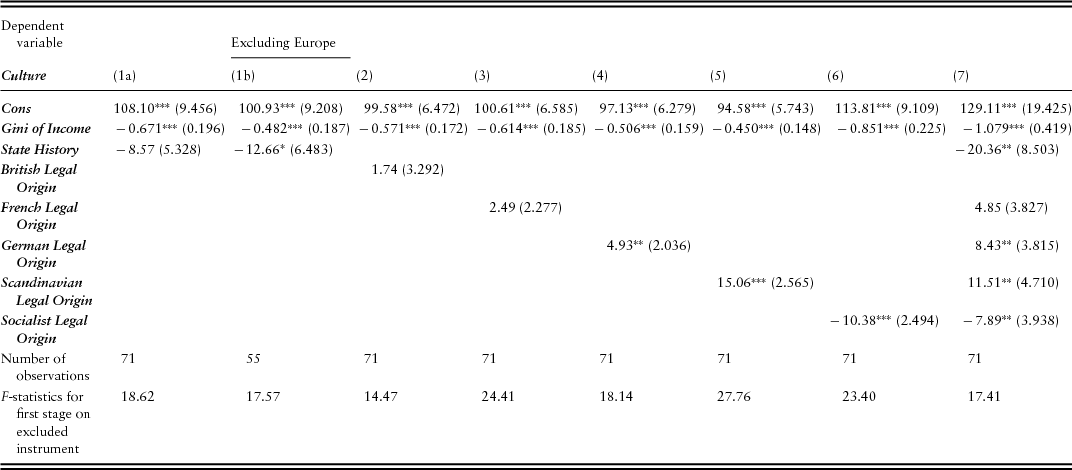
In Table 6, we consider variables proxying for the impact of historical episodes on culture. Leeson (Reference Leeson2005) has speculated about whether British or French-imposed colonial institutions could have affected those social signals that previously facilitated social exchange between ethnic groups in Africa. Eggertsson (Reference Eggertsson2005) has elaborated a fascinating account of the economic and social conflicts created in 19th century Iceland by the forceful legal transplantation imposed by Danish rule. Relatedly, La Porta et al. (Reference La Porta, Lopez-de-Silanes and Shleifer2008) argue that legal systems embody the beliefs and ideologies of those instituting them and how, once established, they transmit these values inter-generationally. Nunn (Reference Nunn2011) has explained how the transatlantic and Indian Ocean slave trade laid the seeds of mistrust across Africa. Hariri (Reference Hariri2012) explains how countries with stronger pre-colonial centralized states, either resisted colonization or were ruled by colonial powers through existing institutions. In both situations this implied their maintenance on traditional forms of authority, namely autocracy – an inherently hierarchical political system. Finally, it has been argued that the transition from a planned economy to a market-based one may have caused major social disarray because it required rapid changes in relatively stable or slow moving individual cognitive frameworks (Mcmillan Reference McMillan2002; Pejovich Reference Pejovich2003).
The impact of inequality on culture: controlling for historical variables
Notes: Robust standard errors in parenthesis. ***, **, and * mean significant at 1%, 5%, and 10% respectively. Details of the variables are given in the Appendix. All regressions employ Two Stage Least Squares (TSLS). Inequality is instrumented by Tropical Area.
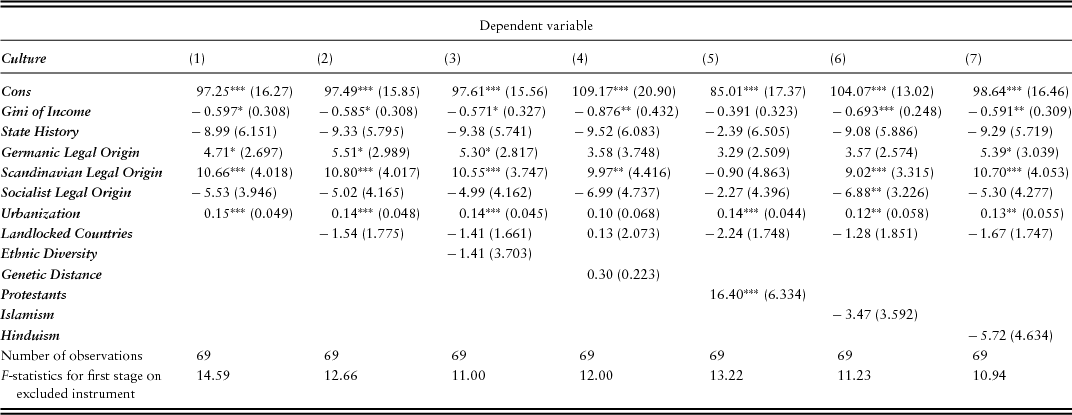
To control for the potentially confounding influence of pre-colonial states we follow Hariri (Reference Hariri2012) and employ the variable State History, an index first introduced by Bockstette et al. (Reference Bockstette, Chanda and Putterman2002), which captures the existence of a centralized state between 1 and 1950 CE. To deal with the impact of colonialism and legal systems we employ a set of variables reflecting differences in the legal traditions across countries. In particular we control for the full set of legal traditions proposed by La Porta et al. (Reference La Porta, Lopez-de-Silanes and Shleifer2008): British common law, French, German and Scandinavian law, and Socialist legal tradition. Consistent with Hariri (Reference Hariri2012), and as can be appreciated in Table 6, we find that the presence of a durable centralized state is negatively associated with our indicator of culture although our finding is less robust.Footnote 7 We also find consistent evidence of a positive relationship between our culture indicator and German and Scandinavian legal origins. Finally, and as expected, a negative relationship emerges between Culture and a Soviet legal heritage. Inter-personal income inequalities continue to have a negative and statistically significant effect on culture.
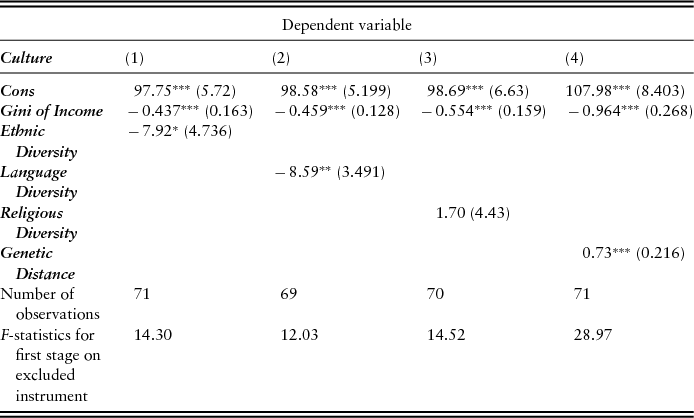
Another set of control variables captures other dimensions of social heterogeneity beyond income differences. In particular, scholars have reported the pernicious effect of ethnic or linguistic diversity on trust (see Alesina and La Ferrara, Reference Alesina and La Ferrara2005, for a review of this work). The need to control for this type of heterogeneity arises from the possibility that income differences may overlap with ethnic boundaries or, in other words, because of the existence of ethnic group inequalities (Alesina et al., Reference Alesina, Michalopoulos and Papaioannou2013; Kyriacou, Reference Kyriacou2013). Thus, failing to control for this could lead us to over-estimate the impact of inequality on culture. To measure heterogeneity, we use fractionalization defined as the probability that two randomly selected individuals belong to different ethnic, linguistic, or religious groups (Alesina et al., Reference Alesina, Devleeschauwer, Easterly, Kurlat and Wacziarg2003). To pursue the issue further, we also employ Genetic Distance; higher values of this variable imply culturally homogenous societies, while lower values suggest more culturally diverse ones (for more on this indicator see Ashraf and Galor, Reference Ashraf and Galor2013 and Ramachandran et al., Reference Ramachandran, Deshpande, Roseman, Rosenberg, Feldman and Cavalli-Sforza2005).
Consistent with previous work, our results indicate the detrimental effects of greater social diversity on culture (Table 7). Both ethnic and linguistic diversity are negatively associated with our culture indicator while, greater genetic distance, and by implication, more homogeneous societies, have a positive impact. Importantly, after controlling for all these variables, we still find inter-personal income inequalities to have a strong and statistically significant negative impact on Culture.
The impact of inequality on culture: controlling for social heterogeneity
Notes: Robust standard errors in parenthesis. ***, **, and * mean significant at 1%, 5%, and 10% respectively. Details of the variables are given in the Appendix. All regressions employ Two Stage Least Squares (TSLS). Inequality is instrumented by Tropical Area.
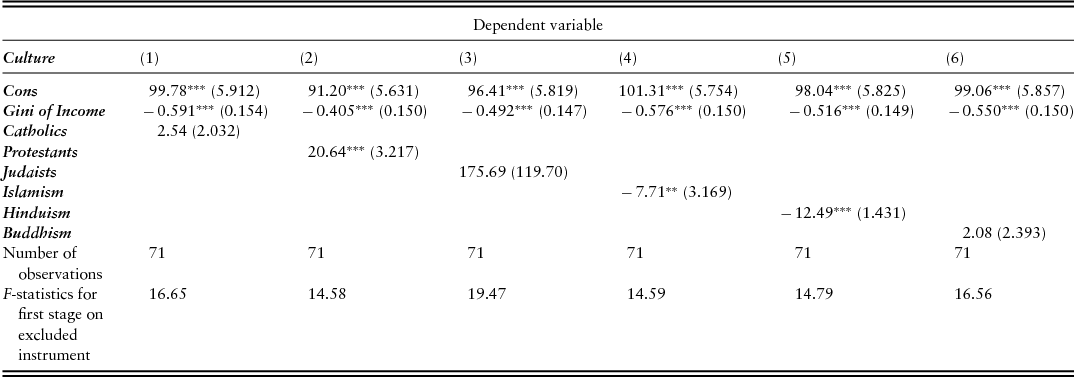
Ever since Max Weber pointed towards the protestant work ethic as a significant determinant of western European economic success, many economists have studied whether religiosity affects individual behavior. McCleary and Barro (Reference McCleary and Barro2006) and Guiso et al. (Reference Guiso, Sapienza and Zingales2003) report robust correlations between religious beliefs and the economic performance of countries. McCleary and Barro´s hypothesis is that some religious beliefs favor economic growth because they help people to maintain or reinforce specific values, such as thrift, a work ethic, honesty, and openness to strangers. It is reasonable to think that religious beliefs may affect those cultural traits that we consider in this article. We trace the potential impact of religious beliefs on culture by appealing to specific religious affiliations taken from McCleary and Barro (Reference McCleary and Barro2006). We control for six major religious denominations: Catholics, Protestants, Judaists, Islamists, Hindus, and Buddhists.
The statistics reported in Table 8 reveal that Protestantism has a statistically significant and positive effect on our culture indicator. Though the coefficient of Catholicism is positive, it is not significant in any of our regressions. Moreover, we report that adherence to Islamism and Hinduism is negatively associated with our measure of culture, a finding that is consistent with Guiso et al. (Reference Guiso, Sapienza and Zingales2003) who also found that followers of these religions express a weaker adherence to pro-growth attitudes.Footnote 8 The estimated negative impact of inequality on culture is robust to the inclusion of proxies controlling for religion. Note also the drop in the estimated impact of inequality when Protestants is included, suggesting that Protestantism may be negatively associated with inequality in our sample.
The impact of inequality on culture: controlling for religious affiliation
Notes: Robust standard errors in parenthesis. ***, **, and * mean significant at 1%, 5%, and 10% respectively. Details of the variables are given in the Appendix. All regressions employ Two Stage Least Squares (TSLS). Inequality is instrumented by Tropical Area.
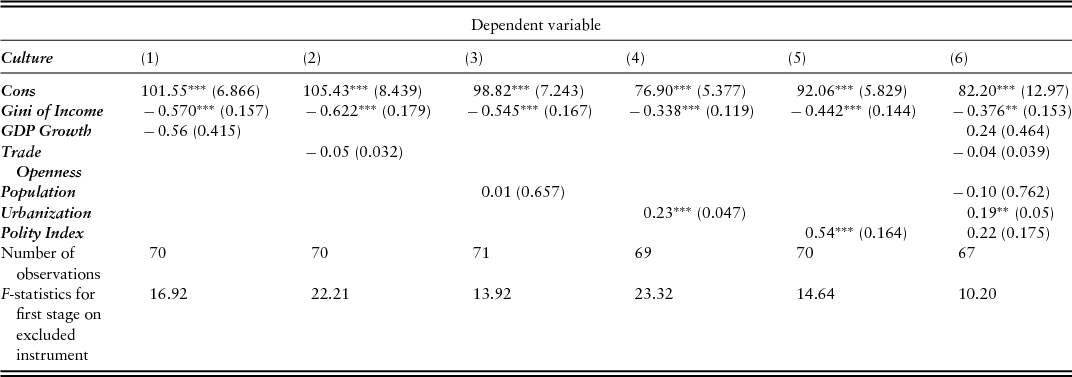
Culture may also be shaped by more contemporary forces. In Table 9, we control for contemporary demographic, economic, and political variables. GDP Growth is not statistically significantly associated with culture. Our pro-trade proxy, Trade Openness, suggests the erosive impact of globalizing forces on culture, as we measure it, but the result is not statistically robust. Nor does Population have a statistically significant impact on culture, despite the expectation of a debilitating effect of increasingly group size on the enforcement of social norms (Ellickson, Reference Ellickson1991; Ostrom, Reference Ostrom1990).
The impact of inequality on culture: controlling for contemporary demographic, economic, and political variables
Notes: Robust standard errors in parenthesis. ***, **, and * mean significant at 1%, 5%, and 10% respectively. Details of the variables are given in the Appendix. All regressions employ Two Stage Least Squares (TSLS). Inequality is instrumented by Tropical Area. GDP = gross domestic product.
Alternatively, a higher urbanization rate appears to be positively correlated with our measure of culture at statistically significant levels. Note that by including Urbanization we also aim to capture the impact of GDP (gross domestic product) per capita on culture. Given the strong negative correlation between GDP per capita and inequality (see also Easterly, Reference Easterly2007), controlling for the former would tend to inflate the variances and might prevent a proper identification of any ‘real’ effects. Therefore, one way to get around this problem is to exploit the strong correlation between urbanization and GDP per capita.Footnote 9 Finally, the variable Polity Index, which measures political liberties, indicates a positive effect of increasing democratization on the culture, but the result is not robust to the addition of other controls. Overall therefore, we find that the deleterious effect of inequality on culture remains meaningful at statistically significant levels even in the presence of potentially confounding contemporaneous effects.
Finally, as a further robustness check, we consider the effect of inequality on culture while at the same time controlling for all those variables which have proven to be statistically significant in this section. As can be seen in Table 10, the negative effect of inequality on our culture indicator remains both economically and statistically robust despite this especially demanding exercise.
The impact of inequality on culture: controlling for relevant variables
Notes: Robust standard errors in parenthesis. ***, **, and * mean significant at 1%, 5%, and 10% respectively. Details of the variables are given in the Appendix. All regressions employ Two Stage Least Squares (TSLS). Inequality is instrumented by Tropical Area.
5. Conclusion
We have found a sizeable amount of evidence of a significant negative impact of income inequality on culture measured by the extent to which a country's citizens trust and respect others, have a sense of control, and eschew obedience. This finding is robust to the inclusion of a range of potentially confounding regional-specific, geographic, and historical variables as well as others that capture the degree of social heterogeneity, the impact of religious beliefs, and the influence of contemporary economic, demographic, and political factors. Moreover, because of the real possibility that our estimated relationship suffers from both measurement error and reverse causality, we turn to instrumental variables estimation based on an exogenous determinant of income inequality, namely, the share of a country's land in the tropics. The use of this instrument confirms the causal impact of inequality on culture.
Our work here complements but is distinct from previous work which has related inequality to both economic development and government quality. There is an ongoing debate about whether inequality, by driving redistributive policies, is inimical to growth (Alesina and Rodrik, Reference Alesina and Rodrik1994; Banerjee and Daflo, Reference Banerjee and Duflo2003; Barro, Reference Barro2000; Persson and Tabellini, Reference Persson and Tabellini1994). And there is mounting evidence that inter-personal inequality can undermine governance by contributing towards the capture of economic and political power by elites or leading under-privileged individuals to structure their activity in the shadow of the law (for example, Chong and Gradstein, Reference Chong and Gradstein2007; Glaeser et al., Reference Glaeser, Scheinkman and Shleifer2003; Sonin, Reference Sonin2003; You and Khagram, Reference You and Khagram2005). In this article we have reviewed a growing body of work which has identified the importance of culture for both economic development and governance. In this light, inequality may hamper both economic development and governance to the extent that it also undermines the emergence of specific cultural traits.
Acknowledgements
We are grateful to the Editor and two anonymous referees for their helpful and productive comments. Francisco López would like to thank Domingo Sifontes and Xavier Ramos for providing constructive criticism to an early version of this paper. Andreas Kyriacou would like to acknowledge financial support from projects ECO2010-21668-C03-02 and ECO2012-31081 (Ministerio de Educación y Ciencia) as well as 2009SGR-2013 and XREPP (Direcció General de Recerca). The usual disclaimers apply.
Appendix
List of variables and their sources
List of countries in the sample