





Alcohol consumption is causally associated with a range of acute and chronic health harms(1), and worldwide 2·6 million deaths are attributed to alcohol use annually(1). Despite the manifest risks of use, rates of consumption in many countries are high(1,2) , and the alcohol market – worth almost US$1·5 trillion globally in 2021 – is projected to continue growing and reach US$1·8 trillion by 2029(Reference Deore3). The continued ubiquity of alcohol consumption worldwide is due, in large part, to sustained promotion and marketing efforts by the alcohol industry(Reference Jernigan and Ross4).
In recent years, an emerging alcohol marketing strategy has been the use of nutrition claims on product labels in order to emphasise a specific ‘healthy’ attribute of the beverage (e.g. ‘no sugar’ or ‘low carb’)(Reference Haynes, Chen and Dixon5). This practice has been called ‘virtue marketing’ – that is, highlighting ‘virtuous’ properties of a product to increase its appeal(Reference Haynes, Dixon and Wakefield6). Alcohol products may display a range of nutrition-related claims, but only some fall under regulatory oversight. Australian food safety laws(7) prohibit statements that suggest or imply health benefits, as well as certain nutrition content claims (e.g. regarding fat or potassium). By contrast, these laws expressly allow factually accurate claims regarding the energy, carbohydrate, sugar and gluten content of alcoholic beverages. Claims that are unregulated by food safety laws (and are therefore permitted by default) include highlighting health-oriented attributes such as the presence of ‘natural’ ingredients or the product being ‘preservative-free’(7). This paper focusses on claims formally or informally permitted on alcohol products and refers to them collectively as ‘nutrition claims’.
Studies have found approximately half of the alcohol products for sale in Australia display nutrition claims (with some variation according to product type)(Reference Haynes, Chen and Dixon5,Reference Barons, Mann and Orellana8,Reference Sträuli, Booth and Laznik9) , and international research echoes these findings(Reference Demers-Potvin, Gaucher-Holm and Hobin10). Evidence suggests that these increasing efforts to position alcohol products as healthy are an attempt by industry to leverage the general consumer trend of health consciousness(Reference Keric and Stafford11). Moreover, these efforts appear to be succeeding. Research has found that various nutrition claims, particularly those relating to sugar, calories and carbohydrates, create a ‘health halo’ effect(Reference Haynes, Dixon and Wakefield6) whereby consumers interpret products with claims to be healthier and even lower in alcohol when compared to identical products with no claims(Reference Cao, Tang and Carboon12–Reference Yusoff, Jones and Sträuli14).
While a growing body of literature has investigated the association between nutrition claims and perceptions of the alcohol product on which the claims appear – particularly in regard to increased perceived healthiness(Reference Haynes, Ilchenko and Dixon13,Reference Haynes, Talati and Keric15) – less attention has been directed towards how the claims themselves are perceived. For instance, key factors that have been investigated in the food label cognitive processing sphere include: credibility of messaging claims (i.e. the extent to which consumers believe the claim is true); relevance (i.e. the extent to which they believe the claim is relevant to them personally); importance of information conveyed by the claim; and how easily the claim is understood(Reference van Trijp and van der Lans16). These dimensions of consumer perception do not appear to have been investigated in the context of nutrition claims on alcohol products.
Similarly, there has been little examination of whether claim recall and understanding vary by claim type and consumer profile. Different nutrition claims (e.g. ‘low sugar’ v. ‘vegan’) communicate distinct contextual, nutritional and health-related information and may correspondingly elicit different cognitions or perceptions of credibility, relevance, importance and understandability. Similarly, different consumer groups have different needs and preferences which may shape their response to various claims. However, to date, these differences have not been systematically examined across a broad range of claim types. As a result, it remains unclear which claims are most frequently encountered and positively perceived and the specific groups on which they are likely to exert the greatest influence.
Given the potential public health implications should the use of claims continue to expand as an industry marketing tool, a comprehensive understanding of how consumers perceive nutrition claims is now a priority. Identifying the consumer groups who may be more inclined to be swayed by claims, and the claim types that are generally perceived most positively, can provide important information for future targeted public health policy or educational efforts to offset alcohol industry marketing tactics.
To address these research gaps, the present study sought to investigate exposure to and perceptions of alcohol nutrition claims within the Australian context, specifically: (1) consumers’ awareness of nutrition claims on alcohol labels; (2) how nutrition claims are understood in terms of perceived credibility, ease of understanding, importance and relevance; and (3) whether awareness and perceptions vary according to claim type and consumer characteristics. Finally, we sought to (4) identify consumer characteristics that predict more favourable perceptions towards nutrition claims on alcohol labels.
Method
An online survey of Australian consumers was administered by Pureprofile, an ISO-accredited web panel provider, in October–November 2024. Panel members were eligible to complete the survey if they were aged 18 + years, resided in Australia and drank alcohol more than once a month. Quotas were used to ensure the sample reflected the Australian population in terms of age, gender and region. Participants were reimbursed approximately AU$5 by the panel provider. Ethics approval for the study was obtained from the University of New South Wales (UNSW) Human Research Ethics Committee (approval #iRECS4533), with cross-institutional approval from the Flinders University Human Research Ethics Committee (approval #7486).
Study design
Eight different types of nutrition claims that can appear on alcohol labels were selected for inclusion: carbohydrates (e.g. ‘low carb’), sugar (e.g. ‘zero sugar’), calories (e.g. ‘x calories’), vegan (e.g. ‘vegan friendly’), natural ingredients (e.g. ‘100 % natural’), gluten (e.g. ‘gluten free’), fruit (e.g. ‘made with real fruit juice’) and additives (e.g. ‘no additives or preservatives’). These nutrition claims were chosen based on their high prevalence within the contemporary Australian alcohol market(Reference Sträuli, Booth and Laznik9).
To assess awareness and perceptions of claims, participants were instructed: ‘The following questions will show you examples of different statements that can be found on the labels of some alcohol products. Please look carefully at each image and answer the questions below. When answering the questions, please think about all alcohol products that you may have seen, either in person or in advertisements’. Participants were then shown a series of mock alcohol products, each displaying a different nutrition claim (see Figure 1 for an example). The mock products were presented in the form of simplified, black-and-white beverage outlines (i.e. non-photorealistic) in order to reduce the confounding effect of other visual elements (e.g. graphic design) that may influence product perceptions. Claim order was randomised, and each participant saw all claim types (i.e. eight total).
Example of stimuli presented to participants.

Measures
Demographics
Demographic characteristics of interest were age, gender, geographical region, educational attainment (i.e. highest level of education achieved) and gross personal annual income. Question format was adapted from the National Drug Strategy Household Survey(2). Select variables were recoded into binary variables for analytical purposes: age was recoded into two categories (18–45 and 46+), using the sample’s median age of 46 years as the cutoff point; geographical region was coded as metropolitan v. regional; education was coded as lower (vocational training, high school or below) v. higher (bachelor degree or higher); and personal income was coded as lower (<$104 000) v. higher (≥$104 000). Participants who identified as non-binary, another gender identity or did not disclose their gender (n 5) were excluded from gender-based analyses due to small numbers (but included in all other analyses).
Alcohol consumption
Participants were asked to indicate (1) how often they had an alcoholic beverage of any kind, (2) how many standard drinks they usually have on a day they drink alcohol and (3) how often they have 5+ standard drinks on a single occasion. Using methodology outlined by the Australian Institute of Health and Welfare(17), a variable was calculated for high- or low-risk alcohol use to reflect whether participants exceeded the current Australian guideline for low-risk drinking (i.e. whether they consumed more than ten standard drinks per week or more than four standard drinks on a single occasion)(17). Participants were also asked how often (never, rarely, sometimes, frequently, always) they purchased alcohol in various locations (in person at a bottle-shop/liquor store, online including click and collect, restaurants/cafes, pubs/clubs and events). A ‘label exposure’ variable was created to classify participants based on their alcohol purchasing habits: participants who reported ‘frequently’ or ‘always’ buying alcohol in person at bottle shops/liquor stores or online were categorised as having higher potential exposure to alcohol labels, while participants who reported buying alcohol from those locations infrequently were categorised as having lower potential exposure.
Awareness and cognitive perceptions of nutrition claims
After viewing each claim type, participants were asked how frequently they had seen similar claim types (e.g. about low carbohydrates) in the past 6 months on a five-point Likert scale (1 = never and 5 = very frequently). For example: ‘how often have you seen statements about calories (e.g. “low calorie” or “x calories”) on the label of an alcohol product in the past 6 months?’ Participants were then asked to indicate their agreement on a five-point Likert scale (1 = strongly disagree to 5 = strongly agree) with a range of statements regarding their perceptions of claims. Those included in the present analyses were: (1) ‘statements about [X] on alcohol labels are true’; (2) ‘statements about [X] on alcohol labels are easy to understand’; (3) ‘it is important for consumers to have access to information about [X] on alcohol labels’; and (4) ‘statements about [X] on alcohol labels are personally relevant to me’. These constructs are commonly assessed in nutrition messaging(Reference van Trijp and van der Lans16,Reference Jongenelis, Booth and Pettigrew18) and alcohol labelling(Reference Pettigrew, Jongenelis and Glance19) research and were adapted for use in the present study with minor wording alterations. All visual stimuli and associated questions are presented in Supplementary Material 1.
Analysis
Data were analysed in IBM SPSS (v29) with statistical significance set at p < 0·05. Perception variables originally measured on a 5-point Likert scale were treated as continuous scale variables to compare mean levels of agreement between groups. A principal component analysis was then undertaken to compute a ‘positivity’ score as the mean of the four perception items for each claim type. Cronbach’s α reached or exceeded the threshold of 0·7 for the sugar, carbohydrate, calorie, vegan, natural and fruit scales. Gluten and preservatives scales were excluded from further analysis due to lower reliability (α = 0·57 and 0·64, respectively).
Descriptive statistics were run for demographic, awareness and perception variables. Pearson χ 2 analyses with a two-sided test of equality of column proportions (for categorical variables) or pairwise tests of the equality of column means (for continuous variables) were used to examine associations between awareness/perceptions and demographic and alcohol consumption variables, with the tests adjusted for all pairwise comparisons using the Bonferroni correction.
Finally, multiple linear regression analyses were conducted to identify factors associated with positive perceptions of each type of nutrition claim. A series of linear regression models were first run, regressing possible dependent variables on each of the six independent variables (i.e. the ‘positivity’ score for each of the six claim types) one at a time. Those significantly (p < .01) associated with at least one of the six dependent variables were selected for inclusion. This resulted in the inclusion of eight independent variables: age, gender, region, education, income, high-risk drinking behaviour, label exposure potential (i.e. frequency of purchasing in-person/online) and frequency of seeing that claim type in the past 6 months. Six separate regression models were then run to examine associations between these predictors and positive perceptions of each of the six claim types: sugar, carbohydrate, calorie, vegan, natural and fruit. Data were checked for independence of observations, linearity, homoscedasticity, multicollinearity, normality of residuals and significant outliers, with all assumptions met.
Results
Sample characteristics
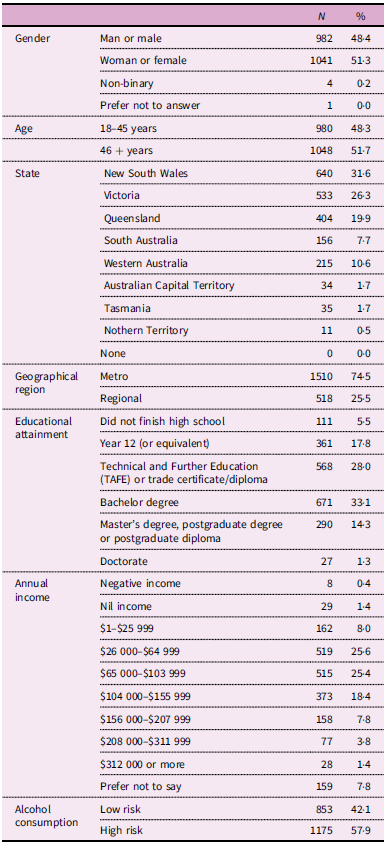
The final sample comprised 2028 individuals. Sample characteristics are summarised in Table 1. There was an almost even split between men (48·4 %) and women (51·3 %) and participants in the ‘younger’ (18–45) and ‘older’ (46+) age groups (48·3 % and 51·7 %, respectively). Most participants (74·5 %) resided in a metropolitan location, almost half (48·7 %) had a ‘higher’ education classification (bachelor degree or higher) and 56·8 % had a ‘higher’ annual income (≥$104 000). More than half (57·9 %) drank alcohol at levels that exceeded the National Health and Medical Research Council (NHMRC) low-risk alcohol guideline(17).
Sample characteristics

Table 1. Long description
A table summarizing sample characteristics by gender, age, state, geographical region, educational attainment, annual income, and alcohol consumption. The table has 10 rows and 3 columns. Column headers are Gender, Age, State, Geographical region, Educational attainment, Annual income, and Alcohol consumption. Row labels are Man or male, Woman or female, Non-binary, Prefer not to answer, 18-45 years, 46+ years, NSW, VIC, QLD, SA, WA, ACT, TAS, NT, None, Metro, Regional, Did not finish high school, Year 12, TAFE or trade certificate/diploma, Bachelor degree, Master’s degree, postgraduate degree or postgraduate diploma, Doctorate, Negative income, Nil income, $1-$25 999, $26 000-$64 999, $65 000-$103 999, $104 000-$155 999, $156 000-$207 999, $208 000-$311 999, $312 000 or more, Prefer not to say, Low risk, High risk. Values are provided for each category.
Awareness and perceptions of claims
The majority of participants (57·2 %) had seen at least one type of claim frequently or very frequently within the past 6 months. Awareness of specific nutrition claims varied considerably by claim type. Almost one-third of participants reported that they had frequently (including very frequently) seen a carbohydrate (31·7 %) or sugar (30·7 %) claim in the past 6 months, while only 6·6 % reported that they had frequently seen a vegan claim. Significantly higher levels of awareness were consistently reported by participants who were younger, had a higher income and drank alcohol at levels above the low-risk guideline (Table 2).
Recall of nutrition claims by claim type and demographic characteristics (%)

Table 2. Long description
The table presents the percentage of participants who have seen various nutrition claims (Carbs, Sugar, Calories, Vegan, Natural, Gluten, Fruit, Preservatives/additives) with different frequencies (Never/rarely, Sometimes, (Very) frequently) across various demographic characteristics (Age, Gender, Education, Income, Region, Risky drinking). The table has 8 rows for each claim type and 12 columns for demographic characteristics, plus a Total column. Each row lists the percentage of participants who have seen the claim with the specified frequency. For example, for the Carbs claim, 22.0 percent of participants aged 18-45 never or rarely see the claim, while 36.3 percent see it (very) frequently. The table provides a detailed breakdown of how often different demographic groups encounter specific nutrition claims.
Note: Bolded values are significantly (p < 0·05) higher than the comparison group within the same column, based on Pearson χ 2 analyses with a two-sided test of equality of column proportions.
1 TAFE, high school or below.
2 Bachelor degree or higher.
3 <$104 000 annually.
4 $104 000 + annually.
Associations with positive claim attitudes
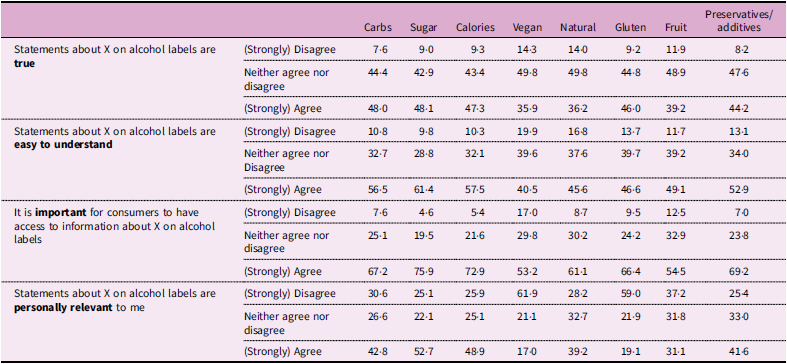
As shown in Table 3, across all claim types, approximately one-third to one-half of participants agreed/strongly agreed with the four statements that the claims were true, easy to understand, important and relevant.
Perceptions of nutrition claims by claim type (%)

Table 3. Long description
A table with four rows and nine columns comparing perceptions of nutrition claims by claim type. The columns are labeled Carbs, Sugar, Calories, Vegan, Natural, Gluten, Fruit, and Preservatives/additives. The rows are labeled with statements about the truth, understanding, importance, and personal relevance of the claims. Each cell contains percentages of participant responses categorized as (Strongly) Disagree, Neither agree nor disagree, and (Strongly) Agree. Notable trends include high agreement on the importance of having access to information about nutrition claims and varying levels of understanding and relevance across different claim types.
Participants’ perceptions of claims varied by consumer profile. Mean agreement that claims were true, relevant, important and easy to understand is presented in Supplementary Material 2 by claim type and demographic characteristics. Younger participants consistently had significantly higher mean levels of agreement across all four statements. Women, those with a higher education or income, those from metropolitan areas, those with higher label exposure and those who drank at high-risk levels also generally reported higher mean agreement, with some variation according to claim type.
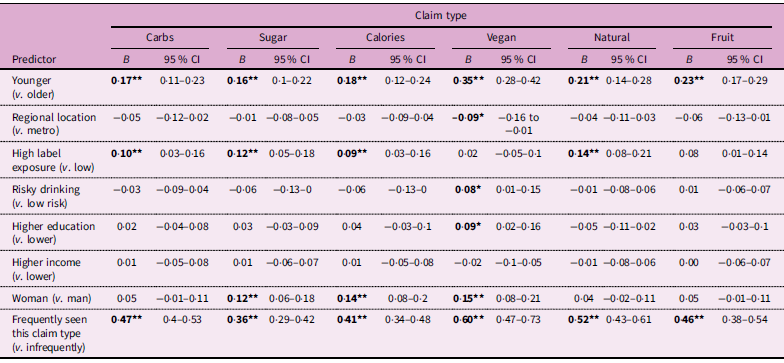
Table 4 presents the results of regression analyses examining factors associated with positive attitudes towards different types of nutrition claims, with more detailed information included in Supplementary Material 3. All six models were significant (p < 0·01), with adjusted R 2 values ranging from 0·10 (sugar) to 0·14 (carbohydrates and vegan). Three variables consistently predicted more positive attitudes towards all tested claim types: younger age, frequently purchasing alcohol from a bottle-shop/liquor store/online (with the exception of the vegan scale) and having seen that claim type on an alcohol product label in the last 6 months. Female gender was associated with more positive attitudes towards sugar, calorie and vegan claims. Higher education and drinking at levels above the low-risk guideline were associated with more positive attitudes towards vegan claims, while living in a regional area was associated with less positive attitudes towards vegan claims.
Predictors of positive attitudes towards nutrition claims, by claim type

Table 4. Long description
The table presents regression analysis results examining factors associated with positive attitudes towards various nutrition claims. It includes six models for different claim types: Carbs, Sugar, Calories, Vegan, Natural, and Fruit. Each model lists predictors such as age, regional location, label exposure, drinking risk, education, income, gender, and claim type frequency. The table has 8 rows and 13 columns, with each row representing a predictor and each column representing a claim type along with its 95 percent confidence interval. Notable predictors include younger age, high label exposure, and frequently seeing the claim type, which consistently show positive attitudes across all claim types. Female gender is associated with more positive attitudes towards sugar, calorie, and vegan claims. Higher education and risky drinking are linked to more positive attitudes towards vegan claims, while regional location is associated with less positive attitudes towards vegan claims.
*p < 0·05; **p < 0·01.
Discussion
This study investigated the awareness, cognitions and perceptions that Australians who regularly drink alcohol hold towards nutrition claims on alcohol labels. Overall, participants recalled seeing nutrition claims moderately often during the past 6 months, with considerable variation by claim type. Claims were generally perceived to be important based on participants’ cognitive evaluations, with credibility, relevance and understandability consistently highest for carbohydrate, sugar and calorie claims. Both awareness and perceptions varied considerably according to consumer profile. Younger age and greater exposure to and higher awareness of claims consistently predicted more positive attitudes towards claims.
Carbohydrate- and sugar-related claims were most frequently recalled by the largest proportion of respondents. Awareness of most claim types was higher among participants who consumed alcohol at high-risk levels, were younger and had higher incomes. These patterns likely reflect greater opportunity for exposure to claims among people who drink more frequently and/or who drink certain types of beverages. Beverage preferences tend to cluster by demographic characteristics including gender, age, socio-economic status and drinking level(Reference Cook, Kerr and Zhu20,21) , and the prevalence of nutrition claims also varies by beverage type(Reference Haynes, Chen and Dixon5). For example, ready-to-drink beverages are both particularly popular among young people(21) and have a high prevalence of nutrition claims(Reference Sträuli, Booth and Laznik9), which may explain the high awareness among younger age groups found in the present results. Similarly, men were more likely to have seen carbohydrate-related claims, which often appear on beer(Reference Barons, Mann and Orellana8).
In general, a substantial proportion of the sample reported favourable opinions of nutrition claims. In particular, the majority of participants agreed or strongly agreed that it is important for consumers to have information about every type of claim – even for claim types that had lower ratings of personal relevance (e.g. gluten or vegan claims). There was also generally low scepticism regarding nutrition claims (i.e. relatively low levels of disagreement with the statement that nutrition claims are true) and relatively high perceived ease of understanding, particularly for carbohydrate, sugar and calorie-related claims.
To the authors’ knowledge, this study is the first to examine these dimensions of claim perception in the context of alcohol products. Additional research is required to replicate these findings and to investigate potential nuances in greater depth. In particular, qualitative explorations could shed light on how consumers cognitively process and understand the information conveyed in nutrition claims. Existing qualitative studies indicate that consumers may hold conflicting views of nutrition claims, with some accepting industry’s ‘better for you’ messaging(Reference Yusoff, Jones and Sträuli22) and others applying a more critical or sceptical lens(Reference Atkinson, Meadows and Hobin23–Reference Haynes, Denejkina and Sands25). The latter view was not reflected in the current results; consumers in the present sample appeared to largely consider nutrition claims on alcohol labels as legitimate (i.e. true, important, relevant) sources of health information, rather than a marketing or advertising tactic. In the future, mixed-methods studies may be beneficial in elucidating exactly how, when and by whom claims are perceived as legitimate v. marketing messages. There are significant public health implications for how these messages are interpreted: if nutrition claims are not perceived as marketing materials, they may be subjected to less critical appraisal and more likely to be accepted at face value(Reference Eisend and Tarrahi26). Furthermore, it is possible that low levels of critical cognitive processing may exacerbate or interact with the ‘health halo’ effect in ways that promote increased consumption based on the assumption that perceived healthfulness mitigates potential alcohol-related health consequences. More research to examine the interplay between consumers’ perceptions of claims and their subsequent behaviours is therefore needed.
The substantial proportion of participants who agreed that access to the information conveyed by nutrition claims is important and (to a lesser extent) relevant suggests considerable consumer appetite for health information to guide decision-making around alcohol consumption. In particular, those with a higher level of education or income, women, those in metropolitan areas, younger people and people who drink at high-risk levels consistently reported favourable opinions of nutrition claims. Notably, many of these groups could be expected to have greater capacity (i.e. more disposable income/more purchasing options) or motivation (i.e. higher health consciousness/more frequent alcohol purchasing) to be selective in their beverage choice. That is, groups with greater discretion in their choice of alcoholic beverages appear receptive to health and nutrition-related messaging. In the absence of consistent, evidence-based health information on alcohol labels, these consumers may perceive industry marketing claims favourably on the mistaken assumption that they provide genuine health guidance. This reflects a deeply problematic information asymmetry, whereby consumers are consistently exposed to marketing-driven messages at the point of purchase, but are not provided with evidence-based counter-messaging regarding the health harms of alcohol use.
The linear regression models similarly identified consumer groups who may be particularly receptive to the promotional influence of claims (i.e. those with greater claim awareness and exposure and those in younger age groups). The association between awareness, exposure and positivity may be a function of normalisation, whereby seeing claims more often engenders positivity simply due to familiarity. This provides further impetus for policy initiatives to limit the increasing prevalence of nutrition claims, before their use becomes ubiquitous and entrenched in consumer expectations. The association with age likely reflects greater health consciousness among younger generations(Reference Caluzzi, MacLean and Livingston27). Evidence indicates that younger people are especially vulnerable to industry marketing tactics(Reference Haynes, Dixon and Wakefield6,Reference Bartram, Harrison and Pettigrew28–30) and are also more likely to misperceive that nutrition claims mean an alcohol product is healthier or ‘better for you’(Reference Haynes, Ilchenko and Dixon13). Coupled with high levels of health consciousness in this group, it is possible that nutrition claims on alcohol products have the potential to increase alcohol use among young people. Given that young people already experience high rates of alcohol consumption and related harms(Reference Danpanichkul, Duangsonk and Díaz31), any industry tactics that have a particularly strong influence on young people are a significant cause of concern.
Overall, these results support previous research indicating that more stringent regulation is needed to limit the use of claim-based marketing messages, so as to enable consumers to make informed decisions about their consumption, and promote better health outcomes in priority populations(Reference Sträuli, Booth and Laznik9,Reference Cao, Tang and Carboon12,Reference Haynes, Ilchenko and Dixon13) . The provision of on-label health warnings should remain a regulatory priority, in order to provide consistent and evidence-based information about the risks from alcohol consumption. A growing body of evidence indicates that health warning labels can not only increase alcohol-related knowledge(Reference Correia, Kokole and Rehm32,Reference Hobin, Weerasinghe and Vallance33) but can also reduce drinking intentions(Reference Clarke, Pechey and Kosīte34) and behaviour(Reference Zhao, Stockwell and Vallance35). Importantly, warning labels have been shown to be effective even in the presence of nutrition-related claims(Reference Hobin, Thielman and Forbes36) and can attenuate the positive influence of such claims(Reference Forbes, Vanderlee and Hobin37). However, their beneficial impact on perceived health risks, product appeal and consumption intentions is strongest when no nutrition-related claims are present(Reference Hobin, Weerasinghe and Vallance33). The ideal policy scenario from a public health perspective is therefore prohibiting nutrition-related claims while also mandating a health warning label.
More broadly, further research is required to understand how consumers can be provided with the health and nutritional information that appears to be increasingly expected, but in a manner that does not function as de facto marketing or minimise the inherent risks of consumption. This is a challenging task, as recent research demonstrates that displaying even a basic nutrition panel on alcohol labels is associated with higher perceived healthiness(Reference Vanderlee, White and Hammond38). There is a need to clearly distinguish evidence-based and public health-oriented information on alcohol product labels from industry-driven promotional claims, both within regulatory frameworks and in consumer understanding.
Limitations
The present study has a number of limitations that should be noted. While the sample was relatively large in size and broadly reflected the Australian population in terms of age, gender and location, it was obtained through non-probabilistic sampling and cannot accurately reflect the Australian population as a whole. Similarly, due to our research focus on regular drinkers who are likely to be most impacted by nutrition claims, non-drinkers and occasional drinkers were excluded from the study, resulting in a higher proportion of risky drinkers than is found in the general population in Australia. This may have implications for the way in which our sample perceived alcohol products and particularly their awareness of claims (given greater opportunity for exposure). In addition, the visual stimuli used in our study were not realistic depictions of alcohol products. ‘Real-world’ nutrition claims are designed and presented in various visually appealing ways (e.g. with different colours, designs and word choice) and may as such be perceived differently than the generic stimuli utilised in our study. Finally, it is noted that nutrition claims may impact consumer perceptions without conscious processing, which is unable to be captured in self-report surveys such as this.
Conclusion
The present results indicate that nutrition claims are perceived by many consumers as credible, relevant, understandable and important sources of information about alcohol. Public health policy responses to restrict this subtle and pervasive form of alcohol marketing are needed. Consumers who are seeking health and nutritional information to guide their product selection should have access to objective and evidence-based messaging – especially warnings regarding the harms of alcohol use – rather than relying on biased marketing tactics.
Supplementary material
To view supplementary material for this article, please visit https://doi.org/10.1017/S1368980026103395.
Data availability
Data supporting this study cannot be made available as participants did not consent to the sharing of their responses.
Authorship
VK: Conceptualisation, methodology, formal analysis, writing – original draft, writing – review & editing, project administration. SP: Conceptualisation, methodology, writing – review & editing, supervision, funding acquisition. AB: Conceptualisation, methodology, writing – review & editing. CN: Conceptualisation, methodology, writing – review & editing. AY: Conceptualisation, methodology, writing – review & editing. BS: Conceptualisation, methodology, writing – review & editing. PoB: writing – review & editing. MJ: writing – review & editing. AB: writing – review & editing. TC: writing – review & editing. JB: Conceptualisation, methodology, writing – review & editing, supervision.
Financial support
This research was supported by funding from the National Health and Medical Research Council (grant #2021186).
Competing interests
The authors have no conflicts of interest to declare.
Ethics of human subject participation
This study was conducted according to the guidelines laid down in the Declaration of Helsinki, and all procedures involving research study participants were approved by the UNSW Human Research Ethics Committee (approval #iRECS4533), with cross-institutional approval from the Flinders University Human Research Ethics Committee (approval #7486). Written informed consent was obtained from all subjects.




 Open access

