1 Introduction
Global child mortality (deaths under the age of 5 years) has fallen by a remarkable 53% since 1990, and has fallen in nearly all low- and middle-income countries (LMICs) (You et al., Reference You, Hug, Ejdemyr, Idele, Hogan, Mathers, Gerland, New and Alkema2015). However, inequalities in child mortality rates within countries remain high. If these inequalities could be reduced and average child mortality rates in each country were reduced to the rate seen among the wealthiest 10% in that country, then it is estimated that 2.9 million child deaths would be averted (Amouzou et al., Reference Amouzou, Kozuki and Gwatkin2014). Child mortality rates among the richest quintile in some LMICs can even be lower than the rates for the poorest quintile in some high-income countries (HICs), justifying an even greater focus on within-country inequalities. Therefore, the Countdown to 2015 Report and the UN Inter-agency Group for Child Mortality Estimation have highlighted inequalities in child mortality as a key priority for the Sustainable Development Goal era (You et al., Reference You, Hug, Ejdemyr, Idele, Hogan, Mathers, Gerland, New and Alkema2015; Victora et al., Reference Victora, Requejo, Barros, Berman, Bhutta, Boerma, Chopra, De Francisco, Daelmans, Hazel, Lawn, Maliqi, Newby and Bryce2016).
This study focusses on social inequalities in infant mortality rates (IMRs – deaths in the first year per 1000 live births). Infant mortality is responsible for 45% of all child deaths worldwide (Liu et al., Reference Liu, Oza, Hogan, Chu, Perin, Zhu, Lawn, Cousens, Mathers and Black2016), and the IMR remains high in many countries, predominantly due to death during the neonatal period (the first 28 days of life). IMR is a valuable indicator for assessing the short-term impact of changes in the social determinants of health because of the social origins of the main causes of infant death (Conley and Springer, Reference Conley and Springer2001; Sartorius and Sartorius, Reference Sartorius and Sartorius2014). Mortality during infancy stems from two main causes. First, it is caused by complications before, during, or just after pregnancy, which respond to basic antenatal, obstetric and neonatal health care services. Second, infant mortality is caused by infectious diseases, primarily pneumonia, diarrhoeal diseases and malaria. These are strongly determined by intermediate social factors such as malnutrition, access to water and sanitation infrastructure, fertility rates and education levels.
It is only recently that repeated Demographic and Health Surveys (DHS) have made it possible to study inequalities in IMRs in LMICs (Houweling and Kunst, Reference Houweling and Kunst2010). Studies have since identified divergent trends in inequalities in IMRs that varied by country. For example, Wagstaff et al. (Reference Wagstaff, Bredenkamp and Buisman2014) found that, between 1990 and 2011, approximately half of the 41 countries surveyed by the DHS programme had decreasing inequalities in IMRs over time, whilst half had increasing inequalities.
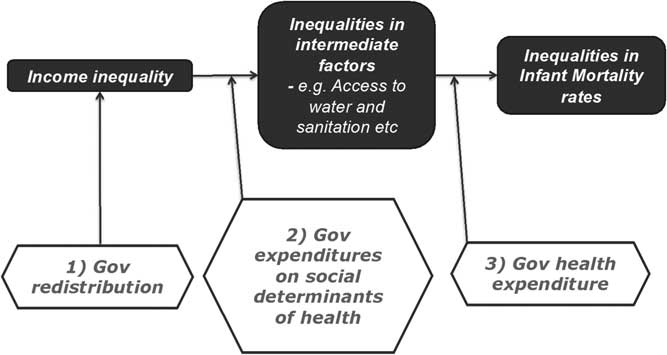
Houweling and Kunst (Reference Houweling and Kunst2010), based on the seminal work of Mosley and Chen (Reference Mosley and Chen1984), argue that variations in inequalities in IMRs are driven by inequalities in the intermediate causes of IMRs (e.g. access to water and sanitation), which are in turn driven by structural inequalities in society – particularly income and wealth inequalities. Based on their work, three theoretical policy levers can be proposed that governments could use to influence inequalities in IMRs: redistribution to reduce the underlying income and wealth inequalities, non-health government expenditure to reduce inequalities in the intermediate causes and health expenditure to reduce inequalities in health care utilisation (see Figure 1).
Conceptual framework, based on Houweling and Kunst (Reference Houweling and Kunst2010) and Mosley and Chen (Reference Mosley and Chen1984)

Few studies have attempted to empirically explain why some countries have high inequalities and some have low inequalities in IMRs. Most have focussed on child mortality rather than infant mortality. The earliest studies focussed on longitudinal studies in individual countries (see review by Houweling and Kunst, Reference Houweling and Kunst2010). There are difficulties arising from these studies as the results are often not generalisable beyond the country of study, and spurious results may be identified due to confounding with time trends (Wagstaff, Reference Wagstaff1985; Sogaard, Reference Sogaard1992). For example, any association found between health care expenditure and changes in health inequalities may in fact be due to long-term secular trends, such as economic growth or expanding access to education, which are often overlooked in these studies. Two recent cross-sectional studies using DHS data found no evidence that either income inequality or health expenditures were associated with inequalities in neonatal and child mortality (Kruk et al., Reference Kruk, Prescott, de Pinho and Galea2011; McKinnon et al., Reference McKinnon, Harper and Kaufman2016). The cross-sectional nature of these studies, however, means that they are vulnerable to bias from unobserved confounding between countries, and cannot elucidate changes within countries – two challenges this study attempts to overcome.
The limited evidence on the relationship between government health expenditure and inequalities in IMRs may stem from the study designs employed, but also may be due to alternative pathways by which government expenditures affect health inequalities. As suggested by researchers of inequalities in HICs, government spending outside of health care may be of critical importance to the health of the poorest social groups and therefore may be more important for reducing inequalities (Dahlgren and Whitehead, Reference Dahlgren and Whitehead2006). This was a core message of the World Health Organization (WHO) Commission on the Social Determinants of Health, and has recently re-emerged in LMICs as a key justification for social protection policies (WHO, 2008; Adato and Bassett, Reference Adato and Bassett2009). Furthermore, government expenditure on health may be influenced by many factors that either exacerbate or re-enforce existing health inequalities. For example, elite capture, where those with higher status influence resource allocation to their own benefit, may exist and may be particularly problematic in LMICs where weaker accountability mechanisms often operate. This could be envisioned as increased expenditures on specialist secondary care, which may be opposed to the health needs of the more deprived. Conversely, expenditure on non-health areas may be more impervious to elite capture if the actions are universal (e.g. sanitation systems) or targeted towards deprived populations (e.g. social protection programmes). Nonetheless, the extent to which this may be the case rests on wider factors including accountability, power structures and political priorities, and little research has been conducted in these areas. To our knowledge, the relative association of health and non-health government expenditures on health inequalities in LMICs has not been examined.
This study aims to assess the association between government expenditures and social inequalities in IMRs in a panel of 48 LMICs from 1993 to 2013. We examine how total government expenditure, government expenditure on health and non-health areas, and government redistribution efforts are associated with IMR inequalities.
2 Methods
2.1 Study design
This analysis employs fixed-effects panel data regression methods. Panel data methods are appropriate for repeated measures over time for each country (Wooldridge, Reference Wooldridge2003). Countries are the unit of analysis. The study was approved by the Imperial College Research Ethics Committee (reference 16IC3663).
2.2 Data
The main sources of data for the analysis were DHS carried out by The DHS Programme from years 1993 to 2013.Footnote 1 DHS are internationally standardised surveys based on a nationally representative sample of households in LMICs. Respondents provide information on household wealth,Footnote 2 alongside complete birth histories and deaths, and use of health services by women and children. We obtained country-level data on IMRs for each wealth quintile in each country from the WHO’s Global Health Observatory (WHO, 2016). The WHO produces these data based on DHS data sets. We included all countries that had been surveyed at least twice between 1993 and 2013 to create an unbalanced panel of 48 LMICs. Countries had been surveyed between two and seven times during the period 1993–2013.
Gross Domestic Product (GDP) per capita, government expenditure and its division into government sectors (including health, education and military expenditure) were extracted from the World Development Indicators [in constant 2011 US Dollars, adjusted for Purchasing Power Parity (PPP)] (World Bank, 2016). Each government expenditure variable was then re-calculated as a percentage of GDP to account for GDP growth, inflation over time, and population growth. Additionally, private health expenditures (as a % of GDP), out-of-pocket (OOP) private health expenditures (as a % of GDP), and the Polity IV index of democracy were extracted from the World Development Indicators database (World Bank, 2016). As an alternative indicator of the strength of a country’s democracy, we also extracted from the Database of Political Institutions data on whether a country uses proportional representation in their elections (World Bank, 2015).
We extracted income inequality indicators from the Standardized World Income Inequality Database (SWIID). We selected income inequality before government redistribution (GINI market) and income inequality after government redistribution (GINI net), taking the mean of the SWIID multiple imputation results (Solt, Reference Solt2016). The GINI is a commonly used measure of income inequality, and ranges from 0 (perfect equality) to 1 (perfect inequality).
For sensitivity analysis, we also obtained fertility rates (number of live births per reproductive age women), access to health services (a composite index of access to key reproductive, maternal and child health services), and malnutrition (% stunting amongst children under 3) for each wealth quintile from the DHS data sets (WHO, 2016). Access to water and sanitation services was not available by quintile, so mean access to water and sanitation was extracted from the World Development Indicators database (World Bank, 2016).
2.3 Dependent variables
The main outcome variables were the Slope Index of Inequality (SII) and the Relative Index of Inequality (RII). These were calculated from the quintile-specific IMRs obtained for each country for each year that the country was surveyed. The SII and RII are, respectively, absolute and relative indices of inequality, and they have been widely employed in similar studies (e.g. McKinnon et al., Reference McKinnon, Harper, Kaufman and Bergevin2014). The SII, an absolute measure of inequality, is produced by linearly regressing the IMR in each quintile on the rank of the quintiles, and represents the absolute difference in IMRs between the top and the bottom of the wealth distribution. The RII is the SII divided by the mean IMR, and represents the relative difference in IMRs between the top and bottom of the wealth distribution. These measures are superior to simple differences and ratios of the bottom and top quintile’s IMRs as they are informed by data from all quintiles. We used quintile-based measures of inequality rather than concentration indices because quintile-based IMR data are publicly available and quality controlled from the WHO’s Global Health Observatory, and because these measures are recommended both in the WHO’s (2013) inequality handbook and O’Donnell et al.’s (Reference O’Donnell, van Doorslaer, van, Wagstaff and Lindelow2008) World Bank report on measuring inequalities. In addition, the RII and the concentration index are closely related and considered mathematically equivalent, so we would therefore expect results for the concentration index to be roughly similar to those presented in this paper (Wagstaff et al., Reference Wagstaff, Paci and van Doorslaer1991). Both SIIs and RIIs of IMRs are used as dependent variables in this study and, whilst both measure inequalities, the results from both are presented as they have different normative interpretations, and can, at times, go in different directions (Houweling et al., Reference Houweling, Kunst, Huisman and Mackenbach2007; Wagstaff, Reference Wagstaff2015).
2.4 Independent variables
Based on our conceptual framework (Figure 1), the main variables of interest were government expenditure on health (as a percentage of GDP), non-health government expenditure (as a percentage of GDP) and government redistribution effort. Non-health government expenditure was calculated by subtracting government health expenditure from total government expenditure. For a sub-sample of countries with the data available, military and education expenditures were then also subtracted to produce government expenditure net of health, education and military expenditure. Government redistribution was calculated as the difference between the market GINI coefficient and the net (after tax) GINI coefficient to capture the degree to which governments were intervening to redistribute income.
Covariates were employed when modelling the SII and RII of IMRs to both identify associations and control for potential confounders. We included potential confounders of the relationship between government expenditure and inequalities in IMRs based on a review of the literature (Houweling and Kunst, Reference Houweling and Kunst2010), theoretical considerations from our conceptual framework, and data availability. GDP per capita was included to capture changes in country income, and was logged because it was heavily skewed. Private OOP health expenditures were subtracted from total private health expenditures to produce non-OOP private health expenditures (as a percentage of GDP). Private OOP and private non-OOP health expenditure capture the level of pre-pooling within the health system, the extent to which individuals are exposed to health care costs, and the overall role the private system plays in the health system. Both were included in the model as they may impart differential impacts on health inequalities (Spaan et al., Reference Spaan, Mathijssen, Tromp, McBain, ten Have and Baltussen2012).
A democracy indicator (Polity IV) was included in the model as it may influence factors such as elite capture and the degree to which government efforts are focussed on the poor. It has also been found to be associated with lower infant mortality and higher life expectancy in HIC (Mackenbach et al., Reference Mackenbach, Hu and Looman2013). There is, however, extensive debate regarding the extent to which democracy is indeed pro-poor and can reduce health inequalities (Ross, Reference Ross2006). Polity IV is the standard indicator for democracy in political and social science research (Munck and Verkuilen, Reference Munck and Verkuilen2002). We used the polity2 version of the indicator that was produced specifically for time-series analysis as part of the Polity IV project.Footnote 3 It varies from −10 (strongly authoritarian) to +10 (strongly democratic), based on assessments of the competitiveness and openness of political participation and executive recruitment, and constraints on the executive. We also used the democracy indicator to create a democracy dummy variable and stratify additional analysis. This additional analysis enabled us to explore whether the relationship between government expenditure and inequalities in IMRs varies according to a country’s average level of democracy over our study period. In our sample, Polity IV was distinctly bimodal, so we specified countries as lower democracy (if their average Polity IV over time was between −10 and +4.9) and higher democracy (Polity IV of 5.0 or above). A value of 5.0 was selected as the cut-off because it was the median value in our sample. As part of the sensitivity analysis, we also ran the analysis by stratifying the countries into those that use proportional representation in their elections and those that did not.
2.5 Intermediate variables
Our conceptual framework assumes that income inequality and government expenditures can influence inequalities in IMRs at least partly due to changes in inequalities in key intermediate variables. We therefore created SII for three available indicators from the WHO’s Global Health Observatory, which are based on DHS data (WHO, 2016). These were calculated from each wealth quintile’s fertility rates, access to health services, and an indicator of malnutrition (% stunting amongst children under 3). Access to Water and Sanitation services was not available by quintile; instead, mean access to Water and Sanitation was used. These intermediate factors above were not available for all countries and are also potentially on the pathway between government expenditure and inequalities in IMRs. Therefore, to preserve the sample size and to avoid over-controlling they were not included in the base model, but added one by one during model sensitivity analysis.
2.6 Regression models
Fixed-effects panel regression was employed as an appropriate method for modelling panel data. Longitudinal regression methods were necessary, as data points of each country over time in a panel are likely to be highly correlated (violating the principles of linear regression). Fixed-effects model specifications were used to control for any unobserved country characteristics (unobserved heterogeneity) that are constant over time and may be associated with observed explanatory variables (Wooldridge, Reference Wooldridge2003). This, for example, includes climate, natural resources, ethnic diversity and cultural factors. This avoids omitted variable biases from time-invariant factors that can plague cross-sectional ecological research (Conley and Springer, Reference Conley and Springer2001). On the other hand, only associations from the changes within countries over time are estimated. In other words, any associations between countries (i.e. between general levels of inequalities in IMRs and government expenditures across countries) are not estimated. A random-effects specification may have been more efficient; however, Hausman tests confirmed that the random-effects assumption was violated in our models (Hausman test: p=0.003 for our main SII model, and p=0.028 for the our main RII model). The use of fixed-effects specifications is also particularly advantageous for our research question because data on the determinants of inequalities in LMICs are limited, preventing us from fully pre-specifying a model with all confounders. Whilst there is the potential for omitted variable bias from time-variant factors, we control for time trends to reduce the risk of confounding by secular trends (such as improving health technologies) that previous time-series research may have been susceptible to (Wagstaff, Reference Wagstaff1985; Sogaard, Reference Sogaard1992). A linear time specification was preferred over year dummies because the trends were found to be generally linear, and to preserve degrees of freedom in our small data set. Alternative time specifications were included in sensitivity analysis. Because IMR responds rapidly to changing circumstances, we followed previous authors and did not include lagged specifications of our models (Conley and Springer, Reference Conley and Springer2001). Data were analysed in Stata 14.1 (StataCorp, 2015).
2.7 Statistical analysis
First, a descriptive overview of the data set was produced. For the study period (1993–2013), the overall mean, overall standard deviation and the between-country and within-country standard deviation of each variable were calculated. The mean annual within-country change in each variable was calculated with univariate fixed-effects longitudinal regressions between each variable and time (as a linear variable). For some countries, certain variables were not available, so only a subset of countries was used, with the number of countries and observations used indicated.
Second, multivariate fixed-effects longitudinal regression was employed with both the SII and RII of IMRs for 48 countries as dependent variables. These were used to examine the relationship between total government expenditure and inequalities in IMRs. In addition to total government expenditure as a percentage of GDP, models were controlled for GDP per capita (Log), Democracy indicator (Polity IV), Private non-OOP health expenditure as a percentage of GDP, Private OOP health expenditure as a percentage of GDP, country-level fixed-effects and a linear time trend. Sequential addition of covariates was undertaken and presented to demonstrate model stability. The model specifications were as follows:
 $$\hskip-22pt \eqalignno{ IMR\_ SII_{{it}} \,{\equals}\,Gov\_expenditure_{{it}} {\plus}LogGDP_{{it}} {\plus}Democracy_{{it}} \cr \hskip50pt {\plus}Private\_health\_not\_OOP_{{it}} {\plus}Private\_health\_OOP_{{it}} \cr \hskip50pt {\plus}Country_{i} {\plus}t{\plus}{\varepsilon}_{{it}} ,$$
 $$\hskip-22pt\eqalignno{ IMR\_RII_{{it}} \,{\equals}\,Gov\_expenditure_{{it}} {\plus}LogGDP_{{it}} {\plus}Democracy_{{it}} \cr \hskip55pt {\plus}Private\_health\_not\_OOP_{{it}} {\plus}Private\_health\_OOP_{{it}} \cr \hskip55pt {\plus}Country_{i} {\plus}t{\plus}{\varepsilon}_{{it}} ,$$
where X it is the value of variable X in country i for the year t; ε it the idiosyncratic error term for country i in year t (not estimated).
Third, five multivariate fixed-effects longitudinal regressions with the same specifications as above were employed with the IMR of each wealth quintile as the dependent variable. This was done to understand better the relationship between inequalities in IMRs and total government expenditure. The model specifications were as follows:
 $$\hskip-22pt\eqalignno{ IMR_{{qit}} \,{\equals}\,Gov\_expenditure_{{it}} {\plus}LogGDP_{{it}} {\plus}Democracy_{{it}} \cr \hskip38pt {\plus}Private\_health\_not\_OOP_{{it}} {\plus}Private\_health\_OOP_{{it}} \cr \hskip38pt {\plus}Country_{i} {\plus}t{\plus}{\varepsilon}_{{it}} ,$$
where X it is the value of variable X in country i for the year t; IMR qit the IMR for wealth quintile q in country i for year t; ε it the idiosyncratic error term for country i in year t (not estimated);
Fourth, to examine whether the relationship between total government expenditure was influenced by the democratic nature of a country, stratification of the fixed-effects longitudinal regression models 1 and 2 was undertaken. A dummy variable for democracy was employed, indicating whether a country had high or low average levels of democracy over the study period.
Fifth, disaggregation of total government expenditure was undertaken to further explore the relationship with inequalities in IMRs. Total government expenditure was disaggregated into (i) health and non-health areas; (ii) health, education and non-health/non-education areas; and (iii) health, education, military and non-health/non-education/non-military areas. The main regression models 1 and 2 specified above were repeated, using disaggregated government expenditures as dependent variables. Due to missing observations in the expenditure disaggregation data, a sub-sample of countries was used in some of the analysis (number of observations for each analysis are shown in the results tables).
Last, the effect of government redistribution efforts was explored. The regressions on the SII and RII of IMRs with total government expenditure (models 1 and 2) were repeated, with the introduction of the government redistribution efforts variable. Due to missing data, 22.4% of the observations were excluded. For comparability, the regression models on total government expenditure (without government redistribution efforts) were repeated with this sub-sample of observations.
All regression models employed cluster-robust standard errors to take into account the clustered nature of the data, and mitigate potential autocorrelation and heteroscedasticity (Wooldridge, Reference Wooldridge2010).
2.8 Sensitivity analyses
We conducted additional analyses to check the sensitivity of our findings. First, all regression models were re-run with outliers removed – defined as those with absolute studentised residuals of two or more, and without observations with a high leverage. Second, alternative specifications of the models were explored to identify potentially spurious relationships. The Stata module mrobust was employed to see if the results on total government expenditure were sensitive to inclusion or exclusion of variables (Young and Holsteen, Reference Young and Holsteen2015). Third, the regression models were repeated with year dummies rather than a linear time trend. Fourth, multivariate longitudinal models with total government expenditure were estimated with the additional intermediate variables included as covariates (specifically mean access to water and sanitation, and inequalities in fertility, stunting, and health service access). Due to missing observations, the sample sizes for these models were considerably smaller, and thus sequential addition of covariates was undertaken to preserve statistical power. Fifth, we replaced government redistribution with income inequality before government redistribution (market GINI), and repeated the democracy stratification analysis, this time stratifying the countries into those that use proportional representation in their elections and those that did not. Finally, the absolute level of IMR was added to the main models to observe if the relationship between government expenditure and inequalities in IMRs was sensitive to changes in the level of IMR.
3 Results
3.1 Descriptive results
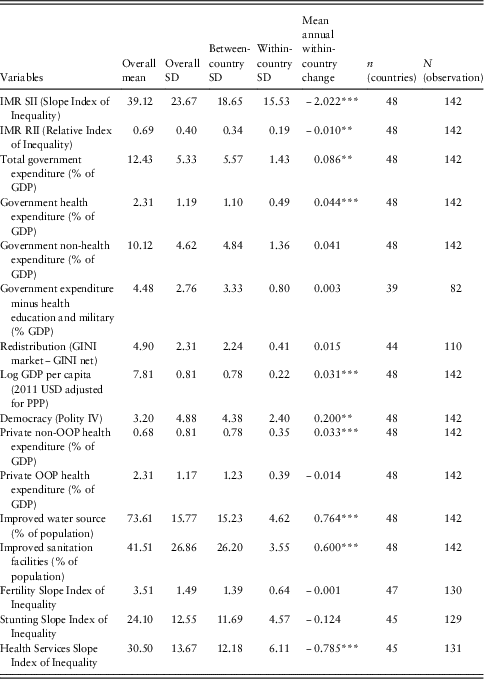
Our study included 142 observations from 48 LMICs (an average of 3.0 observations per country). A list of countries included is in the Online Appendix 1. The overall mean, overall standard deviation, between-country standard deviation, within-country standard deviation and average within-country change per year for each variable are shown in Table 1. The mean IMR SII over the study period was 39.12, illustrating that the average absolute difference in the IMRs between the richest and poorest quintiles was 39.12 deaths per 1000 live births. The IMR SII was decreasing at 2.022 per year on average, showing that the absolute gap between the richest and poorest quintiles’ IMR was narrowing over time. The mean IMR RII was 0.69 over the study period, meaning the IMR for the poorest quintile was on average 69% higher than for the richest quintile. The mean IMR RII was decreasing each year by 0.010, suggesting that the relative differences in IMRs were decreasing over time. Total government expenditure on average comprised 12.43% of a country’s GDP and was increasing each year by 0.086%.
Summary of means, overall standard deviation, between-country standard deviation, mean within-country standard deviations and mean within-country trends for variables

Note: IMR=infant mortality rate; SII=Slope Index of Inequality; RII=Relative Index of Inequality; GDP=gross domestic product; OOP=out of pocket.
Time trends were estimated with univariate fixed-effects regression of each variable with time.
Asterisk represent statistical significance: *p<0.05, **p<0.01, ***p<0.001.
3.2 Total government expenditure and inequalities in IMRs
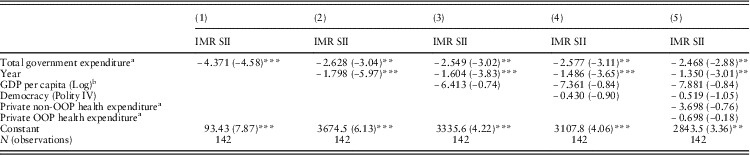
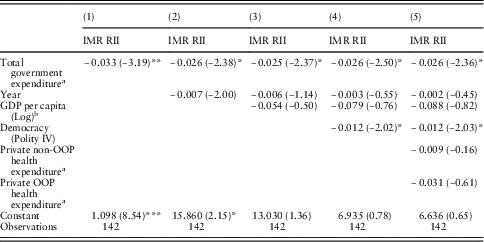
The results from the fixed-effects longitudinal regressions of the SII and RII of IMRs on total government expenditure are shown in Tables 2 and 3, including the sequential addition of covariates in models 1–5. In fully adjusted multivariate models, total government expenditure remains consistently and significantly associated with lower absolute (SII) and relative (RII) inequalities in the IMRs, even when controlling for linear time trends, democracy, GDP per capita, and OOP and non-OOP private health expenditure. For each percentage increase in total government expenditure (as a per cent of GDP), the SII of IMR decreased by −2.468 [95% confidence intervals (CIs): −4.190 to −0.746] and the RII decreased by −0.026 (95% CIs: −0.048 to −0.004). Apart from the time trends, all other covariates were non-significant except for democracy, which was significantly associated with reductions in RII, but not SII.
Results from fixed-effects longitudinal regressions of the Slope Index of Inequality (SII) on total government expenditure (for 48 countries from 1993 to 2013)

Note: IMR=infant mortality rate; GDP=gross domestic product; OOP=out of pocket.
t statistics in parentheses.
Asterisk represent statistical significance: *p<0.05, **p<0.01, ***p<0.001.
a % of GDP.
b 2011 USD adjusted for PPP.
Results from fixed-effects longitudinal regressions of the Relative Index of Inequality (RII) on total government expenditure (for 48 countries from 1993 to 2013)

Note: IMR=infant mortality rate; GDP=gross domestic product; OOP=out of pocket.
t statistics in parentheses.
Asterisk represent statistical significance: *p<0.05, **p<0.01, ***p<0.001.
a % of GDP.
b 2011 USD adjusted for PPP.
3.3 Total government expenditure and quintile-specific IMR
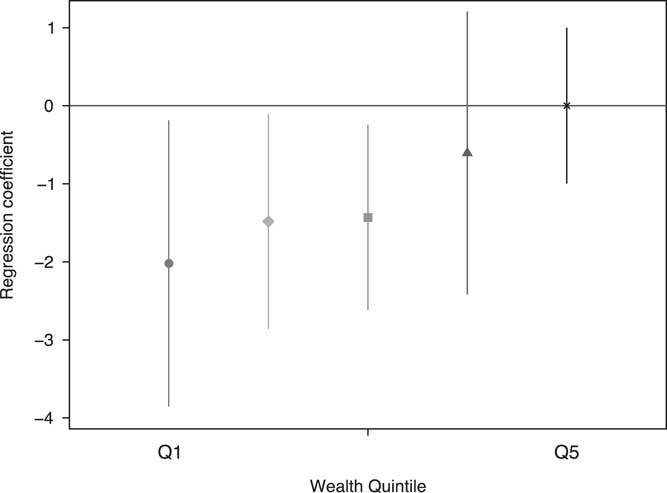
To understand better the relationship between total government expenditure and reductions in inequalities in IMRs, associations between IMRs in each wealth quintile and total government expenditure were explored. Figure 2 shows the point estimates and CIs for the coefficients for total government expenditure from the quintile-specific multivariate regression models on IMR. The relationship between total government expenditure and IMR appears to follow a social gradient, where the IMR falls the most in the poorest quintile. Full multivariate regression results are shown in the Online Appendix 2. For the poorest quintile, a one-percentage point increase in total government expenditure was associated with a reduction in IMR of −2.020 (95% CIs: −3.835 to −0.187). The relationship between IMR and total government expenditure was non-significant in wealth quintiles 4 and 5 (the richest), suggesting that the reductions in inequalities in IMRs were driven mainly by reductions in IMRs in the poorest quintiles.
Regression coefficients of total government expenditure from multivariate longitudinal regressions of quintile-specific infant mortality rates (IMRs) on total government expenditure for each wealth quintile (for 48 countries from 1993 to 2013) Note: The reported coefficients were obtained from multivariate fixed-effects longitudinal regressions of the quintile-specific IMRs on total government expenditure for each wealth quintiles. In addition to total government expenditure as a percentage of gross domestic product (GDP) (coefficients shown in figure), models were controlled for GDP per capita (Log), Democracy, Private non-out-of-pocket (OOP) health expenditure as a percentage of GDP, Private OOP health expenditure as a percentage of GDP, country-level fixed effects, and a linear time trend. Figure shows point estimates and 95% confidence intervals.

3.4 Stratification by level of democracy
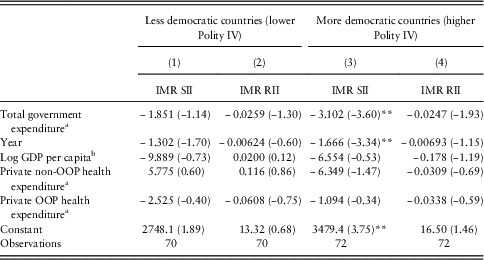
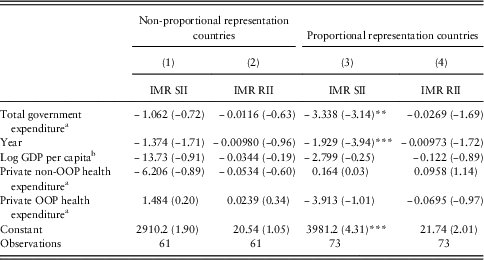
Because Polity IV was strongly bimodal, we divided our sample into two groups, using the median of the Polity IV democracy indicator as the cut-off. There were 24 countries in the lower democracy group and 24 countries in the higher democracy group. The results from multivariate regression models for both the SII and RII of IMRs for both groups of countries are shown in Table 4a. Whilst there was no significant relationship between total government expenditure and inequalities in IMRs in countries with lower levels of democracy, in countries with higher levels of democracy increased total government expenditure was associated with lower absolute inequalities in IMRs (SII). During sensitivity analysis, very similar results were found when stratifying the countries by use of proportional representation (see Table 4b).
Results from fixed-effects longitudinal regressions of the SII and RII of IMR on total government expenditure for 24 less democratic and 24 more democratic countries (1993–2013)

Note: SII=Slope Index of Inequality; RII=Relative Index of Inequality; IMR=infant mortality rate; GDP=gross domestic product; OOP=out of pocket.
t statistics in parentheses.
Asterisk represent statistical significance: *p<0.05, **p<0.01, ***p<0.001.
a % of GDP.
b 2011 USD adjusted for PPP.
Results from fixed-effects longitudinal regressions of the SII and RII of IMR on total government expenditure for 24 countries without proportional representation and 26 countries with proportional representation (1993–2013)

Note: SII=Slope Index of Inequality; RII=Relative Index of Inequality; IMR=infant mortality rate; GDP=gross domestic product; OOP=out of pocket.
t statistics in parentheses.
Asterisk represent statistical significance: *p<0.05, **p<0.01, ***p<0.001.
a % of GDP.
b 2011 USD adjusted for PPP.
3.5 Inequalities in IMRs and disaggregated government expenditure
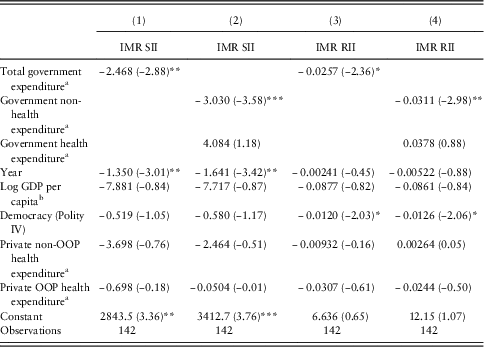
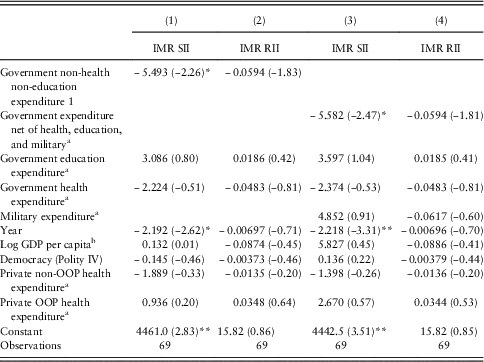
This component of the study examines the relationship between inequalities in IMRs and disaggregated government expenditure. As noted in the conceptual framework, total government expenditure might have an impact on health inequalities through government expenditure on health or government expenditure on non-health areas, or government redistribution effort. This was explored by repeating our regression models with disaggregated government expenditure.
Table 5 shows the results from multivariate regression models with total government expenditure (the same model as the first part of the analysis) and with total government expenditure divided into expenditure on health and non-health areas. In disaggregated models (models 2 and 4 in Table 5), there was no significant association between government expenditure on health and both the SII and RII of IMRs, whereas government expenditure on non-health areas was significantly associated with reductions in both SII and RII of IMRs. Further disaggregation of total government expenditure was undertaken, although due to missing data the number of countries available for analysis was lower (Table 6). Total government expenditure was disaggregated into expenditure on health, education and all non-health/non-education areas (models 1 and 2 in Table 6), and further into expenditure on the military and all non-health/non-education/non-military areas (models 3 and 4 in Table 6). In all models, government expenditure on health, education and the military were not associated with inequalities in IMRs. Government expenditure on non-health/non-education and also non-health/non-education/non-military areas were significantly associated with reductions in the SII of IMR. The coefficients for these associations were −5.493 (CI: −10.510 to −0.480) and −5.582 (CIs −10.230 to −0.931), respectively. There were no significant associations between these areas of government expenditures and the RII of IMR in these models. It is not possible to infer whether reduced sample size (and statistical power), the nature of the sub-sample of countries, or the underlying relationships with government expenditure explain either the non-significance of the RII of IMR or the greater reductions in the SII found compared to the models earlier in the analysis. This is the limit of how much government expenditure can be broken down in our data.
Results from fixed-effects longitudinal regressions of the SII and RII of IMR on total and disaggregated government expenditure (for 48 countries from 1993–2013)

Note: SII=Slope Index of Inequality; RII=Relative Index of Inequality; IMR=infant mortality rate; GDP=gross domestic product; OOP=out of pocket.
t statistics in parentheses.
Asterisk represent statistical significance: *p<0.05, **p<0.01, ***p<0.001.
a % of GDP.
b 2011 USD adjusted for PPP.
Results from fixed-effects longitudinal regressions of the SII and RII of IMR on non-health/non-education government expenditure and on government expenditure net of health, education, and military (in 26 countries from 1993 to 2013)

Note: SII=Slope Index of Inequality; RII=Relative Index of Inequality; IMR=infant mortality rate; GDP=gross domestic product; OOP=out of pocket.
t statistics in parentheses.
Asterisk represent statistical significance: *p<0.05, **p<0.01, ***p<0.001.
a % of GDP.
b 2011 USD adjusted for PPP.
3.6 Association between government redistribution efforts and IMR inequalities
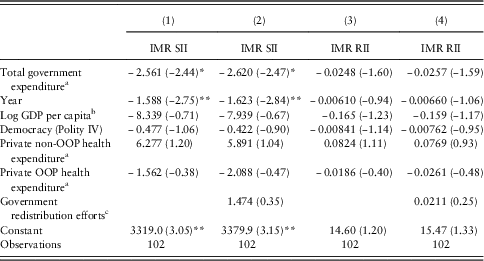
The regression models including total government expenditure were repeated with the addition of a government redistribution effort variable (Table 7, models 2 and 4). Missing data reduced the number of available observations, so for comparability the main regressions with total government expenditure but without redistribution efforts were repeated on the sub-sample (models 1 and 3 in Table 7). Similar relationships between total government expenditure and the reductions in the SII in IMR were observed both with and without government redistribution efforts, and these were also comparable to the results on the whole sample of countries. Regarding the RII, there was no significant relationship between total government expenditure in either model, suggesting that the reduced number of observations limited statistical power. Government redistribution efforts were not significantly associated with SII or RII. As a sensitivity analysis, when government redistribution effort was replaced with income inequality before government redistribution (market GINI), the results remained essentially unchanged and market GINI was not significantly associated with SII or RII (see Online Appendix 3).
Results from fixed-effects longitudinal regressions of the SII and RII of IMR on total government expenditure and government redistribution efforts (36 countries from 1993 to 2013)

Note: SII=Slope Index of Inequality; RII=Relative Index of Inequality; IMR=infant mortality rate; GDP=gross domestic product; OOP=out of pocket.
t statistics in parentheses.
Asterisk represent statistical significance: *p<0.05, **p<0.01, ***p<0.001.
a % of GDP.
b 2011 USD adjusted for PPP.
c GINI market−GINI net.
3.7 Sensitivity analyses
The main results were robust to the removal of outliers, observations with high leverage, and the use of year dummies rather than linear time trends. Total government expenditure also remained significantly and negatively associated with inequalities in IMRs in all 32 alternative model specifications in Stata module mrobust (Young and Holsteen, Reference Young and Holsteen2015).
Intermediate factors between the relationship of government expenditure and IMR inequalities were sequentially included in the regression model to test whether total government expenditure remained significant. Although a sub-sample of countries was used (due to missing data), the relationship between total government expenditure and inequalities in IMRs remained significant and with a similar coefficient after controlling for mean Water and Sanitation coverage, and inequalities in Fertility, Stunting and Health Service Coverage (see Online Appendix 4 for results). Finally, the addition of the absolute level of IMR to the models did not significantly change the results (see Online Appendix 5).
4 Discussion
4.1 Key findings
Total government expenditure was consistently associated with lower absolute (SII) and relative (RII) inequalities in IMRs, even when controlling for country fixed effects, linear time trends, democracy, GDP per capita, and OOP and non-OOP private health expenditure. For each percentage point that total government expenditure increased (as a % of GDP), the SII of IMR decreased by −2.468 (95% CIs: −4.190 to −0.746) and the RII of IMR decreased by −0.026 (95% CIs: −0.048 to −0.004). This means that for each percentage point increase in government spending as a proportion of GDP, the difference in IMRs between the richest and poorest quintile fell by 2.468, which is approximately 6.5% of the total difference.
Further examination of this relationship identified that it is mainly driven by reductions in the IMR in the poorest quintiles and appears to occur mostly in countries with higher levels of democracy (and those that use proportional representation). Disaggregation of government expenditure revealed that the relationship between total government expenditure and reduced inequalities in IMRs appears to be driven by expenditure on non-health rather than health areas. Furthermore, results from a sub-sample of countries show that the relationship between lower inequalities and total government expenditures persisted when removing expenditure on health, education, and the military. No evidence was found that GDP per capita, government redistribution, government health expenditures or private health expenditures were associated with inequalities in IMRs. Our results were robust to alternative model specifications and to the inclusion of intermediate factors in the models.
We originally hypothesised three factors that could influence inequalities in IMRs: government health expenditure, government non-health expenditure and government redistribution efforts. This was based on Houweling and Kunst’s (Reference Houweling and Kunst2010) conceptual framework. Our findings support the hypothesis that government non-health expenditure is most strongly associated with reducing infant health inequalities.
There are a range of potential mechanisms that could explain our findings. However, due to limited data availability, our study was not able to identify specific components of non-health government expenditure most strongly associated with lower inequalities in IMRs. In the 69 observations with data available, our sub-analysis suggested that, even when removing health, education and military expenditure, government expenditure remains strongly and significantly associated with reducing inequalities in IMRs. What remains in this section of government expenditure is not reported in the World Bank database. It may include government expenditure that expands basic incomes through social protection programmes or employment, improves transport and infrastructure or promotes a healthier environment. For example, recent evidence has found that social protection expenditures can improve health outcomes and reduce health inequalities (WHO, 2008; Stuckler et al., Reference Stuckler, Basu, Suhrcke, Coutts and McKee2009; Ataguba et al., Reference Ataguba, Day and McIntyre2015; Khan et al., Reference Khan, Guan, Audimulam, Cervero Liceras, Coker and Yoong2016). Further research, focussing on countries with more disaggregated government expenditure data, and particularly social protection data, is needed to explore this further.
The non-significance of health expenditures (both from the government and private sector) was found in all our models. This is consistent with the results of two recent cross-sectional ecological studies that also found no evidence that health expenditures were associated with inequalities in neonatal and child mortality inequalities (Kruk et al., Reference Kruk, Prescott, de Pinho and Galea2011; McKinnon et al., Reference McKinnon, Harper and Kaufman2016). There are multiple pathways through which health expenditure can improve infant mortality, but the extent to which distribution of funds and resources in the health system are ‘pro-poor’ and reduce health inequalities is politically determined and cannot be assumed. Indeed, government health expenditure in HIC is often noted to be pro-rich, as noted by Hart, who described it as the inverse care law (Hart, Reference Hart1971; McLean et al., Reference McLean, Guthrie, Mercer and Watt2015).
We found that redistribution efforts by governments had no association with inequalities in IMRs in LMICs. Whilst this result is surprising theoretically, empirical studies have often been unable to confirm the link between income inequalities and child health inequality, particularly in LMICs (Houweling and Kunst, Reference Houweling and Kunst2010; Truesdale and Jencks, Reference Truesdale and Jencks2016). Indeed, in one cross-sectional, ecological study using DHS data in LMICs, McKinnon et al. (Reference McKinnon, Harper and Kaufman2016) were also unable to find an association between income inequality and inequalities in neonatal mortality rates. One explanation for this finding might be that the fixed-effect methodology we employed estimates only within-country associations over time. The mean government redistribution value was 4.90 with a SD of 2.31, but the mean within-country SD was only 0.41, suggesting that, as expected, most of the variation in redistribution mechanisms is between countries – something that was not estimated in this analysis. Whilst we might conclude that changes in within-country redistributive efforts do not appear to affect IMR inequalities, we do not know about the effect between countries on average. Furthermore, we only looked for associations in changes in inequalities in IMRs and redistributive efforts at the same point in time; therefore, compared to government expenditures, there may be a greater period until the effects of redistributive efforts are felt.
4.2 Strengths and limitations
Fixed-effects longitudinal regression methods are robust methods for evaluating associations over time as time-invariant confounders can be controlled for and they permit elucidation of associations whilst controlling for time trends. Between-country variation is removed, however, and thus understanding of potential differences between countries in the terms of the explanatory variables is lost. This was considered necessary to avoid the assumptions of random-effects specifications. Country-level data points are used in this analysis, so an ecological bias may be present. It is therefore not possible to make individual inference based on this analysis. Furthermore, the study design does not enable causal inference, and the relationships identified must be considered as associations.
The use of both SII and RII, which in this study generally went in the same direction, enabled us to assess the impact on both absolute and relative inequalities. This measure makes use of data from across five wealth quintiles, so it is a better summary description of overall inequality. Because we generated the SII and RII from quintile-specific IMRs, there is still likely to be considerable heterogeneity within each wealth quintile. This study was thus unable to assess any associations or factors that changed within each quintile.
Data limitations are inevitable when in LMICs; however, the DHS do produce reliable and high-quality data sets. Standardised methodology enables comparison between the 48 countries and over time periods in addition to the creation of measures of health inequalities in IMRs. Whilst it is important to acknowledge that limitations may exist in terms of sampling strategy and response bias, DHS data sets are very valuable for conducting research in data-limited LMICs. There were a limited number of DHS surveys carried out to date that could be used in the analysis. This allowed us to include 142 observations, which, although sufficient when examining total government expenditure, was problematic for any further sub-analysis. For example, it was not possible to examine differences by regions of the world or by country development. Lack of data on inequalities in access to water and sanitation also prevented us from adequately exploring this promising intermediate variable. Missing data from countries on income inequality and disaggregated government expenditure reduced the sample size substantially and compromised statistical power. Our wealth index, while widely used in the context of LMICs, is not a perfect measure of wealth, and different components of the index may be differently valued across countries. Finally, there were limited data on further disaggregated government expenditure, and particularly on social protection expenditures, which prevented further elucidation of potential mechanisms of action.
5 Conclusion
This is the first study to the authors’ knowledge to examine total government expenditure and health inequalities in IMRs in LMICs. There appears to be a relationship between non-health government expenditure, potentially mediated through the wider social determinants of health, which needs to be further investigated. Further studies are warranted to determine the exact components of government expenditure that impart impact and the mechanisms of action. It is further necessary to understand the reasons as to why health inequalities seem resistant to increases in government health expenditure and mechanisms to redistribute income.
Theoretical considerations underpin much of the current global agenda for improving health and reducing inequalities. This research identifies that one widely believed idea that spending more money on health will improve health inequalities is not necessarily true. Instead, our results suggest that increasing other areas of Government expenditure might be more important, and future research should aim to disentangle which areas of public policy might be more critical to reduce infant mortality among the poor. Expanding the debate within the global development arena and with donor agencies, and furthering our understanding of the relationships between governments and inequalities is vital to prioritise policies and interventions to reduce health inequalities.
Supplementary material
To view supplementary material for this article, please visit https://doi.org/10.1017/S1744133118000269