Introduction
Effective tax collection is an important issue in government finance because taxes comprise a significant portion of a government’s revenue. Tax evasion is an illegal behaviour that reduces the government’s revenue and can damage the fiscal balance, hindering economic growth especially in developing countries. Crivelli et al. (Reference Crivelli, Mooij and Keen2016) estimate that worldwide revenue losses to tax evasion amount to around $650 billion per year and that developing countries experience one-third of those losses, whereas high-income countries experience much smaller revenue losses.Footnote 1 The revenue losses resulting from tax evasion attract public attention, which prompts governments to pursue effective taxation policies. Identifying the characteristics of taxpayers who are reluctant to comply with tax laws is the first step towards establishing effective tax enforcement schemes (Slemrod Reference Slemrod2008).
Since the seminal work of Allingham and Sandmo (Reference Allingham and Sandmo1972), many scholars have examined factors that affect taxpayers’ compliance behaviour. Some studies have explored psychological factors by conducting laboratory experiments (Christian and Alm Reference Christian and Alm2014; Fochmann and Kroll Reference Fochmann and Kroll2016) or field experiments (Hasseldine and Hite Reference Hasseldine and Hite2003; Dunn et al. Reference Dunn, Farrar and Hausserman2018). However, because taxpayers have incentives to conceal their tax evasion, it is very difficult to identify which kinds of individuals engage in this behaviour (Alm Reference Alm2012; Korndörfer et al. Reference Korndörfer, Krumpal and Schmukle2014; Mascagni Reference Mascagni2018). When taxpayers are asked directly if they comply with the tax payment rules, they may falsefully report socially desirable or acceptable answers. This response bias is said to occur when the research question involves socially sensitive issues, including politics, religion, and taxation. In the context of taxation, tax evasion is more severe in developing countries than in developed countries because the latter have advanced tax systems (Pomeranz Reference Pomeranz2015).
Our study aims to identify the characteristics of taxpayers who do not comply with tax payment rules. To avoid social desirability bias from field surveys and to elicit sensitive information about taxation, we use a list experiment. This is a questionnaire design technique that allows us to minimize the social desirability bias in responses to sensitive questions. List experiments have been used to control for the bias associated with sensitive topics in various fields of social science, particularly in political science. These studies have dealt with topics such as support for a female president (Burden et al. Reference Burden, Ono and Yamada2017), voter turnout (Holbrook and Krosnick Reference Holbrook and Krosnick2010), same-sex marriage (Lax et al. Reference Lax, Phillips and Stollwerk2016), conservation crime (Nuno and John, Reference Nuno and John2015), and animal disease (Randrianantoandro et al. Reference Randrianantoandro, Kono and Kubota2015). Despite the popularity of this experimental method, it has not so far been applied in research on taxation to our knowledge. Our study is the first attempt to use the list experiment technique in a developing country to identify which taxpayers comply when filing returns.
For our research, we collaborated with the Directorate General of Taxes (DGT), which is the tax authority in Indonesia. Using the list of taxpayers provided by the DGT, we implemented a computer-assisted telephone interviewing (CATI) survey of taxpayers who had filed their income tax forms in Jatinegara District, Jakarta Province, Indonesia. The survey was conducted between January and March in 2019, and 879 taxpayers participated in our phone interviews.
To preview the results of our list experiment, we found that around 13% of taxpayers had reported lower income on their tax returns than they actually earned. In particular, taxpayers who were old, male, Sundanese, or corporate employees showed low tax compliance behaviour. We believe that these results can help the tax authority design audit programs targeting specific groups of taxpayers to improve tax compliance. Based on our findings, the tax authority could design an effective taxation policy to increase tax revenues, including targeted groups of taxpayers that should be audited closely and continuously.
This article consists of five sections. In the next section, we review the previous literature on tax compliance. The third section explains Indonesia’s tax structure. The fourth section discusses the empirical analysis, including the survey design, data, and results of the study. In the final section, we summarize our findings and provide our conclusions.
Taxpayers and their compliance behaviour
Conventional studies of tax compliance have focused on efforts by tax authorities to deter noncompliance by taxpayers. Most of these studies investigate how taxpayers change their behaviour in response to changes in the probability of being detected and the levels of potential sanctions and penalties. From a theoretical perspective, Allingham and Sandmo (Reference Allingham and Sandmo1972) argue that tax compliance improves as the probability of detection increases and the punishments become more severe. However, recent studies criticize the traditional approach, emphasizing that other motivations play important roles behind tax compliance behaviour (Alm et al. Reference Alm, McClelland and Schulze1992). People pay taxes out of a recognition of the social benefits of public services and public goods provided by the government. Some studies point out that intrinsic motivation, including tax morale, also promotes tax compliance (Lubian and Zarri Reference Lubian and Zarri2011; Torgler Reference Torgler2012).
Taxpayers cannot be described as a single identical group because of the diversity in their behaviours (Alm Reference Alm2012). The heterogeneity among them must be acknowledged in explaining individuals’ tax compliance behaviours. Indeed, many empirical studies show that tax compliance behaviour varies across citizens depending on their demographic attributes and socioeconomic characteristics, including age, gender, income, and education (Kastlunger et al. Reference Kastlunger, Dressler, Kirchler, Mittone and Voracek2010; Lago-Penas and Lago-Penas Reference Lago-Penas and Lago-Penas2010; Russo Reference Russo2013; Brockmann et al. Reference Brockmann, Genschel and Seelkopf2016; Hofmann et al. Reference Hofmann, Voracek, Bock and Kirchler2017), culture (Alm and Torgler Reference Alm and Torgler2006; Kountouris and Remoundou Reference Kountouris and Remoundou2013), employment status and religion (Lago-Penas and Lago-Penas Reference Lago-Penas and Lago-Penas2010), and trust in and perceptions of government (Kirchler et al. Reference Kirchler, Hoelzl and Wahl2008; Kogler et al. Reference Kogler, Batrancea, Nichita, Pantya, Belianin and Kirchler2013; Jimenez and Lyer Reference Jimenez and Iyer2016; Batrancea et al. Reference Batrancea, Nichita, Olsen, Kogler, Kirchler, Hoelzl, Weiss, Torgler, Fooken, Fuller, Schaffner, Banuri, Hassanein, Alarcon-Garcia, Aldemir, Apostol, Weinberg, Batrancea, Belianin, Gomez, Briguglio, Dermol, Doyle, Gcabo, Gong, Ennya, Essel-Anderson, Frecknall-Hughes, Hasanain, Hizen, Huber, Kaplanoglou, Kudla, Lemoine, Leurcharusmee, Matthiasson, Mehta, Min, Naufal, Niskanen, Nordblom, Ozturk, Pacheco, Pantya, Rapanos, Roland-Levy, Roux-Cesar, Salamzadeh, Savadori, Schei, Sharma, Summers, Suriya, Tran, Villegas-Palacio, Visser, Xia, Yi and Zukauskas2019; D’Attoma Reference D’Attoma2020).
Regarding the link between age and tax compliance behaviour, the existing literature gives mixed results. Several works argue that older generations have different social values and behaviour towards the state and regulation from younger ones. For instance, Hofmann et al. (Reference Hofmann, Voracek, Bock and Kirchler2017) claim that old generations, who need social security and health care benefits, treasure the benefit of taxes and thus become more compliant than young generations do. Kirchler (Reference Kirchler2007) also argues that older people tend to have a better financial situation as well as fewer budgetary constraints, which make them become tax compliant. In contrast, however, some studies show the opposite, that older people are less tax compliant. Russo (Reference Russo2013) argues that older people exhibit lower tax compliance behaviour because they are dissatisfied with public services.
Concerning the relationship between gender and tax compliance, most studies show that women are more likely to be compliant than men (Betz et al., Reference Betz, O’Connell and Shepard1989; White Reference White1999). Hofmann et al. (Reference Hofmann, Voracek, Bock and Kirchler2017) claim that women are generally more ethical and have stronger morals than men, so that they are more tax compliant. Hasseldine (Reference Hasseldine1999) also suggests that women tend to perceive sanctions for misbehaviour or noncompliant behaviour as more severe and threatening than men.
People with different income levels may also behave differently in tax compliance, but again the literature shows mixed results on the relationship between income level and tax compliance behaviour. Some studies show that lower-income people are less compliant because they are more sensitive to their after-tax income (Hofmann et al. Reference Hofmann, Voracek, Bock and Kirchler2017). In contrast, other studies demonstrate that higher-income people exhibit lower compliance because progressive tax schemes affect higher-income earners more substantially (Andreoni et al. Reference Andreoni, Erard and Feinstein1998; Chung and Trivedi Reference Chung and Trivedi2003; Hofmann et al. Reference Hofmann, Voracek, Bock and Kirchler2017). The relationship between educational attainment and tax compliance is also unclear. Some studies show that highly educated people tend to be less compliant because they have an incentive to avoid taxes by utilizing their knowledge and understanding of financial transactions (Hofmann et al. Reference Hofmann, Voracek, Bock and Kirchler2017) and because they are more critical of the state’s actions (Torgler and Schneider Reference Torgler and Schneider2007). However, less educated people are also said to have an incentive to cheat on their taxes because they have a limited understanding of their tax duties or lack financial literacy (Hofmann et al. Reference Hofmann, Voracek, Bock and Kirchler2017).
Several studies show a strong relationship among culture, religiosity, and tax compliance. Culture can significantly affect one’s tax compliance behaviour by shaping the intrinsic motivation to comply (tax morale) as the moral principle or value (Kountouris and Remoundou Reference Kountouris and Remoundou2013). Alm and Torgler (Reference Alm and Torgler2006) suggest that differences in tax compliance behaviour observed across countries is due to differences in citizens’ tax morale. Religiosity can be one potential factor that shapes tax morale because people tend to follow a particular religion’s guidance in forming their preferences (Mueller Reference Mueller2001; Torgler Reference Torgler2006). In addition, religion encourages moral commitments and the internal enforcement of social norms (Anderson and Tollison Reference Anderson and Tollison1992; Torgler Reference Torgler2007).
Tax compliance is also likely to be associated with employment status, because employees generally pay income tax through the withholding system, which minimizes their tax evasion opportunities (Yaniv Reference Yaniv1988). Citizens’ perceptions of the government are also important. Trusted government institutions are likely to encourage many citizens to engage in social cooperation (Kreps Reference Kreps, Alt and Shepsle1990) and thus improve their tax compliance behaviour (Scholz and Lubel Reference Scholz and Lubell1998; Torgler Reference Torgler2007). The level of government institutional quality and trustworthiness certainly explains the variation in tax compliance across countries (D’Attoma Reference D’Attoma2020).
To identify which demographic attributes and socioeconomic characteristics relate to tax evasion or tax noncompliance behaviour, empirical studies have used various methodologies. Torgler (Reference Torgler2007) notes that these methods have mainly consisted of surveys, laboratory experiments, and field experiments. Because tax data are confidential, surveys are popular among researchers (Torgler Reference Torgler2007). Kountouris and Remoundou (Reference Kountouris and Remoundou2013) examine tax morale in Europe using data drawn from the European Social Survey (ESS). Ali et al. (Reference Ali, Fjeldstad and Sjursen2014) utilize data from the Afrobarometer survey for five countries in Africa. Although these surveys enable researchers to analyse tax compliance behaviour empirically in numerous countries, they suffer from issues such as low-response rates and the inaccuracy of the responses due to the sensitive nature of tax compliance, which demotivates people from participating in the surveys (Torgler Reference Torgler2007). Respondents may alter their answers to conform to the acceptable norms in society (Hallsworth Reference Hallsworth2014).
Although laboratory experiments could be used to avoid the bias associated with the sensitive issue of tax compliance, there are concerns about the external validity of this methodology. In the real world, a lot of crucial factors other than those manipulated in experiments might also affect an individual’s decision to comply (Torgler Reference Torgler2007; Hallsworth Reference Hallsworth2014; Mascagni Reference Mascagni2018). Moreover, when respondents are drawn from some specific groups, such as students (Durham et al. Reference Durham, Manly and Ritsema2014; Alm et al. Reference Alm, Bloomquist and Mckee2017), their decisions are not representative of the overall population of taxpayers (Hallsworth Reference Hallsworth2014). To avoid these issues, recent studies have conducted field experiments to investigate how tax compliance behaviour is influenced by a government’s actions, such as social norm letters (Biddle et al. Reference Biddle, Fels and Sinning2018), third-party information (Carrillo et al. Reference Carrillo, Pomeranz and Singhal2017), field inspections (Rincke and Traxler Reference Rincke and Traxler2011), deterrence letters (Shimeles et al. Reference Shimeles, Gurara and Woldeyes2017), and audit paper trails (Pomeranz Reference Pomeranz2015). Field experiments could mitigate the problems encountered in surveys and laboratory experiments, as they use data from real taxpayers, reflecting the decisions they actually make in real life.
To create effective taxation policy, including audit schemes, the government also needs enough information about the characteristics of individuals who engage in tax evasion. Nevertheless, taxation is a sensitive issue for taxpayers, making it generally difficult for the government to obtain precise information about their behaviour, because they may provide false answers or even refuse to answer any questions from the government. To address these problems, we conducted a field survey with an experimental component, a list experiment or an item count technique (ICT), which is an indirect question technique. The list experiment technique protects respondents’ privacy by not requesting that they disclose their answers on sensitive issues. The list experiment questions are designed such that the results show only the number of affirmative answers rather than answers to sensitive questions which are socially undesirable (Corstange Reference Corstange2009; Blair and Imai Reference Blair and Imai2012; Gonzalez-Ocantos et al. Reference Gonzalez-Ocantos, Jonge, Meléndez, Osorio and Nickerson2012). Because of this advantage, list experiments have grown in popularity in the social sciences.
Individual taxation in Indonesia
This study employs Indonesia as the subject country. Indonesia is classified by the World Bank as a lower-middle income country (LMIC), and the country shares common tax-related problems with other LMICs. In fact, Indonesia’s tax-to-Gross Domestic Product (GDP) ratio is relatively small, reaching only 10.3% in 2016. Among the Association of Southeast Asian Nations (ASEAN) member countries, Indonesia is ranked the second lowest, following Myanmar.Footnote 2 Given this situation, the government has set its target for the tax-to-GDP ratio at around 13%–16% during the period of 2031–2035 as a part of the Medium-Term Fiscal Macro Strategy 2020–2024.
This study focuses on taxes on individuals, particularly income tax, among various forms of taxes in Indonesia. Income tax is collected using a self-assessment system. There are two types of individual taxpayers: self-employed individuals and employees. Self-employed individual taxpayers calculate the amount of their own taxes and report it to the tax office. On the other hand, for employees, income tax is calculated and paid by their employers from their salary or wage, using the withholding tax system. At the same time, employees often receive additional income from their own business activities in addition to their salaries or wages. Thus, all employees need to report incomes from their employers, as well as their additional income to calculate the total amount of income tax they owe on their tax returns. However, due to the lack of third party reporting to capture additional incomes from their business activities, taxpayers might not report all of their income on their tax returns, making honesty and willingness to pay taxes crucial for individual tax collection.
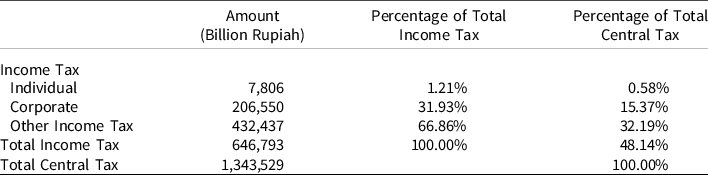
Concerning the administrative structure of the tax authority in Indonesia, the DGT consists of more than 340 tax offices in 34 provinces, which are responsible for collecting central taxes, such as income taxes, value-added taxes, and land and building taxes in four sectors (forestry, plantation, oil and gas, and mining).Footnote 3 According to a report from the government of Indonesia in 2018, individual and corporate income tax revenues represented 1% and 32%, respectively, of total tax revenue in 2017 (see Table 1). The low level of individual income tax revenue has encouraged the tax authority to increase individual tax compliance.
The proportion of individual income tax to total income tax (billion rupiah)

Note: Other income tax includes oil and gas income tax, income tax article 21, 22, 22 import, 23, 26, final income tax, fiscal income tax, and income tax borne by the government.
Source: Central Government Financial Report-Audited.
According to Central Bureau of Statistics of Indonesia, Jakarta is the largest political and commercial city in Indonesia. It also has the highest density of any city in Indonesia, with more than 15,000 people per square kilometre. The population includes a variety of social, ethnic, and religious groups (BPS-Statistics Indonesia 2018). The amount of tax revenue collected in Jakarta is much larger than in other provinces. According to the DGT, 18.5% of total central tax revenue in 2017 was collected from taxpayers located in this city. Jakarta consists of six regencies and 44 subdistricts, and 54 tax offices cover these areas. Our study area is the Jatinegara subdistrict of Jakarta province. According to BPS-Statistics of Jakarta Timur, Jatinegara subdistrict consists of eight villages with 310,494 people living in a 10.25 square kilometre area. The land-use is mainly for housing, which occupies 71.12% of the area, and the land-use for industry is around 5.19% of total land-use. This means that few industries operate in this subdistrict. On the other hand, there are 116 markets, including traditional markets and restaurants, indicating that trade in goods and services is the main business activity in this subdistrict.
Empirical analysis
List experiment
This study employed a list experiment or ICT to mitigate respondents’ social desirability bias when eliciting information about sensitive issues. To conduct a list experiment, respondents were randomly separated into two groups: the control group and the treatment group. Respondents were presented a list of statements and then asked to report how many statements on the list pertain to them. The list of statements shown to the respondents in the control group consisted of four statements (we call them “control statements”) that are not directly related to our research interest.Footnote 4 The list of statements shown to the respondents in the treatment group composed of five statements, adding one statement (we call it a “treatment statement”) that directly related to our research interest. The treatment statement might invite a social desirability bias, but with a large enough sample size, this design enabled us to estimate the proportion of respondents to whom the treatment statement of interest pertained. It is calculated by subtracting the average number of statements reported by the respondents in the control group from the average number of statements reported by the respondents in the treatment group. Arranging the statements in this way ensured a level of privacy for the respondents in the treatment group because whether or not the treatment statement pertained to them cannot be inferred by the researchers, unless they chose either all of the statements or none of them.
To reiterate, the objective of our study was to elicit taxpayers’ attitudes towards tax compliance. By conducting a list experiment, we attempted to estimate the proportion of taxpayers who had reported an amount for their income on their income tax forms lower than their actual income. There were four control statements and one treatment statement. The treatment statement was the item directly related to the respondent’s tax compliance behaviour. We randomly separated our respondents into two groups: a treatment group and a control group. Only the first four control statements were presented to respondents in the control group, and all five statements were presented to respondents in the treatment group. The order in which statements were presented was completely randomized across respondents to minimize the possibility of any order effect. After presenting a list of these four or five statements, we specifically asked each respondent to identify how many statements apply to her/him.Footnote 5 The exact wordings of these statements are as follows:
Control statements
-
I have more than one sister.
-
I have paid a bribe to a police officer to get away with violation.
-
I went to a private high school.
-
I talked about politics with other people during the previous election.
Treatment statement
-
I have reported an amount lower than my actual income in my tax report.
We used the unique list of all taxpayers obtained from the tax office in the Jatinegara subdistrict of Jakarta province to conduct our list experiment.Footnote 6 This list includes 121,330 individual taxpayers in the district. Among those taxpayers, we excluded noneffective taxpayers, nonfiling taxpayers, and taxpayers without the information of their phone numbers.Footnote 7 This leaves us a total of 14,428 taxpayers who have submitted their tax returns from 2013 to 2017. Using the final list of the taxpayers, we implemented a survey including our list experiment question using CATI from January 2019 to March 2019, and we collected responses from a total of 879 taxpayers (the response rate is 6%).Footnote 8 In the survey, we also asked for additional information about respondents’ demographics and socioeconomic status, such as age, gender, income, ethnicity, religion, educational level, and employment status.
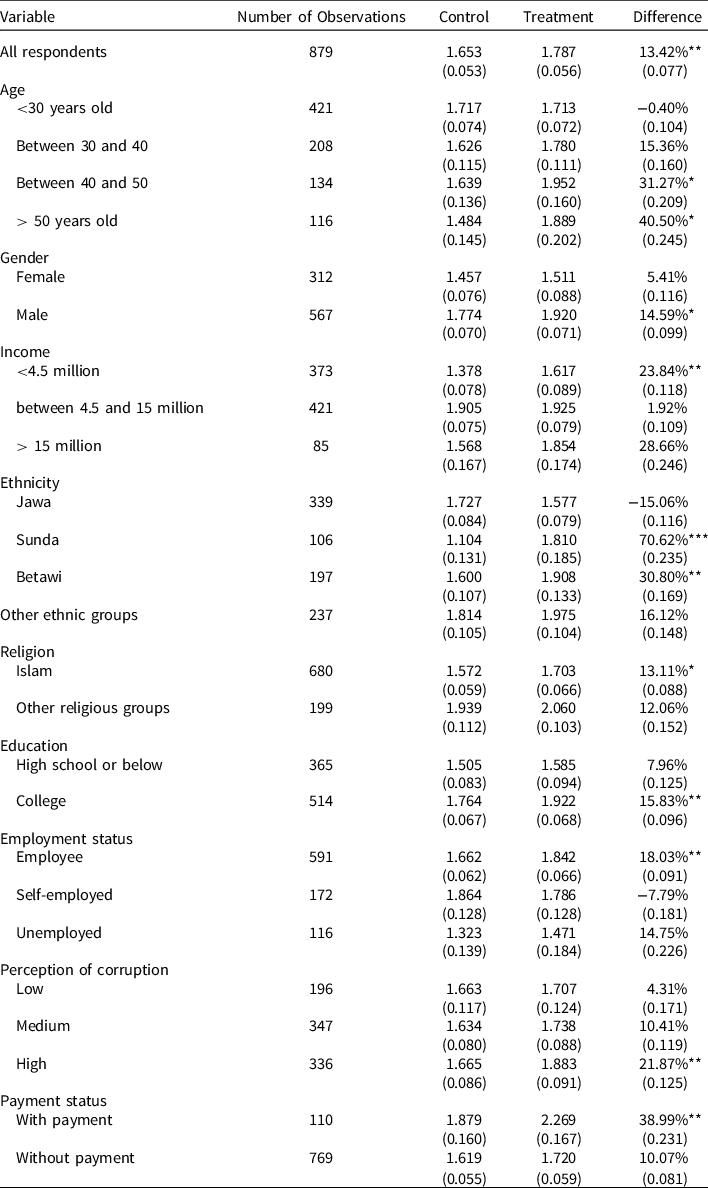
Results
Table 2 presents the results of the univariate analysis of the list experiment. We found a statistically significant difference between the treatment and control groups in their responses at the 5% level.Footnote 9 The results show that 13.42% of taxpayers have reported lower income than their actual income to the tax office.Footnote 10 Concerning individual characteristics, our univariate analysis indicates several results. First, attitudes towards tax compliance differ across generations. Older people tend to exhibit lower tax compliance behaviour, with 31.3% of respondents aged 40–50 years and 40.5% of respondents aged 50 or above having engaged in tax evasion. These results are consistent with the findings of Russo (Reference Russo2013) in Italy that people aged 60 or above exhibit low-compliance behaviour, partly due to their dissatisfaction with public services. Second, tax compliance behaviour also differs between men and women, with 14.6% of male respondents having engaged in tax evasion, whereas only 5.41% of female respondents did so. Men tend to exhibit lower compliance than women, as suggested in multiple studies, including Barber and Odean (Reference Barber and Odean2001), Batrancea et al. (Reference Batrancea, Nichita, Olsen, Kogler, Kirchler, Hoelzl, Weiss, Torgler, Fooken, Fuller, Schaffner, Banuri, Hassanein, Alarcon-Garcia, Aldemir, Apostol, Weinberg, Batrancea, Belianin, Gomez, Briguglio, Dermol, Doyle, Gcabo, Gong, Ennya, Essel-Anderson, Frecknall-Hughes, Hasanain, Hizen, Huber, Kaplanoglou, Kudla, Lemoine, Leurcharusmee, Matthiasson, Mehta, Min, Naufal, Niskanen, Nordblom, Ozturk, Pacheco, Pantya, Rapanos, Roland-Levy, Roux-Cesar, Salamzadeh, Savadori, Schei, Sharma, Summers, Suriya, Tran, Villegas-Palacio, Visser, Xia, Yi and Zukauskas2019), Brockmann et al. (Reference Brockmann, Genschel and Seelkopf2016), and Hofmann et al. (Reference Hofmann, Voracek, Bock and Kirchler2017). Third, low-income respondents tend to engage in tax evasion. Among respondents whose income was below 4.5 million rupiahs, 23.8% underreported their income on their tax returns. One possible reason may be that low-income people can more easily cheat on their taxes because they suffer financially more than rich people do (Hofmann et al. Reference Hofmann, Voracek, Bock and Kirchler2017).
Difference-in-means results by various subgroups
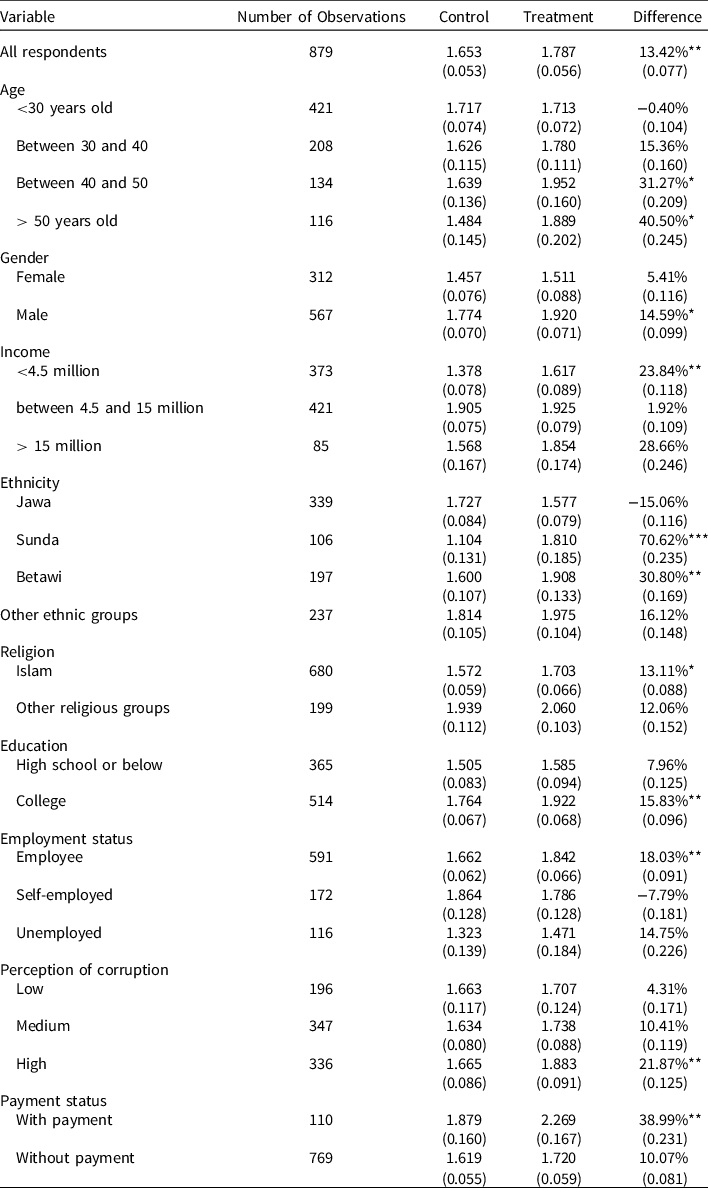
Notes: Standard errors are in parentheses.
***p < 0.01, **p < 0.05, *p < 0.10.
Fourth, a significant negative correlation exists between educational attainment and tax compliance behaviour. Among respondents with college education, 15.8% disclosed that they had cheated on their taxes. These people may be able to utilize their knowledge to minimize or avoid their tax liability (Hofmann et al. Reference Hofmann, Voracek, Bock and Kirchler2017). Fifth, 18.0% of employees who were working in private and public organizations engaged in tax evasion. Employees are generally under the tax withholding system in which their tax is deducted from their salaries. Our results imply that some employees have additional income from other sources, but they do not report it to the tax office. Sixth, we examined the roles of respondents’ culture and religion, because they are expected to be correlated to tax compliance behaviour (Lago-Penas and Lago-Penas Reference Lago-Penas and Lago-Penas2010; Kountouris and Remoundou Reference Kountouris and Remoundou2013; Russo Reference Russo2013). Specifically, we considered four ethnic groups (Jawa, Sunda, Betawi, and a category specified as “other ethnic groups” in the survey) and two religious groups (Islam and a category specified as “other religious groups”).Footnote 11 The results show that Sundanese and Muslims tend to engage in low-tax compliance behaviour.
Seventh, Kirchler et al. (Reference Kirchler, Hoelzl and Wahl2008) and Torgler (Reference Torgler2007) examine the effects of people’s trust in government on their tax compliance behaviour, because the perception of corruption in government institutions discourages them from paying tax. Consistent with these studies, our analysis reveals that respondents who perceive a higher level of corruption in government (i.e. they have lower levels of trust in government) are more likely to cheat on their income tax. Finally, our survey sample was drawn from the population of those who have filed tax returns at least once in the past five years. This implies that it includes people who have no actual income to report on their tax returns and those who have never had an opportunity to cheat on their tax reports due to tax withholding by their employers. These people are less likely to select the sensitive item indicating tax evasion in their responses to our list experiment question. The results show that only 10.1% of people revealed that they have engaged in tax evasion among those who have no tax payments on their reports, whereas among those who have paid some amount of tax at least once in the past five years (not through the withholding scheme but directly to the tax office), 39.0% of people have engaged in noncompliance.
Multivariate analysis
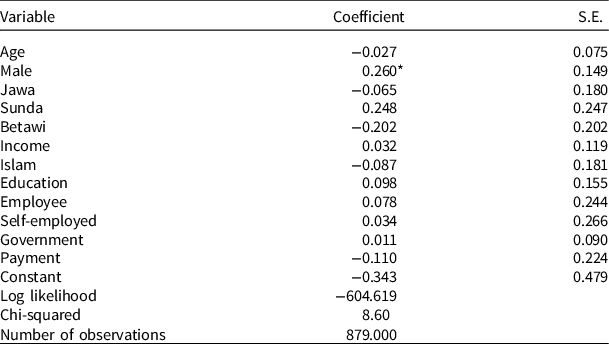
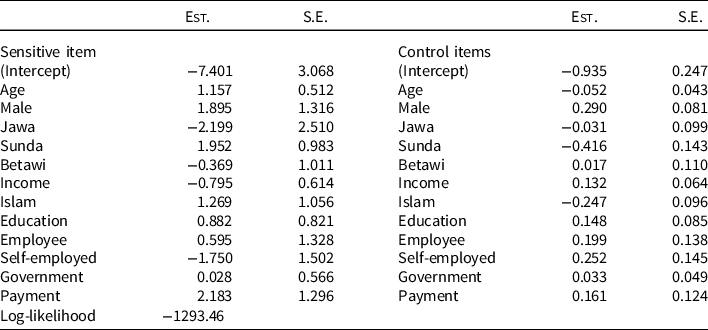
The univariate analysis captures the difference-in-means for each group separately without considering overlap in the group memberships. This analysis uses data inefficiently. To overcome these issues, we conduct a multivariate analysis, which basically generalizes the difference-in means approach by modelling the joint distribution efficiently to allow for control for multiple variables concurrently. We apply maximum-likelihood models with the constrained version of the estimator, assuming that the addition of the sensitive item does not influence the answers concerning the control items (Imai Reference Imai2011; Blair and Imai Reference Blair and Imai2012).Footnote 12 The estimated coefficients together with standard errors are shown in Table A2.Footnote 13
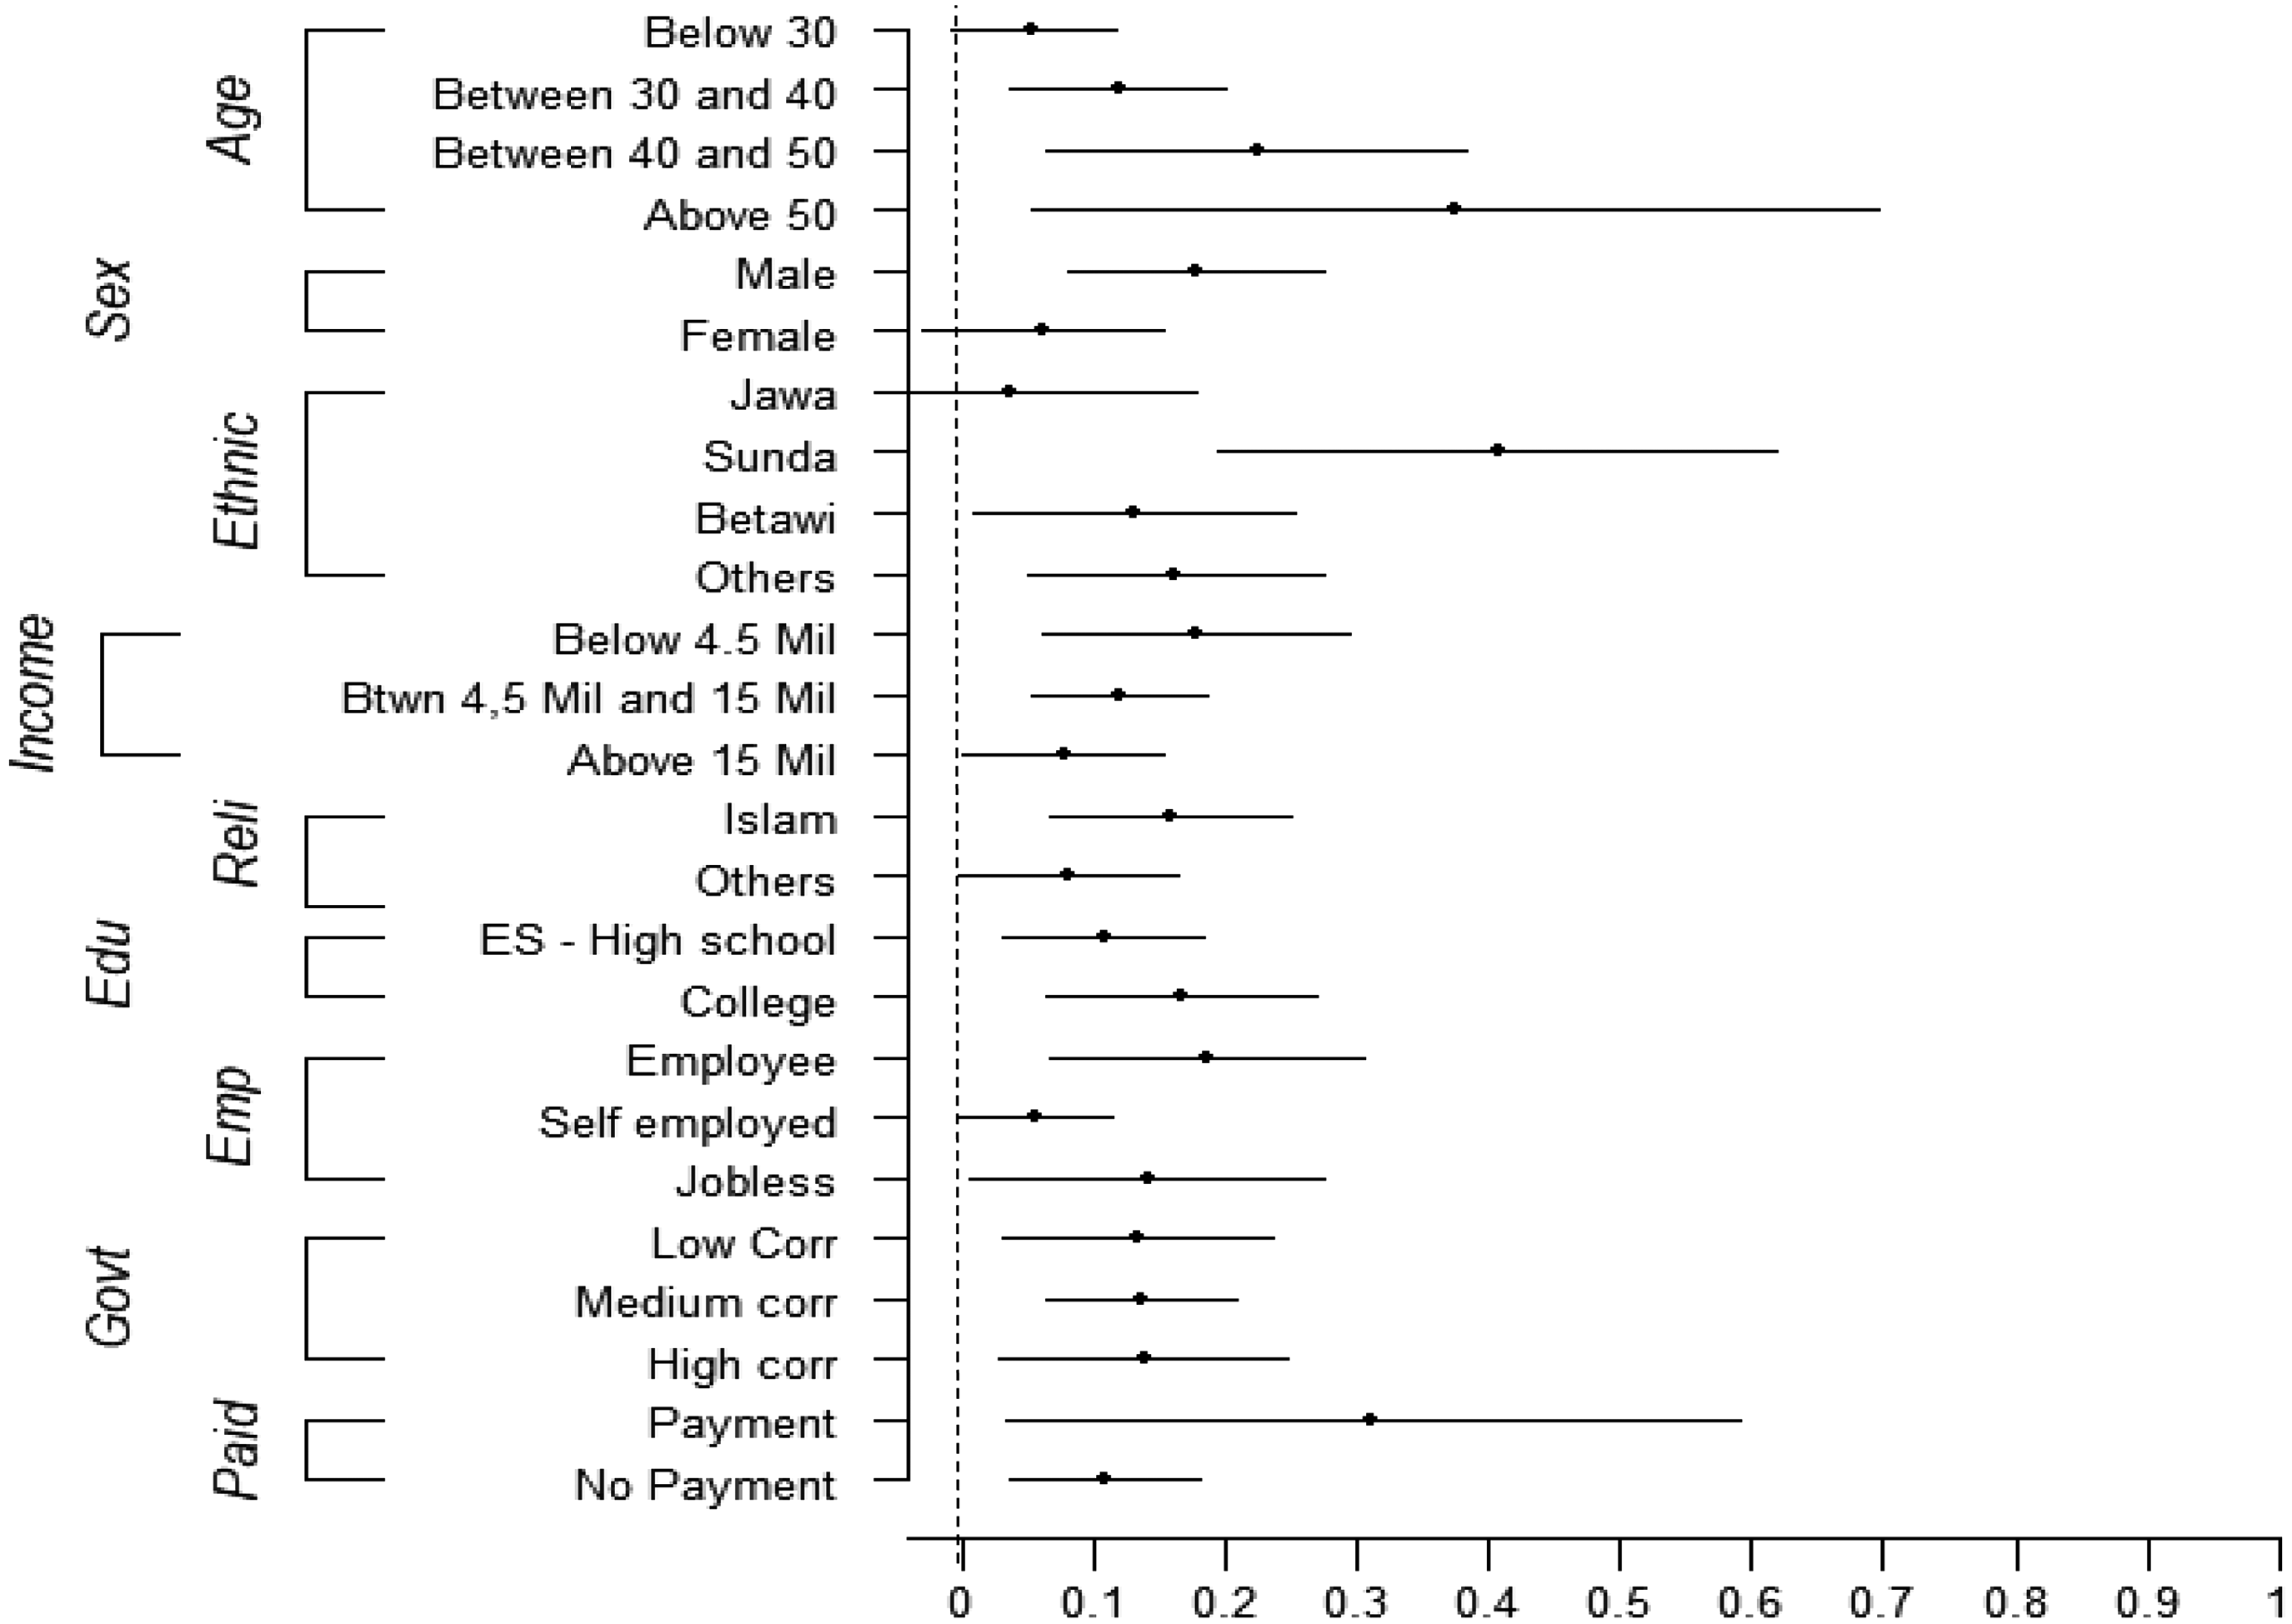
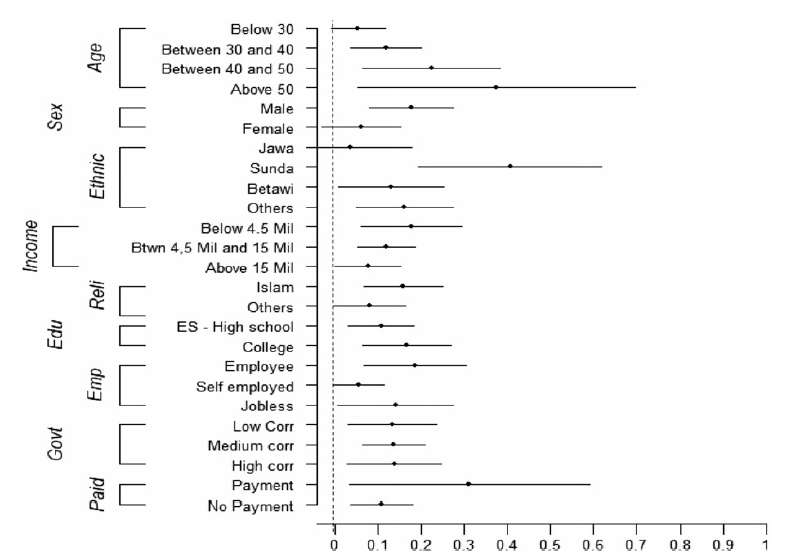
Figure 1 illustrates the estimated proportions of respondents cheating on their taxes by reporting less income than they actually earned. The coefficients for several variables are consistent with the findings in our univariate analysis discussed in the previous subsection. First, we continue to find a tendency that older people, especially respondents in the age group between 40 and 50 years old, engage in tax evasion more than do those in the age group below 30 years old. The difference between these age groups is statistically significant at the 5% level. Second, our multivariate findings on gender are consistent with our univariate findings. Men engage more in tax evasion than women do, with an estimated difference of 11.6% points, which is marginally significant at the 10% level. Third, there are significant differences between ethnic groups in tax evasion. The proportion of Sundanese engaging in tax evasion is higher than those of Jawa and Betawi respondents, with estimated differences of 36.9% and 27.5% points, respectively. These differences are statistically significant at the 5% level. Fourth, we also find that employees engage in more tax evasion than self-employed individuals do, with an estimated difference of 12.9% points. It is also statistically significant at the 5% level.
Multivariate estimates of tax noncompliance.
Notes: The dots estimated proportions of respondents engage in tax noncompliance, and the lines show the 95% confidence intervals from the regression model in Table A2. The vertical axis shows respondents’ attributes.

On the other hand, some results in the multivariate analysis are less clear compared to those in the univariate results. The univariate analysis suggests that the group of respondents with income below 4.5 million rupiahs engage in more tax evasion than the group of higher income respondents. However, the estimated differences across income levels disappear in the multivariate results. In addition, although the univariate analysis also shows that Muslims and people with college education or higher tend to engage more frequently in tax evasion, the multivariate results indicate no clear evidence of differences across religious groups or education levels. Moreover, the univariate analysis shows that people with a perception of high corruption tend to engage more frequently in tax evasion, but the multivariate analysis does not confirm that tax evasion behaviour depends on the perception of corruption. Furthermore, the univariate analysis shows that people who have paid some amount of tax directly to the tax office at least once in the past five years tend to engage more frequently in tax evasion than do those who have never done so, but the difference between the two groups is not statistically significant in the multivariate analysis, partly due to the small sample size of the former group of people.
Conclusion
Tax evasion is a sensitive problem at the individual level. Because taxpayers have a motivation to hide their tax evasion behaviour, identifying their true behaviour can be a crucial challenge for researchers as well as tax regulators. This is related to social desirability bias, in which respondents attempt to answer survey questions in a socially desirable or acceptable manner, instead of revealing their actual opinions or behaviour. In the context of taxation, this bias emerges when taxpayers pretend to meet their own obligations by underreporting their incomes to the tax office. To identify the characteristics of taxpayers who engage in tax evasion behaviour, this study mitigated the influence of social desirability bias by conducting a list experiment in Jakarta, Indonesia. The univariate analysis revealed that 13.4% of taxpayers have cheated on their taxes by underreporting their income on their tax returns. The results also uncovered clear evidence that tax evasion behaviour varies depending on individual characteristics, such as age, gender, ethnicity, and employment status. The multivariate analysis generally confirmed the findings from the univariate analysis, though some differences found in the univariate analysis (such as those between religious groups and education levels) disappeared in the multivariate analysis.
In a developing country like Indonesia, the percentage of taxpayers who actually cheated on their taxes may be larger than estimated in this study because of weak auditing capacity and legal system.
Our list experiment outcomes may still underestimate the proportion of taxpayers who have engaged in tax evasion behaviour. In a developing country like Indonesia, the percentage of taxpayers who actually cheated on their taxes could be larger than estimated in this study because of weak auditing capacity and legal system. However, we believe that our study has important implications for taxation policy because our results help identify potential targets for tax auditing to overcome the issue of a government’s limited institutional capacities. For instance, in Indonesia, tax offices identify potential targets of auditing mostly on an ad hoc, not a systematic, manner by merely comparing a particular tax return to others from a similar business environment. Because such an ad hoc monitoring scheme does not take into account the characteristics of individual taxpayers, tax offices are likely to fail to detect many taxpayers engaging in tax evasion behaviour.
The Indonesia State Budget 2019 emphasizes that the tax authority (DGT) needs to raise tax revenue by broadening the tax bases and also by improving tax compliance sustainability. The Minister of Finance points out the importance of effective tax auditing to increase tax revenue to the required level for supporting the country’s development.Footnote 14 It is important for tax offices to identify what types of taxpayers are more likely to engage in tax evasion and to establish appropriate measures to tackle tax evasion through tax auditing. Given that our results indicate that taxpayers who are old, male, corporate employees, and members of a certain ethnic group tend to exhibit relatively low tax compliance, one possible tax policy could be for the DGT to cluster these groups of taxpayers as potential targets for tax auditing. However, the DGT currently does not have all the necessary information on individual taxpayers due to constraints on its taxpayer database and administrative capacities. To address this practical limitation, the DGT needs to collect the necessary information on individual taxpayers by changing its taxpayer database structure and administrative management while at the same time carefully protecting taxpayers’ privacy.
We believe that the relationship between tax evasion and individual characteristics found in our study would be useful information for both researchers and tax authorities who are interested in designing effective tax policies and auditing schemes to improve governance and revenue collection. At the same time, the ethical issues involved in targeting specific groups in the tax auditing process are also a matter of concern. The government and tax authorities need to be aware of these and set clear rules for the implementation of auditing and the appropriate handling of personal data.
Data Availability Statement
Replication materials are available in the Journal of Public Policy Dataverse at https://doi.org/10.7910/DVN/QW1JXG.
Acknowledgement
The authors would like to thank the editors and the reviewers for their thoughtful comments on this article, and to gratefully acknowledge financial support from Indonesia Endowment Fund for Education.
APPENDIX
Logit model test of balance in randomization

Notes: The dependent variable is the indicator of whether the respondent was assigned to the treatment group.
*p < 0.1.
Multivariate regression results (maximum likelihood constrained model)

Note: The outcome variable is whether a respondent reports income lower than actual one.
Percentage of respondents for each answer category in the list experiment.
Note: Respondents were asked to report the number of statements that apply to them in the range of zero to four (in the case of control group shown in gray) or zero to five (in the case of treatment group shown in black).