Introduction
With the proportion of elderly individuals continuing to grow in developed countries, there has been a corresponding increase in older patients seeking medical attention for voice-related problems.Reference Roy, Stemple, Merrill and Thomas1 As with other physiological processes, voice production is similarly subject to some deterioration. This is due to natural anatomical changes that occur over time, resulting in the catch-all condition known as presbyphonia, or literally ‘aged voice’. Common symptoms of presbyphonia include vocal roughness, breathiness, difficulty projecting and increased vocal effort leading to fatigue. Direct visualisation and pathological examination may reveal atrophied and misshapen vocal folds, and weakening of adjacent soft tissue.Reference Von Leden, Alessi, Benninger, Jacobson and Johnson2 These changes are suspected to result from alterations throughout the larynx, including muscle atrophy, calcification of supporting cartilage, changes in the extracellular matrix, decreased mucosal integrity and secretions, and decreased neuromuscular control.Reference Martins, Pessin, Nassib, Branco, Rodrigues and Matheus3
The loss of skeletal muscle with ageing is known as sarcopenia, and it is characterised as gradual loss of muscular mass and functional impairment.Reference Jang and Van Remmen4, Reference Nair5 This can be caused by muscle misuse and disuse, and by nutritional, metabolic and genetic events.Reference Jang and Van Remmen4, Reference Kirkeby and Garbarsch6 This same process is suggested to contribute to atrophy of the thyroarytenoid muscles, which are major structural components of the vocal folds and voice production.Reference Martins, Pessin, Nassib, Branco, Rodrigues and Matheus3
While it is presumed that this process is responsible for presbyphonia, there are very few quantitative studies specifically examining the extent of thyroarytenoid muscle atrophy in the elderly. Amongst those that exist, there are conflicting data regarding intrinsic laryngeal muscle atrophy in cadaveric and animal study models.Reference Yamauchi, Imagawa, Sakakaibara, Yokonishi, Ueha and Nito7 A very small number of studies have used computed tomography (CT) and magnetic resonance imaging (MRI) to support the atrophy of muscles involved in vocal fold movement in patients with concomitant nerve pathology;Reference Kwong, Boddu and Shah8–Reference Romo and Curtin10 and some imaging studies specifically discuss thyroarytenoid muscle atrophy.Reference Ziade, Semaan, Fakhri, El Natout and Hamdan11–Reference Thomas, Harrison and Stemple14
The impetus for the present study was the relative lack of objective data describing the thyroarytenoid muscle volume in a population of living adults without neuropathy and discussing how this quantity changes with age. We therefore used MRI volumetric analysis to assess whether there are age-related changes to thyroarytenoid muscle volume in a cohort of patients with otherwise normal larynges.
Materials and methods
Patient selection
This project was approved by the Institutional Review Board of the University of Miami Miller School of Medicine.
Analysis was conducted on all imaging studies conducted between January 2014 and December 2016 via Montage (Nuance Communications, Burlington, Massachusetts, USA), the University of Miami Picture Archiving and Communications System search engine. The following Current Procedural Terminology codes were used: 70540, 70542, 70542 (MRI of orbit, face and neck – without contrast, with contrast, and with/without contrast, respectively) and 72141, 72142, 72156 (MRI cervical spine – without contrast, with contrast, and with/without contrast, respectively).
The initial cohort included all male and female subjects who were aged 18 years or older at the time of imaging. Subjects were then excluded if there was any evidence of disease that could affect laryngeal function, including: vocal fold paralysis, laryngeal tumours, recurrent respiratory papillomatosis, vocal fold polyps, skull base cancer, superior mediastinal cancer, prior radiotherapy, prior thyroid surgery, tracheostomy, history of sepsis, prolonged intubation, autoimmune or metabolic disorders, Parkinson's disease, amyotrophic lateral sclerosis, or other neuromuscular disorders. Technically suboptimal MRI studies with limited evaluation of the larynx were also excluded from analysis.
A total of 111 patients were included and were stratified into three age groups: 18–50 years, 51–64 years and 65 years or older. The cut-off of 65 years was chosen based on its common use in defining elderly subjects.15 Further analysis was performed on gender-stratified subgroups, given the smaller average volume of the thyroarytenoid muscle in female patients, to ensure that small differences were not missed in the larger, mixed gender group.
Imaging analysis
All images were obtained in the clinical routine investigation for various indications by using a Siemens Symphony 1.5 Tesla MRI Scanner. Scans were obtained in 3–4 mm slice thickness. Images were exported to Aquarius (Terarecon, Foster City, California, USA), a three-dimensional imaging analysis program. The vocal folds were traced in an axial plane by region of interest on multiple slices, to generate volumes for the right and left thyroarytenoid muscles separately. Tracings were made via areas of enhancement from the anterior commissure to the vocal process of the arytenoid cartilage in the anteroposterior dimension, and the width included the medial and lateral edges of the enhancing muscle. For uniformity, all measurements were performed using T1-weighted images without contrast.
Statistical analysis
Frequencies and proportions were used to summarise categorical variables. Means and standard deviations (SDs) were used to describe the true vocal fold volume stratified by age group and side of body. Ninety-five per cent confidence intervals (CIs) were also constructed for the mean volumes for comparisons. Intra- and inter-rater reliabilities were determined using intraclass correlation co-efficients, with 95 per cent CIs defined by the value of the co-efficient multiplied by its standard error. All analyses were performed using SAS statistical software version 9.4 (SAS Institute, Cary, North Carolina, USA).
Results
Demographic data
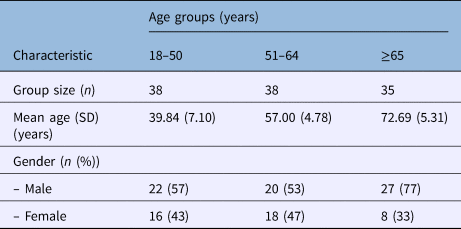
In the group aged 18–50 years, the mean age was 39.84 years (SD = 7.10), with an age range of 25–50 years. There were 22 male patients and 16 females in that group. In the group aged 51–64 years, the mean age was 57 years (SD = 4.78), with an age range of 51–64 years. That group comprised 20 male patients and 18 females. In the group aged 65 years or older, the mean age was 72.69 years (SD = 5.31), with an age range of 65–89 years. There were 27 male patients and 8 females in that group (Table 1).
Demographic data for the three age groups

SD = standard deviation
Statistical findings
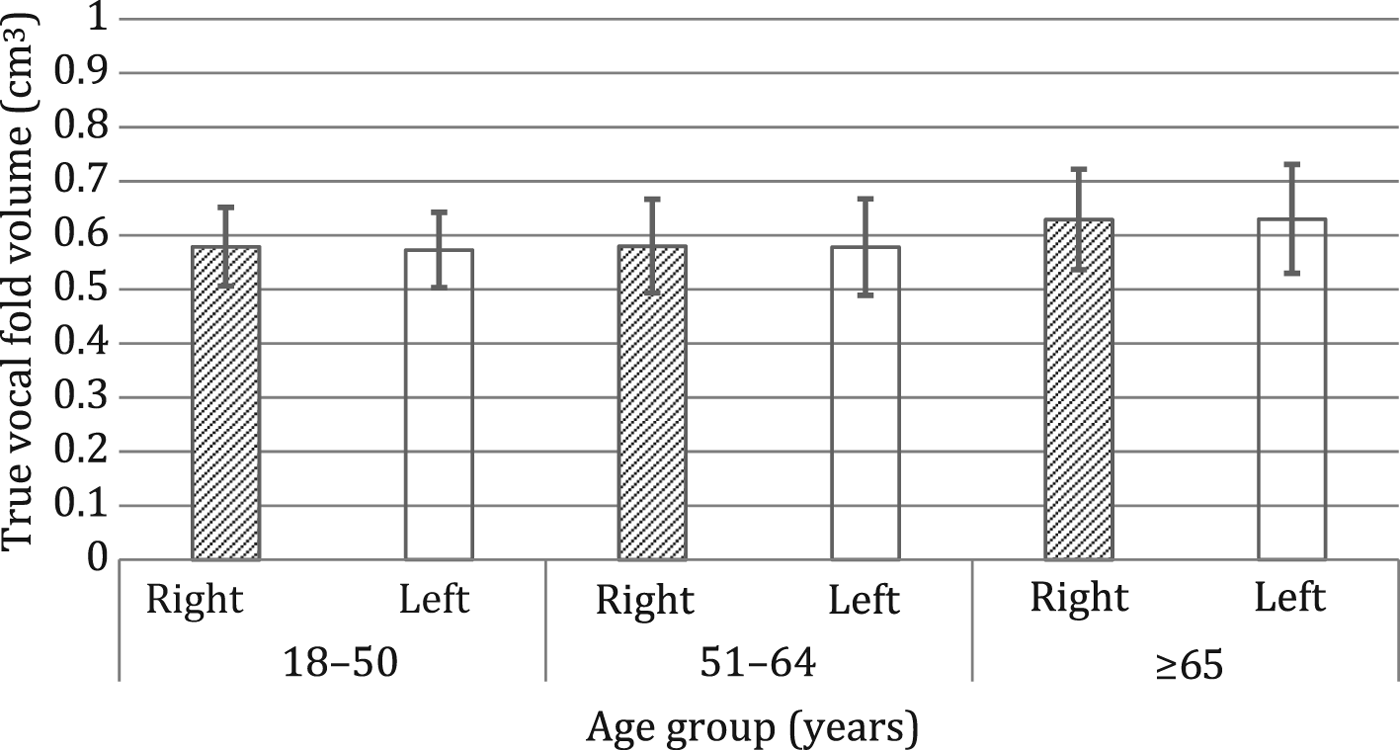
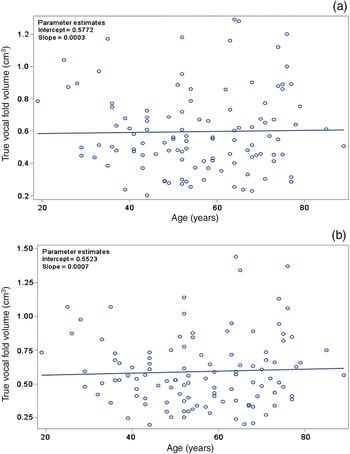
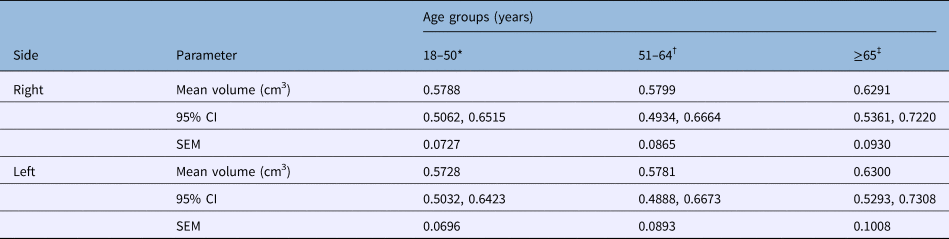
The mean volumes of the right and left thyroarytenoid muscles were 0.5788 cm3 and 0.5728 cm3 in patients aged 18–50 years, 0.5799 cm3 and 0.5781 cm3 in patients aged 51–64 years, and 0.6291 cm3 and 0.6300 cm3 in patients aged 65 years or above, respectively. The volume of the thyroarytenoid muscle remained relatively consistent across all age groups, with a lack of statistically significant difference when examining the association between thyroarytenoid muscle volume and age (Table 2, Figure 1). A weak positive relationship between age and thyroarytenoid muscle volume was demonstrated via scatter plot (Figure 2).
True vocal fold volume by age groups and sides.

Scatter plot (regression line with slope and intercept) showing a very weak positive correlation between age and thyroarytenoid muscle volume for (a) right and (b) left sides.

Right and left thyroarytenoid muscle volumes in all patients

*n = 38; †n = 38; ‡n = 35. CI = confidence interval; SEM = standard error of the mean
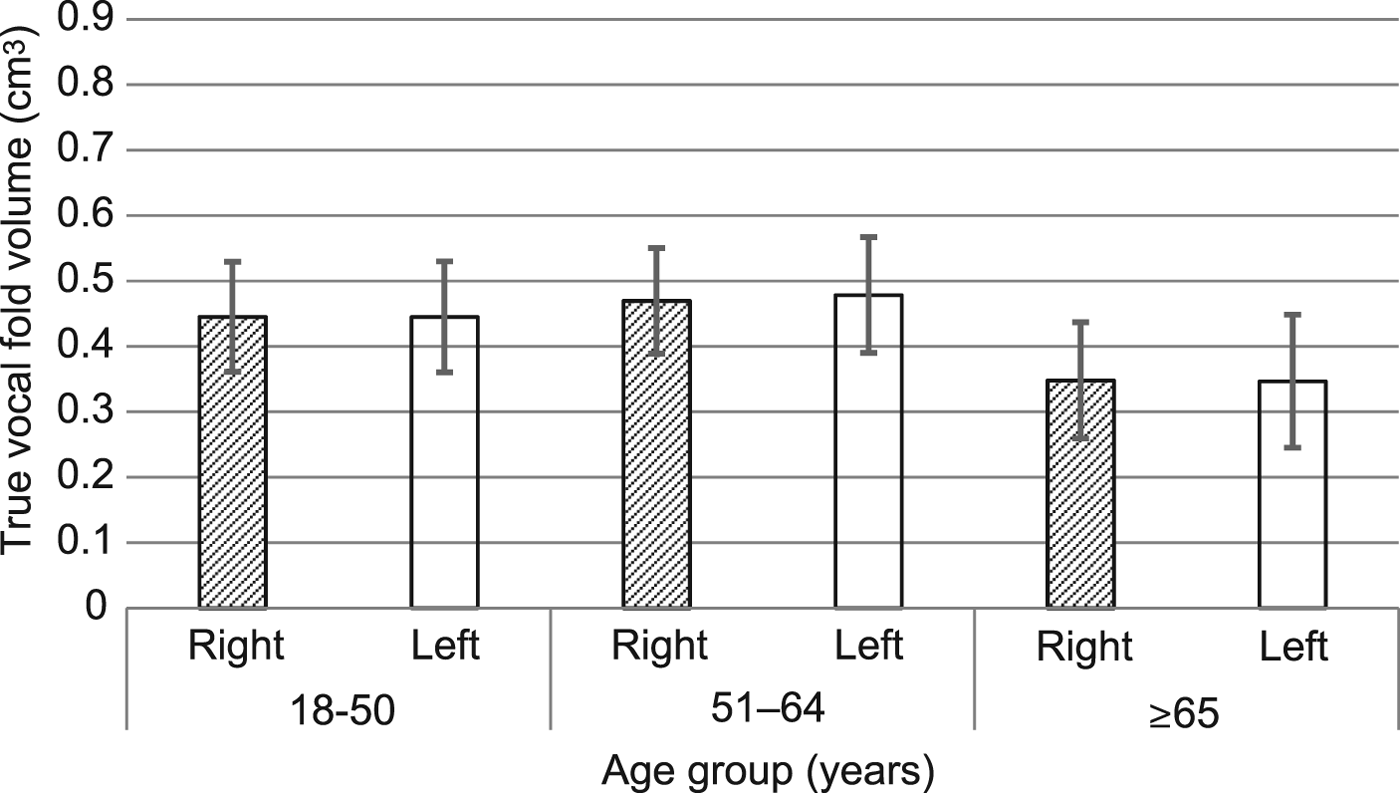
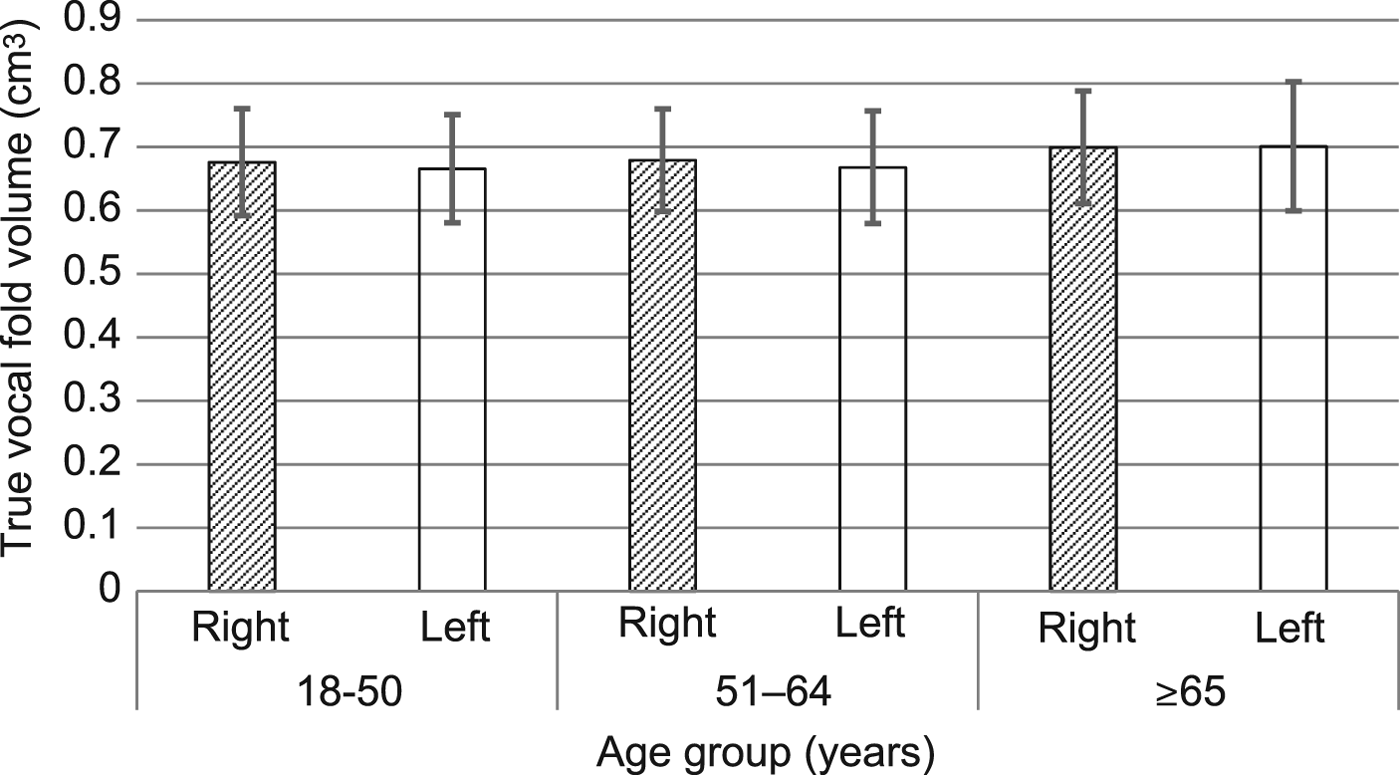
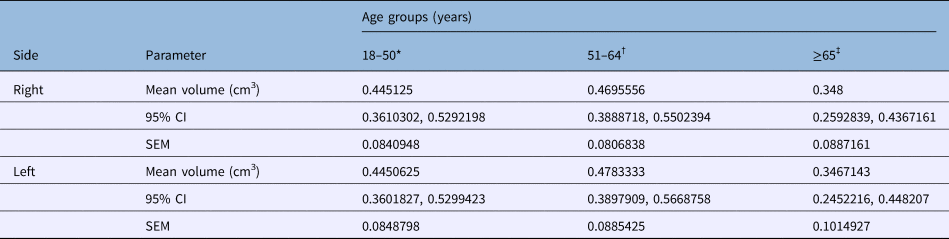
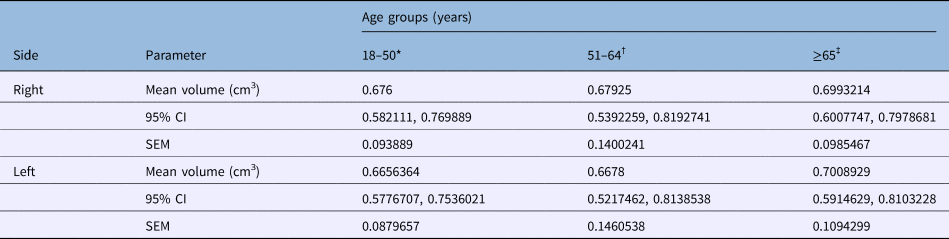
The thyroarytenoid muscle volume remained consistent across all age groups when considering men alone and women alone, with a lack of statistically significant difference between muscle volume and age (Tables 3 and 4, Figures 3 and 4). A weak relationship between age and thyroarytenoid muscle volume amongst men alone and women alone was also demonstrated via scatter plot (data not shown).
True vocal fold volume in female patients categorised by age groups and sides.

True vocal fold volume in male patients categorised by age groups and sides.

Right and left thyroarytenoid muscle volumes in female patients

*n = 16; †n = 18; ‡n = 7. CI = confidence interval; SEM = standard error of the mean
Right and left thyroarytenoid muscle volumes in male patients
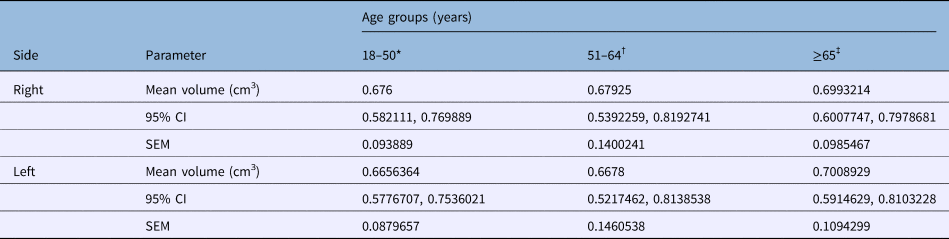
*n = 22; †n = 20; ‡n = 28. CI = confidence interval; SEM = standard error of the mean
All intra- and inter-rater analyses showed excellent reliability (intraclass correlation co-efficient > 0.90), suggesting minimal difference between raters and good consistency of each individual rater.
Discussion
The process of age-related skeletal muscle changes is well described for many areas of the body, but the picture is less clear as to how these may affect the laryngeal muscles. Sarcopenia may result from a number of factors, including reduction in the axon terminal area, changes in synaptic structural architecture, increases in mitochondrial abnormalities,Reference Thomas, Harrison and Stemple14 and narrowing of capillaries and small vessels resulting in morphological and functional changes.Reference Bearden16
Similar to the ageing process that occurs in skeletal muscle elsewhere in the body, the laryngeal structures undergo various modifications with ageing: cartilage calcification, decreased neuromotor transmission speed, reduced number of mucous glands, decreased elastic fibres in the lamina propria, increased collagen fibres, epithelial atrophy, decreased hyaluronic acid concentration, and suspected atrophy of the intrinsic and extrinsic muscles.Reference Kendall17 However, the thyroarytenoid muscle ageing process seems to differ compared with other skeletal muscles and is a significant point of controversy.Reference Thomas, Harrison and Stemple14 Most notable is the inconsistency seen in the literature regarding the loss of type I versus type II fibres in the thyroarytenoid muscle.Reference Ziade, Semaan, Ghulmiyyah, Kasti and Handan13 One study by Malmgren et al. examined 28 larynges from subjects aged 26–97 years, and found a selective loss of type I fibres with age. The authors also noted a trend towards compensatory hypertrophy of the remaining type I fibres.Reference Malmgren, Fisher, Bookman and Uno18 This could explain our findings of persistence in volume, which could occur despite the loss of different types of fibres within the thyroarytenoid muscles.
In an animal study, Nishida et al. compared the number and diameter of laryngeal intrinsic muscle fibres, examined contractile protein composition, and performed quantitative analysis of subneural apparatuses in adult and aged Wister rats.Reference Nishida, Taguchi, Motoyoshi, Hyodo, Gyo and Desaki19 In elderly rats, there was a significant decrease in the diameter and number of cricothyroid muscle fibres, and a decrease in the number but not the diameter of the thyroarytenoid muscles. No decrease was observed in the number or diameter of posterior cricoarytenoid muscle fibres. These results appear to show a relative susceptibility of the cricothyroid muscle to the effects of ageing, as compared to the posterior cricoarytenoid and thyroarytenoid muscles.
A study by Ziade et al. examined thyroarytenoid muscle uptake in CT-fused fluorodeoxyglucose (18FDG) positron emission tomography (PET/CT), and found no significant difference in uptake between subjects older than and younger than 65 years old.Reference Ziade, Semaan, Fakhri, El Natout and Hamdan11 However, on CT, there was a decrease in attenuation of the thyroarytenoid muscle, as measured in Hounsfield units, between these two age groups, suggesting that there may be measurable metabolic differences associated with ageing. Nevertheless, this was contradicted by the unchanged 18FDG uptake on PET scanning and does not completely support the presence of thyroarytenoid muscle atrophy. The same author group also recently published a study examining thyroarytenoid muscle volume via MRI, which revealed no significant size difference between 40 patients aged under 65 years and 40 patients aged 65 years or older.Reference Ziade, Semaan, Ghulmiyyah, Kasti and Handan13
In senescent vocal folds, there is characteristic disruption of the extracellular matrix, including reduction of hyaluronic acid, resulting in decreased vocal fold volume and commonly experienced symptoms of presbyphonia.Reference Branco, Rodrigues, Fabro, Fonseca-Alves and Martins20 While there is strong literature support for changes in the extracellular matrix contributing significantly to the symptoms and appearance of the vocal folds in presbyphonia, much remains to be elucidated about the pathophysiology of the thyroarytenoid muscle itself in both this disease entity and in presumably healthy larynges. This prompted the present study to search for objective evidence of age-related changes to the thyroarytenoid muscle.
We found no statistically significant difference in thyroarytenoid muscle volume across any of the studied age groups, suggesting that the thyroarytenoid muscles may not be as susceptible to atrophy as previously thought. At face value, this makes a certain degree of sense, as the thyroarytenoid muscles are under continuous daily use, and, barring nutritional deficiency and protein wasting, they should not generally be subject to sarcopenia. Therefore, while atrophy may be observed to exist in certain patients, this may not be a widespread phenomenon in the elderly population. One might further postulate that the common, characteristic symptoms of presbyphonia may therefore not be due to atrophy of the thyroarytenoid muscle, but instead to the many changes that have been proven to occur in the extracellular matrix. On a practical level, this finding could guide clinical treatment of patients with presbyphonia away from paraglottic space augmentation and towards revitalisation of the lamina propria, though there is literature support for both methods.Reference Rosen, Gartner-Schmidt, Casiano, Anderson, Johnson and Remacle21–Reference Ohno, Hirano, Yasumoto, Ikeda, Takebayashi and Miura26
This retrospective study is necessarily limited by selection bias, the absence of subjective and objective voice measurements, and a lack of knowledge of any phonatory behaviour or co-morbid medical problems that might have affected vocal function and imaging analysis. There is also the question of whether the study has actually determined a negative finding, or whether a larger sample size is necessary to detect a difference between the age groups. Additional volumetric research is needed to examine the differences between healthy elderly controls and patients with known presbyphonia, to determine whether atrophy of the thyroarytenoid muscle contributes in any meaningful way to this condition.
• Presbyphonia is a growing worldwide problem, though pathophysiology is somewhat unclear
• Proposed mechanisms include sarcopenia in thyroarytenoid muscles and changes to lamina propria
• Science and clinical research findings conflict: some studies show muscle atrophy in aged larynges, others show no atrophy
• A few imaging studies have assessed possible thyroarytenoid muscle volume decreases as a function of age, with recent studies showing no atrophy
• The present study, with a larger patient cohort and age stratification, showed no difference in thyroarytenoid muscle volume as a function of age
• Results suggest that muscle atrophy is not responsible for most presbyphonia cases; treatment should focus on lamina propria revitalisation
Conclusion
The present study found no evidence of age-related thyroarytenoid muscle atrophy in the elderly population. Though histological changes with ageing may affect the thyroarytenoid muscles as previously reported, there are no observed changes in muscle volume. Further areas for exploration with MRI volumetric analysis could include cohort studies of presbyphonic patients and age-matched controls.
Acknowledgements
The authors wish to thank Daniel Lan for assisting with data collection and Kaming Lo for statistical analysis.
Competing interests
None declared