We exploit a unique opportunity to identify response bias in survey questions about voter turnout and vote choice, two outcomes of fundamental interest to political scientists that are often measured using surveys (see, e.g., Barton, Castillo, and Petrie Reference Burden2014; Broockman, Kalla, and Sekhon Reference Belli, Moore and VanHoewyk2017; De La O and Rodden Reference De LaO and Rodden2008; Greene Reference Greene2011; Mvukiyehe and Samii Reference Mvukiyehe and Samii2017; Nathan Reference Nathan2016).Footnote 1 An extensive literature studies response bias in survey measures of voter turnout in advanced democracies (see, e.g., Belli, Moore and VanHoewyk Reference Belli, Traugott, Young and McGonagle2006; Belli et al. Reference Barton, Castillo and Petrie1999; Burden Reference Burden2000; Clausen Reference Clausen1968; Greenwald et al. Reference Greenwald, Carnot, Beach and Young1987; Holbrook and Krosnick Reference Holbrook and Krosnick2010a, Reference Holbrook and Krosnick2010b; Karp and Brockington Reference Karp and Brockington2005; Silver, Anderson, and Abramson Reference Silver, Anderson and Abramson1986; Zeglovits and Kritzinger Reference Zeglovits and Kritzinger2013). However, we lack information about the extent of this problem in new democracies or on survey measures of vote choice.
In a field experiment conducted in Benin (Adida et al. Reference Adida, Gottlieb, Kramon and McClendon2017), we measured voter turnout and vote choice through survey and official village-level administrative data.Footnote 2 The main results of our field experiment are based on administrative data precisely because of the bias introduced by the survey data, which we demonstrate below.Footnote 3 Because our surveys are representative at the village-level, we can compare average outcomes across both measurement instruments in a large number of units (N = 237). This allows us to demonstrate the size and significance of the discrepancy between estimates of vote choice and voter turnout using these different instruments: survey respondents consistently overreport turning out to vote and voting for the incumbent. This bias is large, with implications for the interpretation of experimental results.
We implemented a randomized field experiment around the 2015 legislative elections in Benin (Appendix D in Supplemental Material) that randomly assigned villages to receive information about the performance of their incumbent legislator (Appendix B in Supplemental Material). Our administrative data consist of official polling station level results from these elections. We aggregate these data up (Appendix G in Supplemental Material) to produce village-level measures of incumbent vote share and voter turnout because our experiment intervened at the village level, and not at the polling station level.
We collected panel survey data on turnout and vote choice. Several weeks before the election, we administered a baseline survey (Appendix E in Supplemental Material) in a random sample of households in each study village (N = 3,419). In treatment villages, we provided performance information to 40–60 people from separate households, or 12–15% of households. The endline survey was conducted by phone in the days following the election and prior to the official announcement of results.
We deliberately constructed our vote choice question in yes or no format to protect respondent privacy and minimize social pressure (Table 1). Since the survey was conducted over the phone, no one but the respondent could understand the meaning of the yes or no response.Footnote 4
Vote Choice Survey Question

To measure voter turnout, we asked respondents whether they voted in the legislative elections several days earlier, prefacing the question with the observation that some people were not able to vote, a face-saving element shown to reduce turnout overreporting (Zeglovits and Kritzinger Reference Zeglovits and Kritzinger2013).Footnote 5 We validated this measure with two follow-up questions respondents would be more likely to know if they voted: which hand and finger were stamped after voting to prevent fraud.
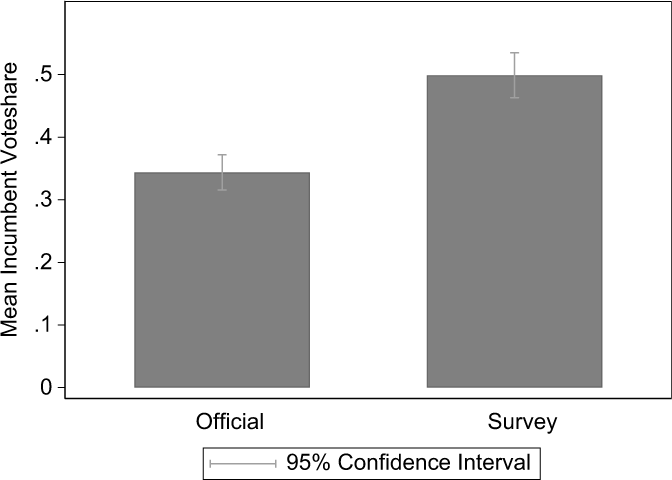
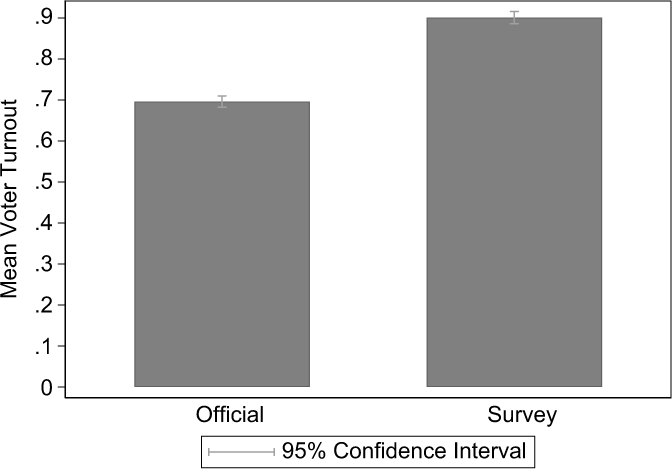
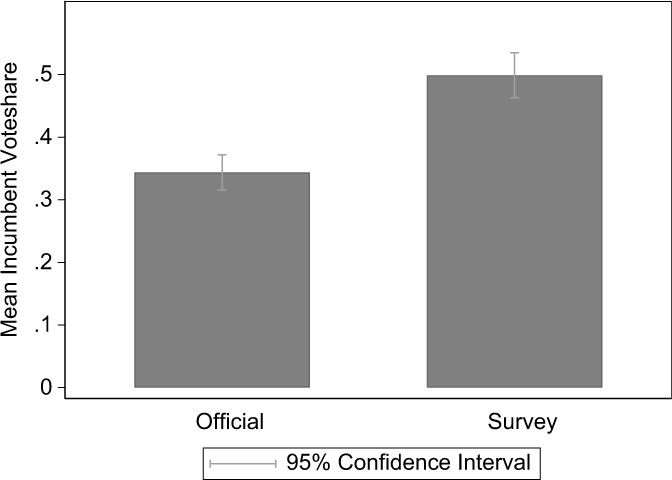
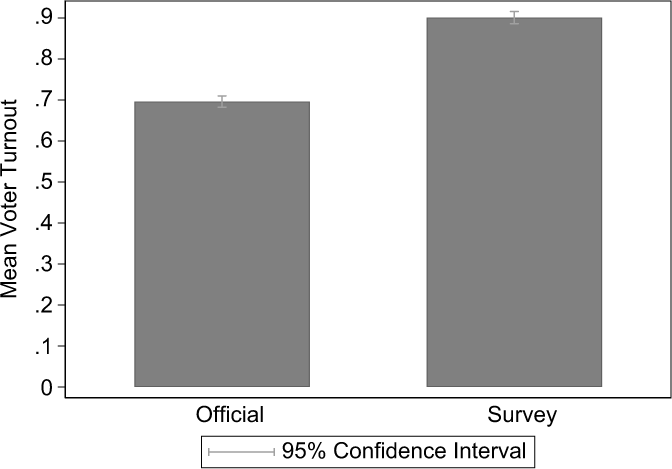
Figures 1 and 2 graph the differences of means across each measure for incumbent vote share and turnout: these are substantively large and statistically significant. For vote choice, average survey responses are 15 percentage points (half a standard deviation) higher than official data, an upward bias of 45%. For turnout, average survey responses are 20 percentage points (almost two standard deviations) higher than official data, an upward bias of 29%.
Official versus Survey Data: Incumbent Vote Share.
Official versus Survey Data: Voter Turnout.
Are the differences above driven by sample differences rather than response bias? If our representative survey captures individuals who did not register to vote, we expect a downward bias in our turnout measure, yielding a more conservative estimate. As for reported vote choice, we do not have strong expectations about whether respondents who did not register to vote would systematically be more or less likely to overreport voting for the incumbent. The above analyses imply that overreporting is greater for the vote choice question than for the turnout question: even if survey participants who misreport turning out to vote always report voting for the incumbent, this cannot account for all the response bias in the vote choice question.
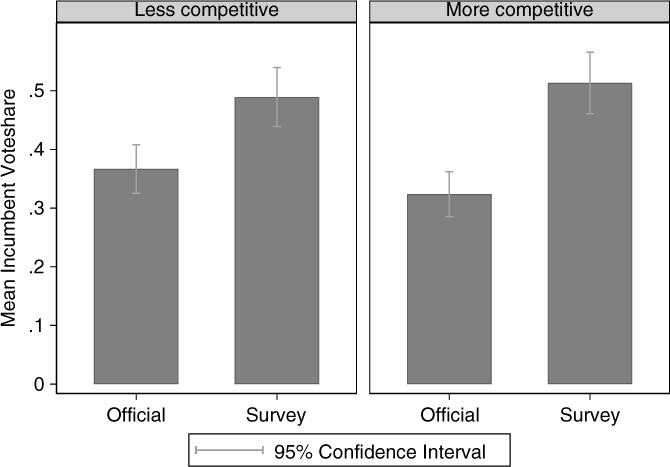
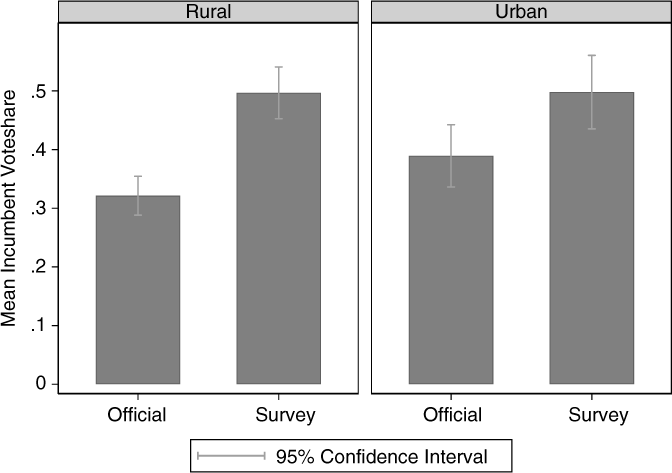
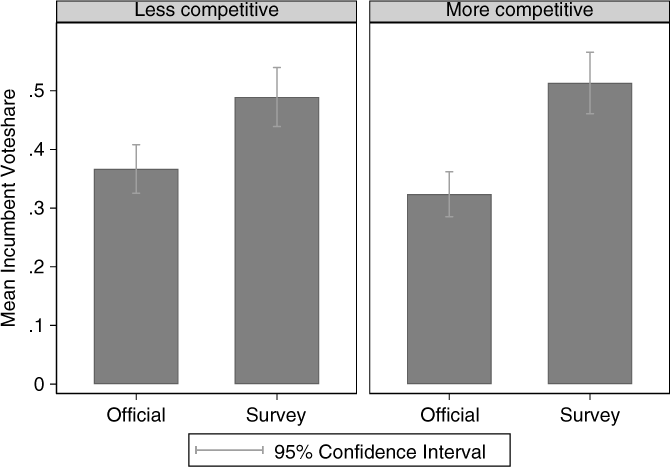
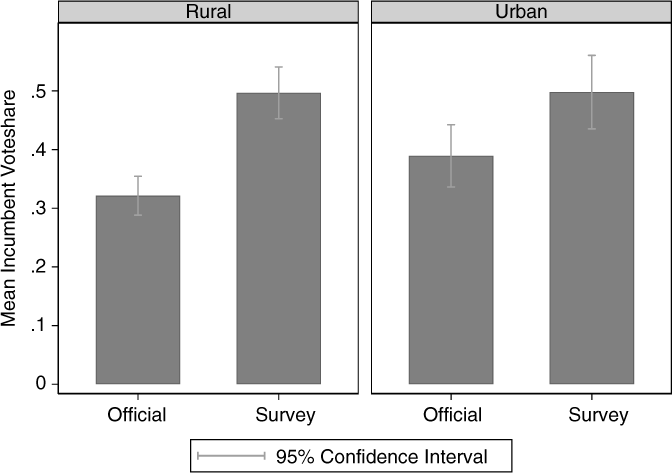
In Figures 3 and 4, we show that response bias in the vote choice question is more severe in more competitive and in rural localities – consistent with the expectation that bias increases with the sensitivity of the question. In competitive areas, the incumbent may be especially motivated to use repressive tactics, and rural voters may be especially worried about social sanctions if their vote choice is discovered.
Official versus Survey Data: Incumbent Vote Share, by Competitiveness of 2011 Race.
Official versus Survey Data: Incumbent Vote Share, by Urban.
We conclude by demonstrating the implications of this measurement bias for analyzing treatment effects in our field experiment. We prespecified that treatment would increase (decrease) the vote share of incumbents in areas where the incumbent had performed well (poorly) in office (Appendix H in Supplemental Material).
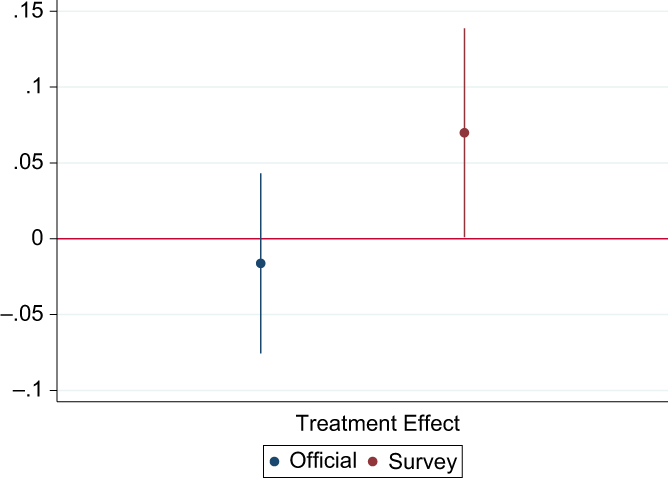
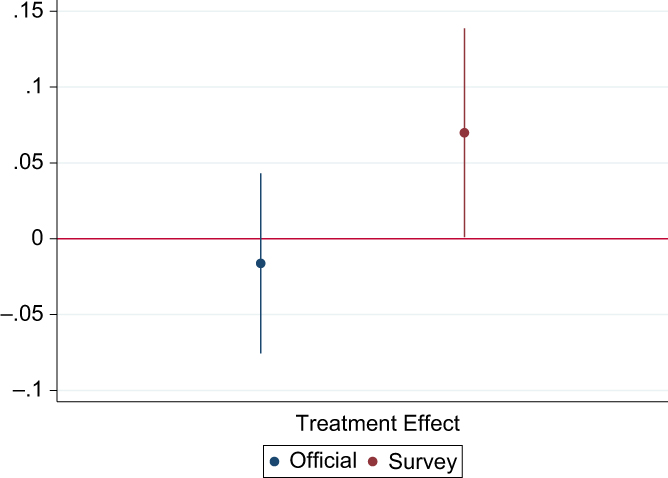
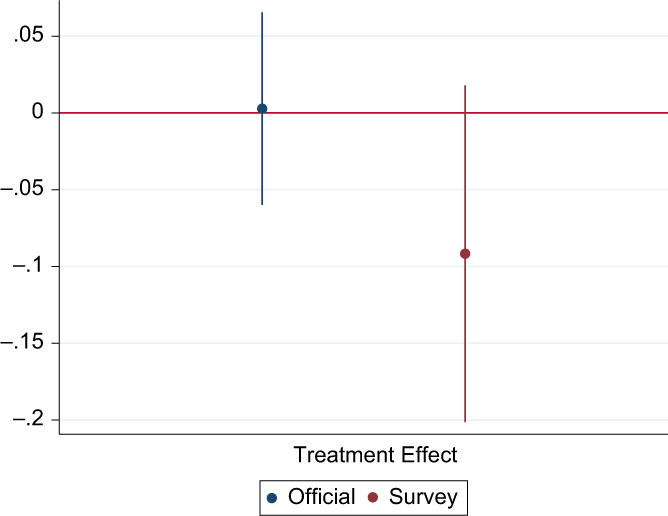
To test these hypotheses, we estimate treatment effects on incumbent vote share in good (Figure 5) and bad (Figure 6) performance areas (Appendix I in Supplemental Material). We find a striking difference in results based on the type of data analyzed. The survey data imply that the treatment elicited the expected effect: providing positive (negative) information about the incumbent increased (decreased) vote share. By contrast, the analysis of official results suggests precisely estimated null effects. In other words, we find measurement bias induced by our treatment, a serious form of measurement error.
Treatment Effects on Incumbent Vote Share: Good News.
Treatment Effects on Incumbent Vote Share: Bad News.
Is this disparity attributable to differences in treatment intensity? Treatment was typically administered to a larger share of survey respondents than of registered voters in a given village. And yet, in a separate analysis, we find effects of a variant of this treatment even when administered to the same proportion of a village’s population (Adida et al. Reference Adida, Gottlieb, Kramon and McClendon2017). Additionally, if treatment intensity were a moderator, we would expect – but do not find – heterogeneous treatment effects by village size.Footnote 6
The conclusions we draw from our study thus seem to depend on the data we use. The results using the survey data are consistent with our preregistered hypotheses. However, they are also consistent with social desirability bias, where participants over(under)-report support for strong (weak) incumbents. By contrast, the administrative data lead to the conclusion that the treatment had no average treatment effect. Response bias in survey measures of vote choice and turnout in new democracies can be large and lead to Type-I errors.
Supplementary material
To view supplementary material for this article, please visit https://doi.org/10.1017/XPS.2019.9.
Author ORCIDs
Claire Adida 0000-0002-3493-5539