I. INTRODUCTION
Various spin textures such as skyrmions, helical orders, flux closures, or vortices have generated great interest recently not only for exploring previously ignored spin interaction mechanisms, but also for potential applications as high performance, low cost memories. Reference Shinjo, Okuno, Hassdorf, Shigeto and Ono1–Reference Nagaosa and Tokura6 While ferromagnetic exchange favors parallel spin polarizations, Reference Rößler, Bogdanov and Pfleiderer2 other mechanisms such as asymmetry interactions or demagnetization field tend to swing spins and thus form intriguing spin textures in magnets. Reference Shinjo, Okuno, Hassdorf, Shigeto and Ono1–Reference Catalan, Seidel, Ramesh and Scott7 Nevertheless, a precondition for the occurrences of these novel spin structures is that the magnetic anisotropy energies are week forces so that spin can rotate continuously under specific conditions. Reference Shinjo, Okuno, Hassdorf, Shigeto and Ono1,Reference Rößler, Bogdanov and Pfleiderer2,Reference Catalan, Seidel, Ramesh and Scott7
Ferroelectric materials are the counterpart of ferromagnets. They are polar in structure which is switchable under an external field, Reference Cohen8 and therefore, are promising materials for random access memories, thin-film capacitors and actuators. Reference Scott9,Reference Spaldin, Rabe, Ahn and Triscone10 Nanoscale ferroelectrics were predicted to exhibit unique closure-quadrant patterns with closed head–tail dipole moments known as flux-closures. Reference Naumov, Bellaiche and Fu11–Reference Zhou and Wu15 These flux-closure domains should be switchable which may give rise to an unusually high density of “bits” (Ref. Reference Naumov, Bellaiche and Fu11) as well as potential applications in mechanical sensors and transducers. Reference Chen, Zheng and Wang14 Nevertheless, in ferroelectric materials, the coupling of polarization to spontaneous strain would be so remarkable that formation of a closure-quadrant with its resultant severe disclination strains is hard to reach. Reference Catalan, Seidel, Ramesh and Scott7,Reference Kittel16 Although closure-quadrants were reported in tetragonal ferroelectric BaTiO3 (Refs. Reference Schilling, Byrne, Catalan, Webber, Genenko, Wu, Scott and Gregg17–Reference McQuaid, McGilly, Sharma, Gruverman and Gregg19), PbZr0.42Ti0.58O3 (Ref. Reference McGilly and Gregg20) and PZN-12PT (Ref. Reference Chang, Nagarajan, Scott and Gregg21), they are mostly composed of shape conserving 90° stripe domains or twins within each quadrant to accommodate the disclination strains. In such cases, the closure-quadrants may not always involve continuous dipole rotations. While continuous dipole rotations were observed in half of closure quadrants responding to depolarization fields, Reference Jia, Urban, Alexe, Hesse and Vrejoiu22,Reference Nelson, Winchester, Zhang, Kim, Melville, Adamo, Folkman, Baek, Eom, Schlom, Chen and Pan23 another strategy, i.e., external strains were recently used to overcome the strongly coupled strains and polarizations in ferroelectrics and periodically arranged flux closure quadrants and polar vortices were obtained in tensile strained PbTiO3/SrTiO3 multilayers. Reference Tang, Zhu, Ma, Borisevich, Morozovska, Eliseev, Wang, Wang, Xu, Zhang and Pennycook24,Reference Yadav, Nelson, Hsu, Hong, Clarkson, Schlepütz, Damodaran, Shafer, Arenholz, Dedon, Chen, Vishwanath, Minor, Chen, Scott, Martin and Ramesh25 However, the fine distributions of polarizations in 3D and how the strains inside a flux closure affect the structures of domain walls are still less understood, especially little is known at the atomic level.
In this work, we show that external tensile strain from a GdScO3 substrate could trigger symmetrical full flux closure featured as twin-free 4-fold domain wall junctions, in a PbTiO3/SrTiO3 (PTO/STO) multilayer film. On the basis of aberration-corrected high angle annular dark field (HAADF) Z-contrast scanning transmission electron microcopy (STEM), we have made precise determination of strains and relative ion displacement for individual PTO unit cells. Unusual disclination strains and 3D polarization texture as well as their effects on the domain walls inside the closure quadrant were observed and further rationalized by phase-field simulations and Landau–Ginsburg–Devonshire (LGD) phenomenological analytical calculations.
II. EXPERIMENTAL PROCEDURES
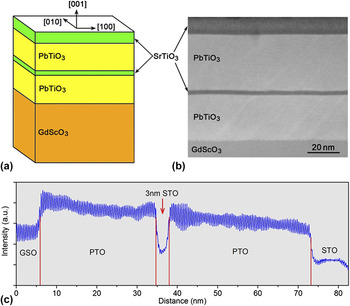
An epitaxial structure of SrTiO3(10 nm)/PbTiO3(38 nm)/SrTiO3(3 nm)/PbTiO3(26 nm) was grown on a GdScO3(110)o substrate by pulsed laser deposition [PLD, Fig. 1(a), where the O subscripts represent orthorhombic indices here] using a Lambda Physik LPX 305i KrF (λ = 248 nm) excimer laser. The PbTiO3 targets were 3 mol% Pb-enriched sintered ceramics. The target–substrate distance was 40 mm. The background pressure was 10−5 Pa. During the growth of PTO, the substrate temperature was kept at 650 °C, with a laser energy density of 2 J/cm2, a laser repetition rate of 5 Hz and under an oxygen pressure of 20 Pa. For the growth of SrTiO3 layers, the substrate temperature was also 650 °C, with a laser energy density of 1 J/cm2, a laser repetition rate of 2 Hz and under an oxygen pressure of 8 Pa. Reference Tang, Zhu, Ma, Borisevich, Morozovska, Eliseev, Wang, Wang, Xu, Zhang and Pennycook24 The GdScO3 substrate has a larger pseudocubic lattice parameter (3.97 Å) than PTO (a = 3.90 Å), thus various 90° twins tend to form to relax the mismatch. Reference Catalan, Lubk, Vlooswijk, Snoeck, Magen, Janssens, Rispens, Rijnders, Blank and Noheda26 The strain coupling between 90° twins and the coherent PTO/STO interfaces may give rise to novel topological dipole textures as observed previously. Reference Tang, Zhu, Ma, Borisevich, Morozovska, Eliseev, Wang, Wang, Xu, Zhang and Pennycook24 The high-quality PTO/STO multilayer can be identified in the low-magnification cross-sectional HAADF-STEM image and the corresponding well-defined intensity profile [Figs. 1(b) and 1(c)]. The final 10 nm STO layer was designed to negate any charge compensation of the surface which might affect the intrinsic domain patterns of the film.
Illustration of the heteroepitaxial SrTiO3(10 nm)/PbTiO3(36 nm)/SrTiO3(3 nm)/PbTiO3(28 nm)/GdScO3 multilayer. (a) Schematic illustration of the multilayer. (b) A low-magnification cross-sectional HAADF-STEM image of the PbTiO3/SrTiO3 multilayer. (c) A HAADF-STEM intensity profile of (b), which reveals the well-grown PbTiO3/SrTiO3 multilayer. Since the image intensity under HAADF mode is about proportional to Z 2 (Z is the atomic number), heavy cations appear as bright contrast while light ions appear as gray contrast in the HAADF, or Z-contrast images. Thus in (b) PbTiO3 crystal shows bright appearance, while the SrTiO3 layers and GdScO3 substrate exhibit darker contrast since Gd and Sr elements are much lighter than Pb.

The samples for the STEM experiments were prepared by slicing, gluing, grinding, dimpling, and finally ion milling. A Gatan PIPS was used for the final ion milling. HAADF images were recorded using aberration-corrected scanning transmission electron microscopes [Titan Cubed 60–300 kV microscope (FEI) fitted with a high-brightness field-emission gun (X-FEG) and double Cs corrector from CEOS operating at 300 kV]. The beam convergence angle is 25 mrad, and the collection angle ranges from 50 mrad to 250 mrad. Noise in the obtained HAADF-STEM images was reduced by Wiener filter or a low-pass annular mask restricted to the instrument resolution limit of the image. The atom positions were determined accurately by fitting them as two dimensional (2D) Gaussian peaks by using Matlab, Reference Jia, Urban, Alexe, Hesse and Vrejoiu22–Reference Jia, Nagarajan, He, Houben, Zhao, Ramesh, Urban and Waser28 thus the lattice spacing and Ti4+ shifts (δTi) were deduced (Fig. 2). The lattice parameters of PTO unit cells were determined though the Pb2+ column coordinates in the HAADF-STEM images. The atomic number for Pb2+ is high enough to produce extremely bright contrast, since the atomic column intensity in HAADF-STEM image is approximately proportional to Z 2 (Refs. Reference Nelson, Winchester, Zhang, Kim, Melville, Adamo, Folkman, Baek, Eom, Schlom, Chen and Pan23–Reference Catalan, Lubk, Vlooswijk, Snoeck, Magen, Janssens, Rispens, Rijnders, Blank and Noheda26). The coordinates of brighter Pb2+ columns were thus used to determine the lattice parameters, because of their high accuracy. Reference Nelson, Winchester, Zhang, Kim, Melville, Adamo, Folkman, Baek, Eom, Schlom, Chen and Pan23 The lattice parameters were calibrated with reference to the lattice parameter of the GdScO3 substrate in a low magnified HAADF-STEM image.
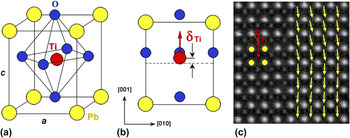
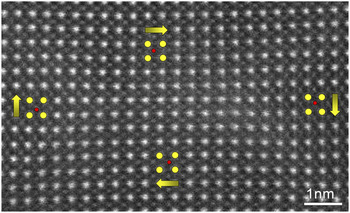
Experimental determination of the polarization direction by the relative displacements of the Ti4+ cation columns and the Pb2+ cation columns. (a) Schematic perspective view of the unit cell of ferroelectric PbTiO3. (b) Projection of the unit-cell along the [100] direction (yellow circle: Pb2+, red circle: Ti4+ and blue circle: O2−). (c) A HAADF-STEM image of the PbTiO3 crystal. The image is recorded with the incident electron beam parallel to the [100] direction. The Pb2+ columns appear brighter than the Ti4+ columns. The red arrows in (b) and (c) denote the relative displacements of the Ti4+ columns and the Pb2+ columns, which were opposite to the spontaneous polarization direction of the PbTiO3. Yellow arrows superimposed on the right panel of (c) indicate reversed Ti4+ ion displacement (δTi) vectors, which were consistent with the spontaneous polarization direction of the PbTiO3.

HAADF-STEM imaging is used to identify the structural details at the atomic scale. PTO has a tetragonal structure in which the positioning of cations and anions are schematically displayed in Fig. 2(a). Both the oxygen octahedra and the Ti cation have displacements from the center of Pb tetragonal cell that induce the spontaneous polarization [P s, see the [100]-projection in Fig. 2(b)]. The displacement vectors of Ti4+ (denoted as δTi) relative to the mass center of the four nearest Pb2+ neighbors [Fig. 2(c)] can be determined by fitting them as 2D Gaussian peaks based on the HAADF-STEM images. Reference Jia, Urban, Alexe, Hesse and Vrejoiu22–Reference Jia, Nagarajan, He, Houben, Zhao, Ramesh, Urban and Waser28 The δTi vector in each unit cell is opposite to the P s direction of the PTO [Fig. 2(c)]. The δTi vector maps were smoothed using an averaging window of 1.2 nm. The visualization of the 2D δTi vectors was carried out by using Matlab. The visualization of the lattice parameters and lattice rotations were carried out using the combination of Matlab and Gatan DigitalMicrograph software.
Phase-field simulation of domain structures of the PTO/STO multilayer film was stated from small slightly polar nuclei and thus the stabilized domain structure of the multilayer under tensile strain was obtained. In this calculation, spontaneous polarization vectors are used as the order parameter, which is governed by the time dependent Ginzburg–Landau equations. Reference Li, Hu, Liu and Chen29–Reference Li, Hu, Liu and Chen31 Moreover, the energy terms involving elastic and gradient components were also considered. The detailed solution to the phase-field equations can be found in literatures. Reference Li, Hu, Liu and Chen29,Reference Li, Hu, Liu and Chen31 All the parameters can also be found in literature for PTO Reference Li, Hu, Liu and Chen29,Reference Haun32 and STO. Reference Sheng, Li, Zhang, Choudhury, Jia, Gopalan, Schlom, Liu and Chen33 An iteration method is adopted to accommodate the elastic anisotropy between the PTO and STO layer. Reference Wang, Ma, Li, Britson and Chen34 A system size of 500 × 2 × 250 in three dimensions is used with each grid representing 0.4 nm, where 20 grids of substrate, 70 grids of PTO, 6 grids of STO, 90 grids of PTO, 25 grids of STO, and 39 grids of air in the thickness direction from the bottom is added to simulate the experimental condition. Short circuit electric boundary condition is assumed on the bottom and top of the film with compensation of charge from air. The mixed mechanical boundary condition is used where the film top is stress free and sufficient far away from the substrate bottom, the displacement is zero. Periodical boundary condition is used along the in-plane directions while a superposition method is applied on the out-of-plane dimension. Reference Chen and Shen35
III. RESULTS
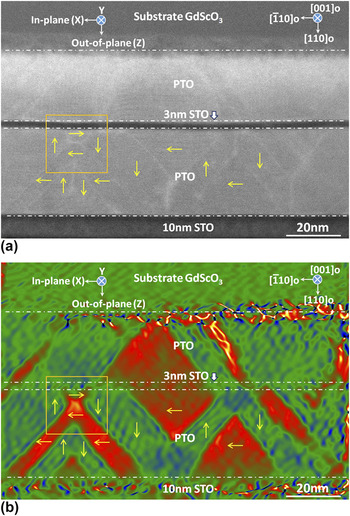
Figure 3(a) is a low-magnification HAADF-STEM image of the PTO/STO multilayer showing the morphology of the whole film. The PTO layers can be easily distinguished here since they display brighter intensity in the Z-contrast image. Subtle contrast fluctuations can be identified in the PTO layers showing possible domain walls (DWs), which can be extracted by strain mapping via geometric phase analysis (GPA, Refs. Reference Hÿtch, Snoeck and Kilaas36 and Reference Tang, Zhu and Ma37), as shown in Fig. 3(b). Domains marked with red color have larger in-plane lattice parameter (a domain), while domains in green possess smaller in-plane lattice parameter (c domain). A periodic array of asymmetric flux closure quadrants is seen at the right side of the lower PTO layer. Reference Tang, Zhu, Ma, Borisevich, Morozovska, Eliseev, Wang, Wang, Xu, Zhang and Pennycook24 A possible 4-fold domain wall junction displaying symmetric closure feature is marked with a yellow box. Since a symmetric flux closure quadrant is still elusive, here we focus on the atomic morphology and physical properties inside the symmetric flux closure.
HAADF-STEM image and in-plane strain analysis of the PbTiO3/SrTiO3 multilayer film. (a) A low-magnification HAADF-STEM image of the multilayer. (b) In-plane strain map extracted via GPA. Domains marked with red color have larger in-plane lattice parameter (a domain), while domains filled with green color possess smaller in-plane lattice parameter (c domain). Yellow arrows indicate possible polarization directions in corresponding domains, which will be specified in latter analysis (Figs. 4 and 5). Note that a possible 4-fold domain wall junctions displaying flux closure feature was marked by a yellow box.

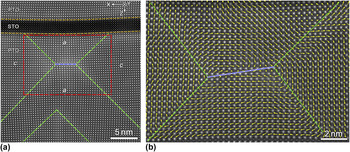
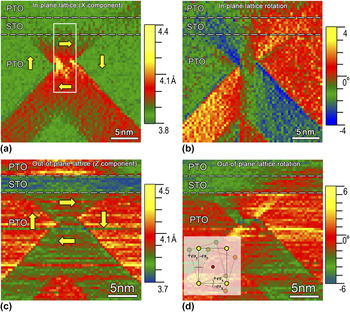
The possible symmetric closure quadrant is magnified in Fig. 4. As can be seen, it is composed of two 3-fold DWs connected by a 180° DW [blue dashed-line, Fig. 4(a)]. An intersection of two 90° twins (green dashed-lines) can be identified at the lower panel of Fig. 4(a). A HAADF-STEM image superimposed with Ti4+ displacement maps unit-cell by unit-cell is shown in Fig. 4(b) (the unedited raw image of the symmetric closure quadrant is shown in Fig. 5). This is a quadrant head-to-tail polarization closure domain composed of two 3-fold vertices. Such a configuration is just the one predicted by Charles Kittel as early as in 1946 for small ferromagnetic platelets Reference Kittel38 and proposed by Srolovitz and Scott in 1986 for ferroelectrics. Reference Srolovitz and Scott39 Strain maps [in-plane and out-of-plane lattice parameters, in-plane and out-of-plane lattice rotations shown in Figs. 6(a)–6(d), ‘lattice rotation’ here refers to rigid-body rotation of crystal lattice, Reference Tang, Zhu, Ma, Borisevich, Morozovska, Eliseev, Wang, Wang, Xu, Zhang and Pennycook24,Reference Hÿtch, Snoeck and Kilaas36,Reference Tang, Zhu and Ma37 the detailed definitions were given in the inset of Fig. 6(d)] indicate a unique strain interaction mode of the two 90° twins and the STO layer [note the curvature of the 3 nm STO layer in Fig. 4(a)]. It is proposed that the coupling of 90° twins and the STO layer be responsible for such a special domain patterns. That is to say, these hourglass-like 90° twins form a completely closed (flux-closure) structure connected by four 90° DWs and one 180° DW, namely, a 4-fold domain wall junction. It is of great interest to notice that each quadrant is a single domain and free from any superfluous 90° twin to relax the disclination strains, so the strains in such a flux-closure are very unusual, as seen in the inhomogeneity of disclination strains shown in Figs. 6(a)–6(d). The in-plane strains beside the 180° DW accumulate a maximum around the two 3-fold vertices and decay gradually from the center to edges, while the in-plane strains at the left and right c domains are relatively homogeneous [Fig. 6(a)]. In contrast, the out-of-plane strains in each domain around the closure quadrant are relatively uniform [Fig. 6(c)]. The lattice rotation maps shown in Figs. 6(b) and 6(d) display remarkable disclination strain features, since the rotation of these perovskite lattices varies continuously from left to right even in a single domain.
HAADF-STEM imaging of the 4-fold domain wall junctions in the PbTiO3 layer close to the 3 nm SrTiO3 layer. (a) Atomic-resolution image of the PbTiO3/SrTiO3 multilayer. The Pb2+ ions appear as bright circles, the Sr2+ and Ti4+ ions show degressively changed intensities. The green dashed-lines trace the 90° domain walls. Note the curvature of the 3 nm SrTiO3 layer, which implies that the upper and lower PbTiO3 layers are strain-coupled with each other. The blue dotted-line indicates the 180° domain wall. (b) A magnification of the red box area in (a) superimposed with reversed Ti4+ ion displacement vector maps unit-cell by unit-cell. It is a quadrant head-to-tail polarization-closure domains composed of two 3-fold vertices.

High-magnification raw image of the 4-fold domain wall junctions corresponding to Fig. 4.

Strain analysis of the 4-fold domain wall junctions in PbTiO3/SrTiO3 multilayer. (a and b) In-plane lattice parameters and in-plane lattice rotations mappings near the 4-fold domain wall junctions. (c and d) Out-of-plane lattice parameters and out-of-plane lattice rotations mappings near the 4-fold domain wall junctions. An inset in (d) indicates the definition of in-plane and out-of-plane lattice rotation. The in-plane lattice rotation was denoted by ω x , while the out-of-plane lattice rotation was denoted by ω y . Counter-clockwise lattice rotation was defined as positive rotation, while clockwise rotation was defined as negative ones.

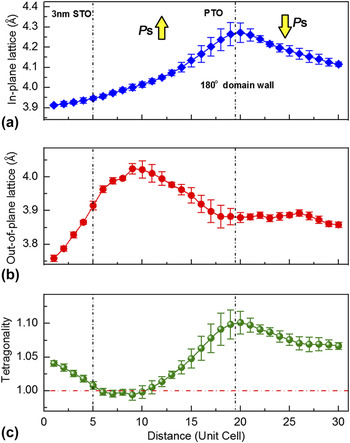
To quantitatively reveal the lattice behaviors inside the 4-fold domain wall junctions, both the in-plane and out-of-plane lattice distributions as well as the tetragonality (c/a) across the 180° DW were statistically analyzed, as shown in Fig. 7. The data were acquired from the PTO unit cells corresponding to the white box area marked in Fig. 6(a). Distribution character of the in-plane lattice parameter (c lattice here) was consistent with the 2D strain map [Fig. 6(a)]. The lattice parameter gradient of this disclination strain can thus be estimated as 0.018 Å per unit cell and corresponds to a strain gradient above 107/m, which is, to the best of our knowledge, the highest one obtained in experiment (except for ferroelectric DWs and other interfaces, where large strain gradient up to 108–109/m may occur within a very local area, Ref. Reference Tang, Zhu, Ma, Borisevich, Morozovska, Eliseev, Wang, Wang, Xu, Zhang and Pennycook24). In contrast, the out-of-plane lattice parameter (a lattice here) distributions shows an abnormal weak peak in the a domain near the 3 nm STO layer, which can also be inspected in the 2D strain map [Fig. 6(c)]. This abnormal elongation of the out-of-plane lattice is probably caused by a tensile strain from the above STO layer and the upper PTO layer, since the STO layer is obviously bended.
Lattice behavior analysis across the 180° domain wall of the 4-fold domain wall junctions. (a) In-plane lattice parameter (c lattice here) distributions. The data was acquired from the white box area in Fig. 6(a). (b) Out-of-plane lattice parameter (a lattice here) distributions. The data was acquired from the PbTiO3 unit-cells corresponding to the white box area marked in Fig. 6(a). (c) c/a ratio (tetragonality) distributions calculated based on (a) and (b). Note the giant lattice parameter gradient up to 0.018 Å per unit-cell in (a), corresponds to a strain gradient above 107/m. Also note an unusual a lattice peak in (b), which results in a nearly 1 tetragonality in (c). This unusual lattice behavior was predicted in first principle simulations for the ferroelectric vortices. Reference Prosandeev and Bellaiche12

Such a combination of both the in-plane and out-of-plane lattice behaviors induces even more unusual c/a ratio distributions, as shown in Fig. 7(c). While the gradual reduction of tetragonality beside the 180° DW is reasonable and consistent with the in-plane lattice decreases, unusual c/a ratios smaller than 1 are observed for PTO unit cells near the 3 nm STO layer involving about 6 unit cells. Previous first-principles simulations indicated that this tetragonality behavior is the unique character of tetragonal ferroelectric vortex domains, Reference Prosandeev and Bellaiche12 thus the results here provide direct observations of such novel strain states in topological dipole structures of ferroelectrics.
The spontaneous polarizations of ferroelectrics are strongly coupled with strains since the dipole in each unit cell is driven by relative shifts of anions and cations, through chemical bonding. Reference Cohen8,Reference Spaldin, Rabe, Ahn and Triscone10 Thus it is reasonable to conclude that the spontaneous polarization distributions inside the 4-fold domain wall junction should also exhibit unique features in response to the unusual strain characters. Taking into the account of the fact that the ferroelectric shifts of ions are generally tiny and difficult to be quantified, we further carry out phase-field simulations for extracting the domain structures and polarizations and rationalizing the unusual strains inside the 4-fold domain wall junctions. The phase-field methods have been showing great potential to understand the domain structures and physical properties of nanoscale ferroelectric films. Reference Balke, Choudhury, Jesse, Huijben, Chu, Baddorf, Chen, Ramesh and Kalinin40–Reference Lee, Lu, Gu, Choi, Li, Ryu, Paudel, Song, Mikheev, Lee, Stemmer, Tenne, Oh, Tsymbal, Wu, Chen, Gruverman and Eom42
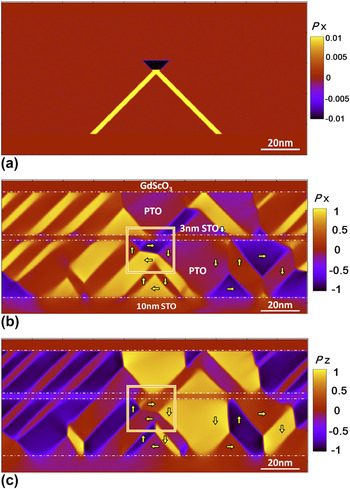
First we successfully reproduce the domain structures of the tensile strained PTO/STO multilayer on the GdScO3 substrate with specific layer thicknesses, as shown in Fig. 8. The initial structure was constructed according to the experimentally measured thicknesses of each layer [Fig. 8(a)]. Note that both of the 4-fold domain wall junction and the periodic array of asymmetric flux-closure quadrants were well reproduced through the phase-field calculations, which were consistent with the HAADF-STEM observations (Fig. 3). One interesting feature is that the a-domains can well penetrate through the thin STO layer, forming continuous long ferroelastic domains due to the long-range strain interaction between the up and bottom PTO layer, which is also observed experimentally [Fig. 3(b)]. At first glance of both the in-plane and out-of-plane polarization maps, inhomogeneous distributions of polarization in each single domain are obvious, since the strains in corresponding domains are also nonuniform.
Phase-field simulation of domain structures in the PbTiO3/SrTiO3 multilayer under tensile strain. (a) Initial structure used for the phase-field simulation of domain structures of the PbTiO3/SrTiO3 multilayer film. Small slightly polar nuclei were initiated until the stabilized domain structure obtained. (b) In-plane polarization map (X component). (c) Out-of-plane polarization map (Z component). Note that both of the 4-fold domain wall junctions and periodic array of flux-closure quadrants were well reproduced through the phase-field calculations, which are consistent with the HAADF-STEM observations (Fig. 3). The polarization of bulk PbTiO3 (about 0.75 C/m2) was normalized to ‘1’ and used for defining the color scale of P x and P z.

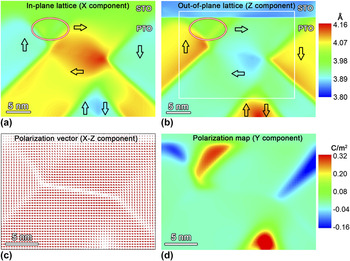
The strains and polarization vectors inside the 4-fold domain wall junction marked with a yellow box in Figs. 8(b) and 8(c) were analyzed in detail, as shown in Fig. 9. The gradually changed in-plane lattice parameter and increased out-of-plane lattice parameter from the closure center were consistent with the experimental observations. Generally, larger in-plane parameter is shown in the a domain region, while larger out-of-plane domain can be found in the c domain region. However, anomaly develops near the PTO/STO interface, where both in-plane and out-of-plane lattice parameters tend to be in-between, close to 3.98 Å. The tetragonality of PTO unit cells near the STO/PTO interface equals about 1, since for these unit cells both of the in-plane and out-of-plane lattice constants have similar values. X–Z component polarization vector maps for the white box area marked in Fig. 9(b) display the 90 and 180° DWs directly [Fig. 9(c)]. There is an obvious reduction of polarizations beside the 180° DW. Note that evident polarization rotations away from the c axis occur above the 180° DW. Moreover, both the strain and polarization vector maps indicate that the two 90° DWs above the 180° DW are significantly broadened as compared with the other two 90° DWs. Particularly, dipoles across the upper two 90° DWs gradually and continuously rotate, which is in accordance with the DW broadening effects. More importantly, abnormal polarization component normal to the print page was further identified, as shown in Fig. 9(d), making locally lower symmetry phases. This lower symmetry phase can well explain the tetragonality near the PTO/STO interface. The strongly coupled lattice and polarization have induced complex 3D polarization distributions in response to the symmetry breaking of the lattice here inside the 4-fold domain wall junction.
Phase-field simulations of strain and polarization distributions in the 4-fold domain wall junctions. (a) In-plane lattice parameter map (X component). (b) Out-of-plane lattice parameter map (Z component). (c) Polarization vector map for the X–Z component. (d) Y component polarization map. Maps (c) and (d) correspond to the white box area marked in (b). Note that the color scales for the X and Z strain components in the ellipse areas are nearly the same, indicating a ∼1 c/a ratio occurs here, which are consistent with the STEM observations [Fig. 7(c)].

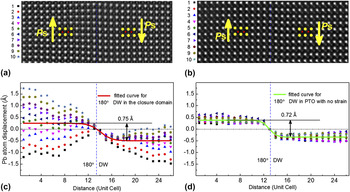
Moreover, Landau–Ginsburg–Devonshire (LGD) phenomenology indicates that the flexoelectric coupling at the 180° DW of tetragonal ferroelectrics causes obvious lattice offsets in domains beside the 180° DW and lowers the symmetry of such a DW. Reference Tang, Zhu, Ma, Borisevich, Morozovska, Eliseev, Wang, Wang, Xu, Zhang and Pennycook24,Reference Tagantsev, Cross and Fousek43–Reference Eliseev, Yudin, Kalinin, Setter, Tagantsev and Morozovska45 The offsets between 180° domains in PTO were also predicted in previous first principles calulations. Reference Meyer and Vanderbilt46 To reveal the flexoelectric coupling here at the 180° DW, the statistical distributions of Pb2+ offsets across the 180° DW in the 4-fold domain wall junction are shown in Figs. 10(a) and 10(b). A 180° DW in PTO single layer film grown on SrTiO3(001) was used as a reference, as shown in Figs. 10(c) and 10(d). The PTO crystal here is less affected by strain, since the mismatch between PTO (a = 3.90 Å) and SrTiO3(001) (a = 3.905 Å) substrate is tiny (<0.13%). Thus Fig. 10(d) reveals the intrinsic Pb2+ offsets across a 180° DW in tetragonal PTO crystal, which is about 0.72 Å. This value is in agreement with previous theoretical simulations, where an offset of 0.6 Å was reported for PTO. Reference Meyer and Vanderbilt46 Note the obvious scattering of Pb2+ offset distributions across the 180° DW in the 4-fold domain wall junction [Fig. 10(b)]. Nevertheless, the fitting results revealed that the relative Pb2+ offsets across these two 180° DWs were basically the same [Figs. 10(b) and 10(d)], while the Pb2+ offsets for 4-fold domain wall junction are highly asymmetric, especially for the left domain of Fig. 10(a), which is the a domain near the 3 nm STO layer exhibiting large strain gradient and nearly 1 tetragonality (Figs. 6 and 7). Thus we can conclude that the flexoelectric contribution on the structure of the 180° DW in the 4-fold domain wall junction is still less affected by the abnormal long range strain effects here. According to the LGD phenomenology, Reference Nye47–Reference Tagantsev, Gerra and Setter49 the displacement component U 3 along the 180 DW can be deduced as:
 $${U_3} = {Q_{11}}P_{\rm{s}}^2{x_3} - {F_{44}}{P_3}\left( {{x_1}} \right)\quad ,$$
where Q 11 is an electrostriction coefficient, P s is the spontaneous polarization, x 3 is the coordinate along the 180° DW, and F 44 is a flexoelectric effect tensor coefficient. The first term of U 3 originate from the electrostriction effect and represents constant spontaneous strain which is the same for both domains, while the second one origins from the flexoelectric effect displaying different signs for different 180° domains. Hence the difference (offset) between domains is Reference Tagantsev, Cross and Fousek43 :
 $$\delta {U_3} = 2{F_{44}}{P_{\rm{s}}}\quad .$$
Comparisons of Pb2+ ion offsets across the 180° domain wall in the 4-fold domain wall junctions and a 180° domain wall under no strain. These Pb2+ offsets were analyzed by the Landau–Ginsburg–Devonshire model. (a) The HAADF-STEM image of the 180° domain wall in the 4-fold domain wall junctions. (b) The distributions of Pb2+ offsets across the 180° domain wall in (a). The solid curve is the fitting result of the HAADF-STEM experiment based on (a). (c) A HAADF-STEM image of a 180° domain wall in a PbTiO3/SrTiO3(001) film. The PbTiO3 crystal here is less affected by strain since the mismatch between PbTiO3 and SrTiO3(001) substrate is tiny (<0.13%). (d) The distributions of Pb2+ offsets across the 180° domain wall in (c). The solid curve is the fitting result based on the HAADF-STEM experiment of (c). Note the obvious scattering of Pb2+ offset distributions across the 180° domain wall in the 4-fold domain wall junctions in (c). Nevertheless, the fitting results revealed that the relative Pb2+ offsets across these two 180° domain walls were basically the same, while the Pb2+ offsets for 4-fold domain wall junctions are highly asymmetric.

Using P s = 0.75 C/m2 and the experimentally observed δU 3 ≈ 0.7 Å, the flexoelectric coefficient F 44 can thus be estimated as about 0.5 × 10⁻¹⁰ C−1 m3, for both of the 180° DW in the 4-fold domain wall junction [Fig. 10(b)] and that in the strainless PTO film [Fig. 10(d)].
IV. DISCUSSIONS
Dipole rotation was thought to be not tolerated in these flux-closure structures at all length scales, even in ferroelectric compositions close to the Morphotropic Phase Boundary. Reference Chang, Nagarajan, Scott and Gregg21 However, our results provide direct experimental evidence of the continuous rotation of electrical dipoles forming full closure quadrants in a ferroelectric with strong tetragonality. The dimension of the 4-fold domain wall junction is found to be limited within about 20 nm (Fig. 3). This may indicate that the twin free closure quadrant occurs within narrow areas and large scale full closure should be energetically unfavorable as theoretically prodicted. Reference Aguado-Puente and Junquera13 In contrast, the periodic arranged asymmetric closure arrays observed in a series of tensile strained PTO/STO multilayer films could extend over a large scale through unique strain compensation of disclination dipoles. Reference Tang, Zhu, Ma, Borisevich, Morozovska, Eliseev, Wang, Wang, Xu, Zhang and Pennycook24
Our results indicate that external strains from the substrates are essential for surpassing the electrostriction (of 10−2 orders, and the spontaneous strain is large as about 6.5% for PTO) and giving rise to the full flux closure states in ferroelectrics. In this aspect, it is an opposite of the counterpart in ferromagnets, where the magnetostriction is of 10−5 orders, thus the vortex spin states are spontaneously formed to lower magnetostatic energy with negligible elastic energy cost. Reference Catalan, Seidel, Ramesh and Scott7,Reference Kittel16,Reference Chandra, Littelwood, Rabe, Ahn and Triscone50 Particularly, recent experiments also confirmed that the external strains could also facilitate the depolarization field driven ferroelectric vortex states in strain engineered PTO/STO superlattice. Reference Yadav, Nelson, Hsu, Hong, Clarkson, Schlepütz, Damodaran, Shafer, Arenholz, Dedon, Chen, Vishwanath, Minor, Chen, Scott, Martin and Ramesh25 In other words, the observed closure structures here and in our previous study are possible precursors of condensations of electrical dipoles as ferroelectric vortices. Reference Tang, Zhu, Ma, Borisevich, Morozovska, Eliseev, Wang, Wang, Xu, Zhang and Pennycook24,Reference Yadav, Nelson, Hsu, Hong, Clarkson, Schlepütz, Damodaran, Shafer, Arenholz, Dedon, Chen, Vishwanath, Minor, Chen, Scott, Martin and Ramesh25
At an application viewpoint, dipole closures in both of ferromagnetics and ferroelectrics sound promising. Reference Shinjo, Okuno, Hassdorf, Shigeto and Ono1,Reference Romming, Hanneken, Menzel, Bickel, Wolter, von Bergmann, Kubetzka and Wiesendanger5,Reference Scott9,Reference Naumov, Bellaiche and Fu11 Recent studies on ferromagnetic Fe-based alloys have found non-volume-conserving and hysteresis-free magnetostriction effects caused by reorientation of large scale 4-fold domain wall junction structures, Reference Chopra and Wuttig51 which indicate new magnetostrictive materials with high performance. We thus expect future explorations on large-scaling of the 4-fold domain wall junction structures in ferroelectric materials via engineering strains and consequently figuring out their field-dependent responses. We see that preliminary studies on dynamic characters of twin-relaxed ferroelectric closure domains are ongoing recently. Reference McQuaid, Gruverman, Scott and Gregg52 Thus novel units based on controllable flux closure domains in ferroelectrics are expected to be fabricated for investigating the dynamical responses and in turn helpful in the development of potential nanoscale ferroelectric devices.
V. CONCLUSIONS
We report a 3D polarization texture in a flux-closure quadrant identified in tensile strained ferroelectric PbTiO3/SrTiO3 multilayer films. Ferroelectric displacement analysis based on aberration-corrected scanning transmission electron microscopic imaging reveals highly inhomogeneous strains and polarizations as responses to symmetry breaking. The lattice parameter gradient of this disclination strain is estimated as 0.018 Å per unit cell and corresponds to a strain gradient above 107/m. The 90° domain walls in the quadrant were significantly broadened with continuous dipole rotations and a complex 3D polarization texture was envisioned via phase-field modeling. The Landau–Ginsburg–Devonshire phenomenology reveals a lattice offset between 180° domains through flexoelectric coupling, which was less affected by the disclination strains inside the closure quadrant. Present observations are helpful for understanding the basics of topological dipole textures and indicate novel applications of ferroelectrics through strain engineering.
ACKNOWLEDGMENTS
This work is supported by the National Natural Science Foundation of China (No. 51231007, 51571197, 51501194 and 51521091) and National Basic Research Program of China (2014CB921002). Y.L.T. acknowledges the IMR SYNL-T.S. Kê Research Fellowship and the Youth Innovation Promotion Association CAS (No. 2016177). A.N.M. and E.A.E. acknowledge the financial support from the National Academy of Science of the Ukraine. Z.J.H. gratefully acknowledges the US National Science Foundation under NSF DMR-1210588 and DMR-1420620, and L-Q.C. acknowledges the U.S. Department of Energy, Office of Basic Energy Sciences, Division of Materials Sciences and Engineering under Award DE-FG02-07ER46417.