I. INTRODUCTION
The use of lithium-ion batteries in portable electronics has enabled a proliferation of devices in recent years. Still, the present-and-future requirements of energy storage for transportation and grid applications are not yet met by available technologies. Specifically, energy density, power capability, cycle life, calendar life, and safety all need improvement. Low-cost manufacturing will also be required for lithium-ion batteries to compete with existing power infrastructure.Reference Armand and Tarascon1–Reference Croy, Abouimrane and Zhang3
One of the main hindrances in the progress of battery research is that the constituent electrode materials are inaccessible once an electrochemical cell is constructed. This leaves the researcher with a limited number of available feedback mechanisms to assess the cell's performance, e.g., current, voltage, and impedance. Indeed, there is a whole scientific community dedicated to the study and modeling of such electrochemical data.Reference Reddy4 However, these data are limited in their ability to reveal the more-localized smaller-scale structural mechanisms on which the batteries' performance is so dependent.Reference Ebner, Marone, Stampanoni and Wood5
In the last 20 years great advancement has been made in the area of in situ characterization using x-rays, enabling researchers to study battery materials without removing them from a cell. Aside from improvements in probe brightness and detector efficiency, these advancements can largely be credited to the construction of new cell designs utilizing low-absorption encapsulation and current-collector materials, thus allowing for greater penetration of x-rays. Such work has enabled discovery of hidden phases and the screening of potential future electrode materials.Reference Reimers and Dahn6–Reference Rodriguez, Ingersolla, Vogel and Williams9
Of those materials, olivine structured lithium iron phosphate, LiFePO4, shows great promise as an electrode, due to its superior thermal stability, relatively low cost, and high capacity retention during cycling.Reference Padhi, Nanjundaswamy and Goodenough10–Reference Zhang13 Despite intrinsically low electronic and ionic conductivity, its use in commercial batteries has become a reality through the engineering of particle morphology and composition.Reference Padhi, Nanjundaswamy and Goodenough10–Reference Zhang13 Still, the exact nature of the phase transformation during lithiation is elusive, despite many theoretical and in situ studies.Reference Love, Korovina, Patridge, Swider-Lyons, Twigg and Ramaker14
It is understood that the phase transformation upon lithiation of FePO4 is first order which gives way to a characteristic flat voltage response and biphasic composition with very limited solid solution regions at the end-member phases.Reference Padhi, Nanjundaswamy and Goodenough10–Reference Love, Korovina, Patridge, Swider-Lyons, Twigg and Ramaker14 This has been confirmed by a multitude of in situ studies of the lithiation and delithiation processes in which researchers have compared structural measurements to the electrochemical response.Reference Andersson, Kalska, Haggstrom and Thomas15–Reference Meethong, Kao, Tang, Huang, Carter and Chiang17 Disregarding the limited solid-solution ranges, one can consider the equation  ${\rm{FePO}}_4 + {\rm{Li}}^ + + {\rm{e}}^ - \mathbin{\lower.3ex\hbox{$\buildrel\textstyle\rightarrow\over {\smash{\leftarrow}\vphantom{_{\vbox to.5ex{\vss}}}}$}} {\rm{LiFePO}}_4$. This shows that for each lithium ion that intercalates, an electron is generated and the lithiated phase is created. However, in some cases anomalous behavior has been observed; that is to say that after extracting X% of the electrons from the system, the phase fraction observed deviates far from X%.Reference Chang, Chang, Wu, Yang, Sheu and Wu18–Reference Wang, Jaye, Nam, Zhang, Chen, Bai, Li, Huang, Fischer and Yang23 There are quite a few explanations of this so-called asynchronous phase transition behavior, ranging from effects of polaron formation in the latticeReference Love, Korovina, Patridge, Swider-Lyons, Twigg and Ramaker14 to the existence of a nonrepresentative x-ray volume measured in a heterogeneous electrode.Reference Wang, Jaye, Nam, Zhang, Chen, Bai, Li, Huang, Fischer and Yang23,Reference Liu, Kunz, Chen, Tamura and Richardson24 While both are possible, the most recent modeling effortsReference Farkhondeh, Safari, Pritzker, Fowler, Han, Wang and Delacourt25 and the work of othersReference Delmas, Maccario, Croguennec, Le Cras and Weill16 suggest that heterogeneous microstructure and electrical conductivity of the electrode play a large role in the phase transformation behavior.
Energy-dispersive x-ray diffraction (EDXRD) is well established as a viable tool for in situ battery characterization.Reference Ronci, Scrosati, Rossi Albertini and Perfetti26–Reference Gallaway, Erdonmez, Zhong, Croft, Sviridov, Sholklapper, Turney, Banerjee and Steingart30 Additionally, recent studies utilizing synchrotron radiation have shown very powerful spatial-and-temporal mapping capabilities.Reference Rijssenbeek, Gao, Zhong, Croft, Jisrawi, Ignatov and Tsakalakos28–Reference Gallaway, Erdonmez, Zhong, Croft, Sviridov, Sholklapper, Turney, Banerjee and Steingart30 The ultrahigh energy x-rays available (up to 200 keV) from the X17 superconducting-wiggler beamport at the National Synchrotron Light Source give way to low absorption losses and enable operando measurements.Reference Rijssenbeek, Gao, Zhong, Croft, Jisrawi, Ignatov and Tsakalakos28–Reference Gallaway, Erdonmez, Zhong, Croft, Sviridov, Sholklapper, Turney, Banerjee and Steingart30 Here, we use the term operando to differentiate the ability of EDXRD to take measurements in fully assembled cells without special sample preparation. In this study we use the unique operando spatial and temporal mapping capabilities of EDXRD to study the response of a lithium iron phosphate electrode in an actual production battery. We intend to elucidate any spatial effects which may contribute to the asynchronous phase transition behavior.
II. EXPERIMENTAL
The lithium-ion battery that was chosen for this operando study was a fully assembled 10 Ah lithium iron phosphate polymer cell. To achieve a capacity of 10 Ah, the internal structure of the cell consisted of multiple repeating units of electrodes, current collectors, and separator materials in a prismatic layout. The positive electrodes were comprised of nanosized lithium iron phosphate which were coated in carbon for increased electrical conductivity. The negative electrode consisted of graphitic carbon. The cell was recently assembled with no prior history, besides formation cycles, and was therefore considered new.
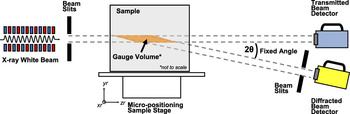
X-ray diffraction measurements were conducted at the superconducting wiggler beamline X17B1 of The National Synchrotron Light Source at Brookhaven National Laboratory. The superconducting wiggler provides a spectral flux with high brilliance across a wide range of energies up to 200 keV.Reference Thomlinson, Chapman, Gmür and Lazarz31 In an EDXRD measurement the Bragg condition for diffraction is satisfied by the use of polychromatic radiation, therefore allowing measurements at a fixed angle. Experiments were carried out in Laue geometry which results in a fixed diffraction volume in space, commonly referred to as the gage volume (GV), with a parallelepiped geometry. Figure 1 gives a schematic of the configuration.
Schematic depicting the experimental configuration of the X17B1 beamline at NSLS. The high energy polychromatic x-rays are collimated through a series of slits and imposed on a sample which can move in all three dimensions. Within the GV, the material scatters the x-rays where they are collected by an energy detector at a fixed angle.

The governing equation for EDXRD is given by
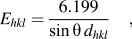 $${E_{hkl}} = {{6.199} \over {\sin \theta \,{d_{hkl}}}}\quad {\rm{,}}$$
where E is the energy in keV and d hkl is the interatomic spacing associated with the plane hkl measured in Angstroms. The photons are collected and their energy is measured using a germanium detector. The photon counts are then binned into 8192 channels using a multichannel analyzer. The energy calibration is done later by the use of LaB6 and CeO2 standards.
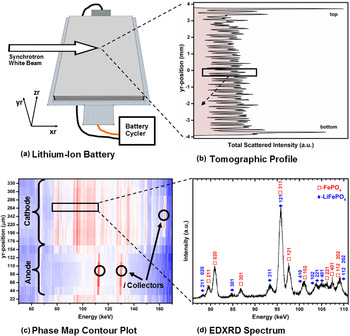
A Bragg angle of 2θ = 3° was used and the slits were arranged such that a GV with dimensions of approximately 3 mm × 3 mm × 30 µm is formed. The 30 µm height of the GV gives rise to a thickness that is commensurate with that of the individual electrode layer in the cell. This is important for phase-mapping ability because one is able to obtain a distinct signal from one electrode layer rather than multiple layers. The battery was carefully placed and leveled on a sample holder that can move in x, y, and z directions with accuracy of 0.1 µm. The orientation of the cell placement with respect to the beam is shown in Fig. 2(a). A very accurate tomographic profile of the cell was obtained and served as a map of the internal structure of the cell. This is achieved by scanning the GV through the entire thickness of the cell and then plotting the total scattered intensity as a function of position. Such a plot was used to calibrate the experiment and locate an area of interest. The tomographic profile is shown, along with the area of interest, in Fig. 2(b). With the cell fully charged, a sequence of 15 diffraction spectra were collected as a function of depth in the yr-direction. The area of study was in the body-center of the cell and the collection time for each spectrum was 45 s. Using a battery cycler (Arbin BT2000, Arbin Instruments, College Station, TX), the cell was then discharged at a constant current of 2 amperes which corresponds to a C-rate of C/5. Every 45 min, the discharge procedure was halted and, after a relaxation time of 5 min, depth profiles were taken. This procedure was repeated throughout the discharge cycle for a total collection of nine depth profiles.
Summary of the characterization capabilities of EDXRD as they relate to lithium-ion batteries. (a) Depiction of the lithium-ion battery in relation to the synchrotron beam along with the experimental coordinates. The cell is also connected to a battery cycler. (b) A tomographic profile of the internal structure of the cell is shown by plotting the total scattered intensity as a function of position. The plot is rotated to remain consistent with the experimental coordinates. (c) A contour plot of the scans across a selected region inside the cell is given for the purpose of phase mapping. The electrodes of the cell are identified as well as the current collectors. (d) A single EDXRD spectrum of an area within the cathode region. The Bragg reflections of two phases are labeled.

The relative amounts of FePO4 and LiFePO4 phases were determined semiquantitatively using a Gaussian peak-fitting routine found in the software, Fityk.Reference Wojdyr32 The FePO4 (020) and the LiFePO4 (311) reflections were chosen because they had the best combination of intensity and isolation from any other reflection. However, surrounding reflections were also fit to isolate their contributions. Additionally, since the GV is much larger than the crystallites measured, we assume there to be no texture related effects and a single reflection to be a good representation of the phase as a whole. The integrated intensities (area under the curve) of each peak were used to compute the weight fractions of each phase using the reference intensity ratio (RIR) method.Reference Chung33 In this analysis, the ratio of the intensities is weighted using their reference values (I rel) and their ratio to a known standard of corundum (RIRc) shown in the following equation. The I rel and RIRc values used for the analysis were 62.72 and 1.49 for FePO4,34 and 92.75 and 1.32 for LiFePO4 (Ref. 35), respectively. The mole fraction can then be calculated by dividing the weight fraction by the molar mass. Furthermore, showing the mole fraction of the FePO4 phase can be a convenient indicator of the remaining capacity in the volume measured, thereby leading to a spatially resolved phase mapping.Reference Liu, Kunz, Chen, Tamura and Richardson24 It is also important to note, since the analysis compares two phases within each spectrum, it negates any need to consider current-decay effects from the synchrotron ring when comparing different locations and time-points as long as the signal strength is sufficiently above the experimental noise as it was throughout the experiments.
After the synchrotron experiment, the fully discharged cell was disassembled in an argon-filled glove box. The approximate area of interest was cut away and mounted to a sample-stud using carbon tape. Images were taken for analysis using a field-emission scanning electron microscope (Zeiss).
III. RESULTS AND DISCUSSION
A summary of the measurements collected from the battery is shown in Fig. 2. As previously mentioned, Fig. 2(a) shows the orientation of the cell with the beam, and Fig. 2(b) shows the tomographic profile of internal layered structure. Figure 2(c) shows a diffraction contour plot with energy on the x-axis and position on the y-axis. In this plot, the cathode and anode regions of the cell are indicated as the characteristic Bragg lines of the current collectors. The cathode region is identified as a two-phase mixture of FePO4 and LiFePO4. Also in the cathode region is an aluminum current collector. The anode region can be seen with much fewer lines; identified as lithiated graphite and a copper current collector. We assume there to be some curvature of the electrode layers which would explain the small juxtaposition of the current collector and electrode phases. Figure 2(d) shows selected diffraction spectra from the contour map with the Bragg peaks of both lithiated and nonlithiated phases identified.
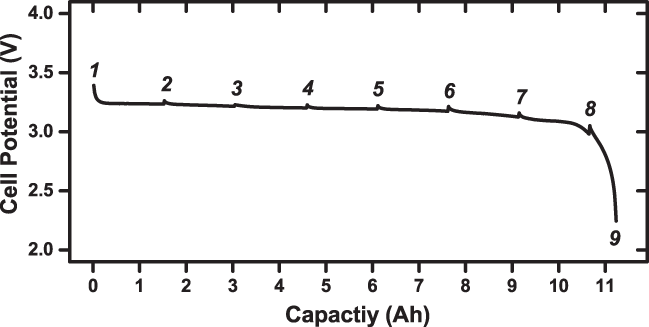
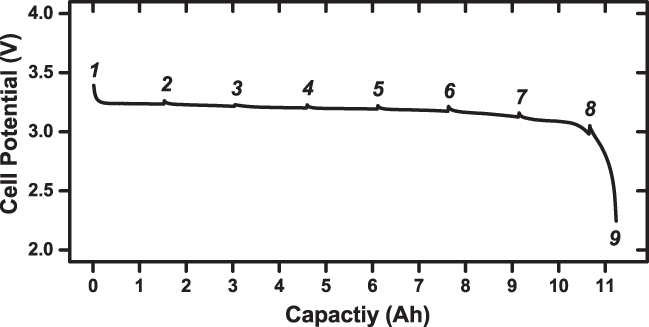
The cell potential curve during discharge is shown in Fig. 3. The numbers indicate the points at which the discharge was halted and diffraction spectra were collected. The cell provided a flat voltage profile which is indicative of the first-order phase transformation. Small drops in the voltage can be seen when the discharge starts after each scan which is caused by the internal resistance of the cell. The overall capacity of the cell is what we expected.
The cell potential as a function of capacity obtained when discharging the cell. The times at which the discharge was stopped and diffraction spectra collected are indicated by the numbers above the curve.
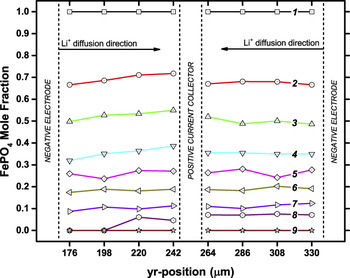
A more detailed phase mapping of the positive electrode is shown in Fig. 4. Here we show the space-time evolution of the electrode with the FePO4 mole fraction as a function of depth in the electrode. As the cell is discharged, the iron phosphate phase is converted to lithium iron phosphate by the diffusion of lithium ions into the cathode from the electrolyte, with an accommodating change of valence state of the Fe in the lattice. The variation of composition as a function of depth appears to be relatively linear in most scans. The only pronounced area where it is not is in scan number 8 where the edge closest to the separator and anode (lithium source) is fully lithiated. This shows evidence of lower diffusion mobility toward the later part of the discharge. Based on these data, it is not possible to say what exactly is limiting diffusion, but the fact that the diffusion mobility is only observed toward the end of the battery's discharge cycle, coinciding with where there is a larger deviation from equilibrium voltage, suggests that the two may be correlated. This is consistent with the model used by Farkhondeh et al. for bulk behavior dominated by heterogeneous conductive coatings on a poor electronic conductor.Reference Farkhondeh, Safari, Pritzker, Fowler, Han, Wang and Delacourt25
Time evolution of the iron phosphate mole fraction as a function of position (depth) in the electrode layer. As the cell is discharged, the iron phosphate phase is converted to lithium iron phosphate by the diffusion of lithium ions into the positive electrode from the negative electrode. The numbers of the lines indicate the time depicted in Fig. 3.

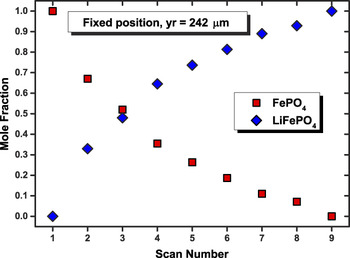
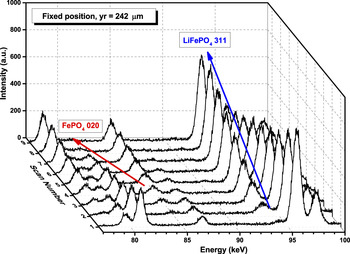
The data in Fig. 4 also show a deviation from ideal-stoichiometric behavior in the electrode, similar to that of the previously hypothesized asynchronous phase transformation. Since the cell was discharged at a constant current and the diffraction spectra were taken at equal intervals, we expected to see a linear response in the transformation of FePO4 to LiFePO4; a 1:1 relationship of Li+ to e−. However, after the first discharge interval, the amount of FePO4 converted to LiFePO4 was approximately 30%. This number appears to decrease as the battery is discharged further. Additionally, the time and space mapping shows that the observed asynchronous electrode utilization phenomenon appears consistent throughout the depth of the electrode. Since the effect is consistent throughout the electrode, we decided to plot just the evolution of both phases in the region in electrodes center. This is shown in Fig. 5 where the asynchronous response can be seen more clearly. A waterfall plot of the nine diffraction spectra used for the RIR analysis is shown in Fig. 6. The peaks used for analysis, FePO4 020 at ∼81 keV and LiFePO4 311 at ∼93 keV, are labeled and show suitable intensity for the analysis.
Mole fraction of FePO4 and LiFePO4 phases at the position which is centrally located in the electrode. The measured fractions of each phase show the asynchronous electrode utilization behavior.

Waterfall plot of the 9 spectra collected in a fixed position at 242 μm, which is approximately the center of the electrode depth. The FePO4 (020) and LiFePO4 (311) peaks are labeled, indicating the reflections used for the mole fraction analysis.

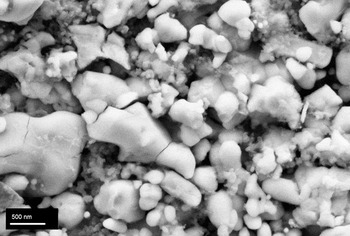
Figure 7 shows a field-emission scanning electron micrograph of the positive electrode from the disassembled sample. The iron phosphate cathode powder appears to have nanosized grains but also larger grains and agglomerations. Additionally, the particles appear to be quite heterogeneous with a fairly broad size distribution and varying morphologies. Evidence of fracturing also suggests the presence of electrochemical-induced strains which can occur from the volume changes associated with lithium intercalation. We postulate that the material heterogeneity contributes to a spatially heterogeneous reaction-front within the electrode, thus influencing a localized asynchronous response.
Scanning electron micrograph of the positive electrode. The sample was obtained by disassembling the fully discharged cell under a glove box and cutting away the area of the cell that was measured. The image shows a heterogeneous powder with fractured grains and a broad size distribution.

While we observe the asynchronous electrode response, the origins of which still remain elusive. We postulate that the asynchronous response is a localization phenomenon, the result of variances in the electrode/electrolyte/current-collector interfaces and/or the surface treatments of the particles. This is certainly possible considering the measurements presented in this study represent less than 1% of the total contributing electrode. Powder heterogeneity observed by electron microscopy further corroborate a localization phenomenon. However, additional experiments are required to fully determine the origin of asynchronous behavior. Further experiments where we investigate different areas of the cell are under way. If we observe the asynchronous response in one area and a complementary behavior in another, we may be able to confirm that it is a localization phenomenon caused by heterogeneous microstructure and conductive contact, provided that the areas average out to a more linear electrode response.
IV. CONCLUDING REMARKS
We have conducted operando EDXRD measurements on a full-sized lithium iron phosphate battery and a succinct overview of the measurement capabilities is given. Spatially and temporally resolved phase mapping was achieved at nine different time points while discharging the battery. A mole fraction phase analysis using the RIR method was completed for the positive electrode. The results show limited diffusion toward the end of the discharge cycle as well as an asynchronous electrode utilization response. The results confirm that the asynchronous behavior is not just an artifact of in situ cell designs but occurs in fully assembled batteries as well. We attribute this behavior to be a consequence of performing a local measurement over a wide-area heterogeneous reaction.
Supplementary Material
To view the supplementary material for this article, please visit http://dx.doi.org/jmr.2014.321.
ACKNOWLEDGEMENTS
Use of the National Synchrotron Light Source, Brookhaven National Laboratory, was supported by the U.S. Department of Energy, Office of Science, Office of Basic Energy Sciences, under Contract No. DE-AC02-98CH10886.