Introduction
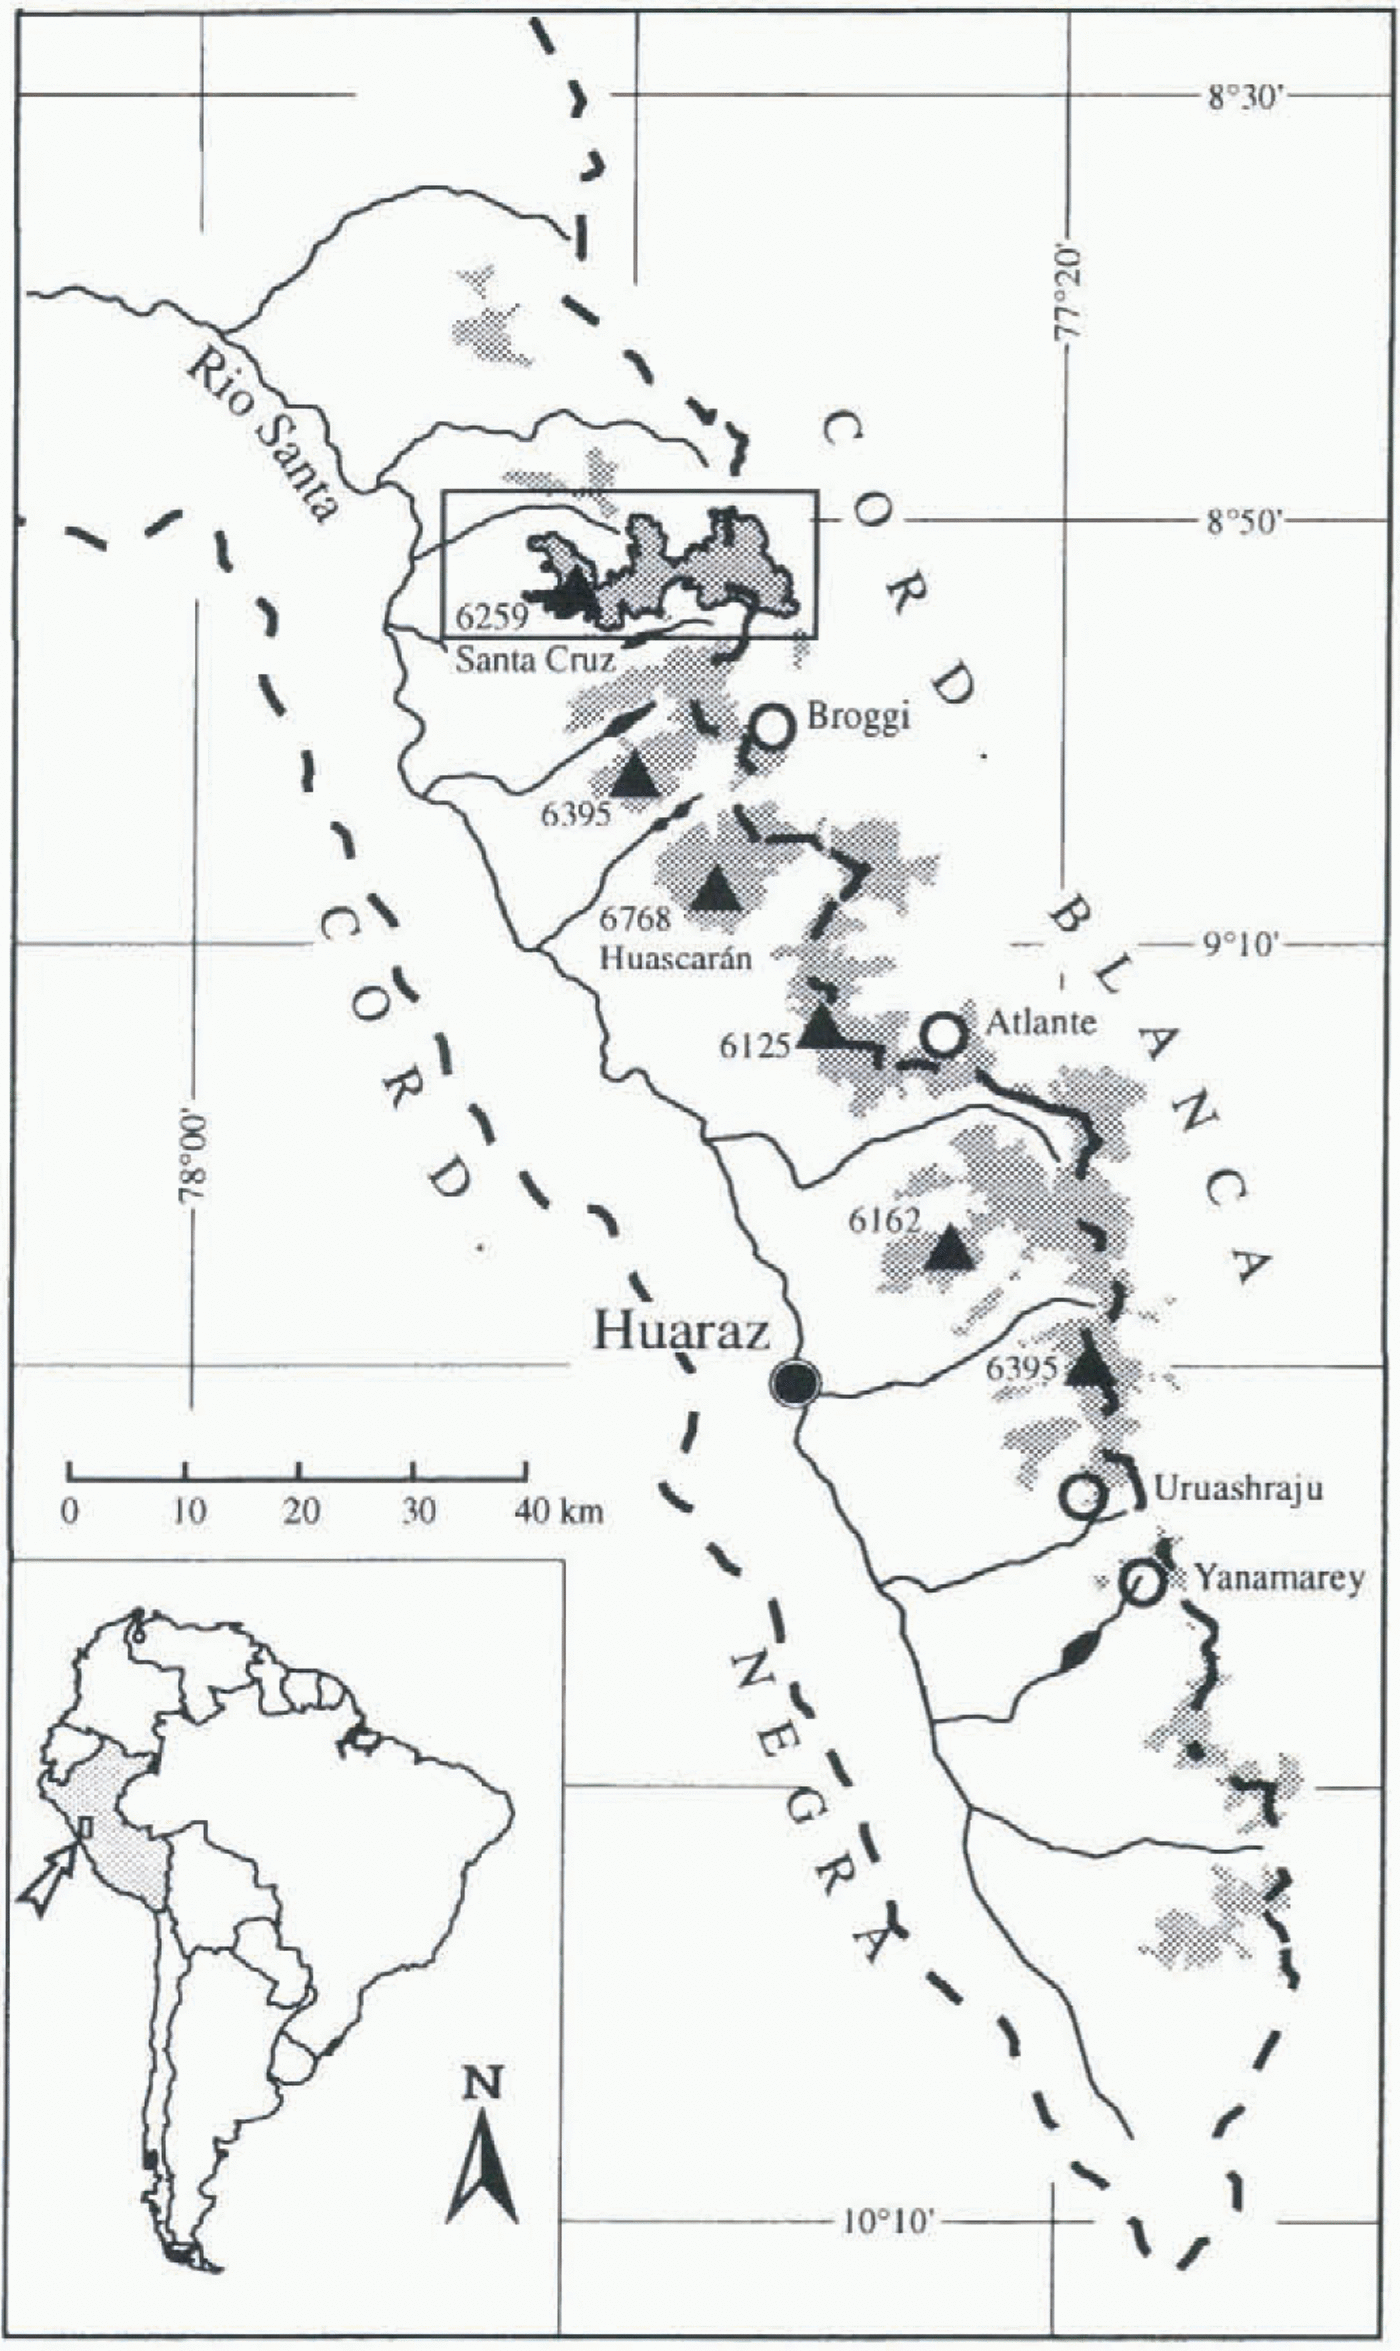
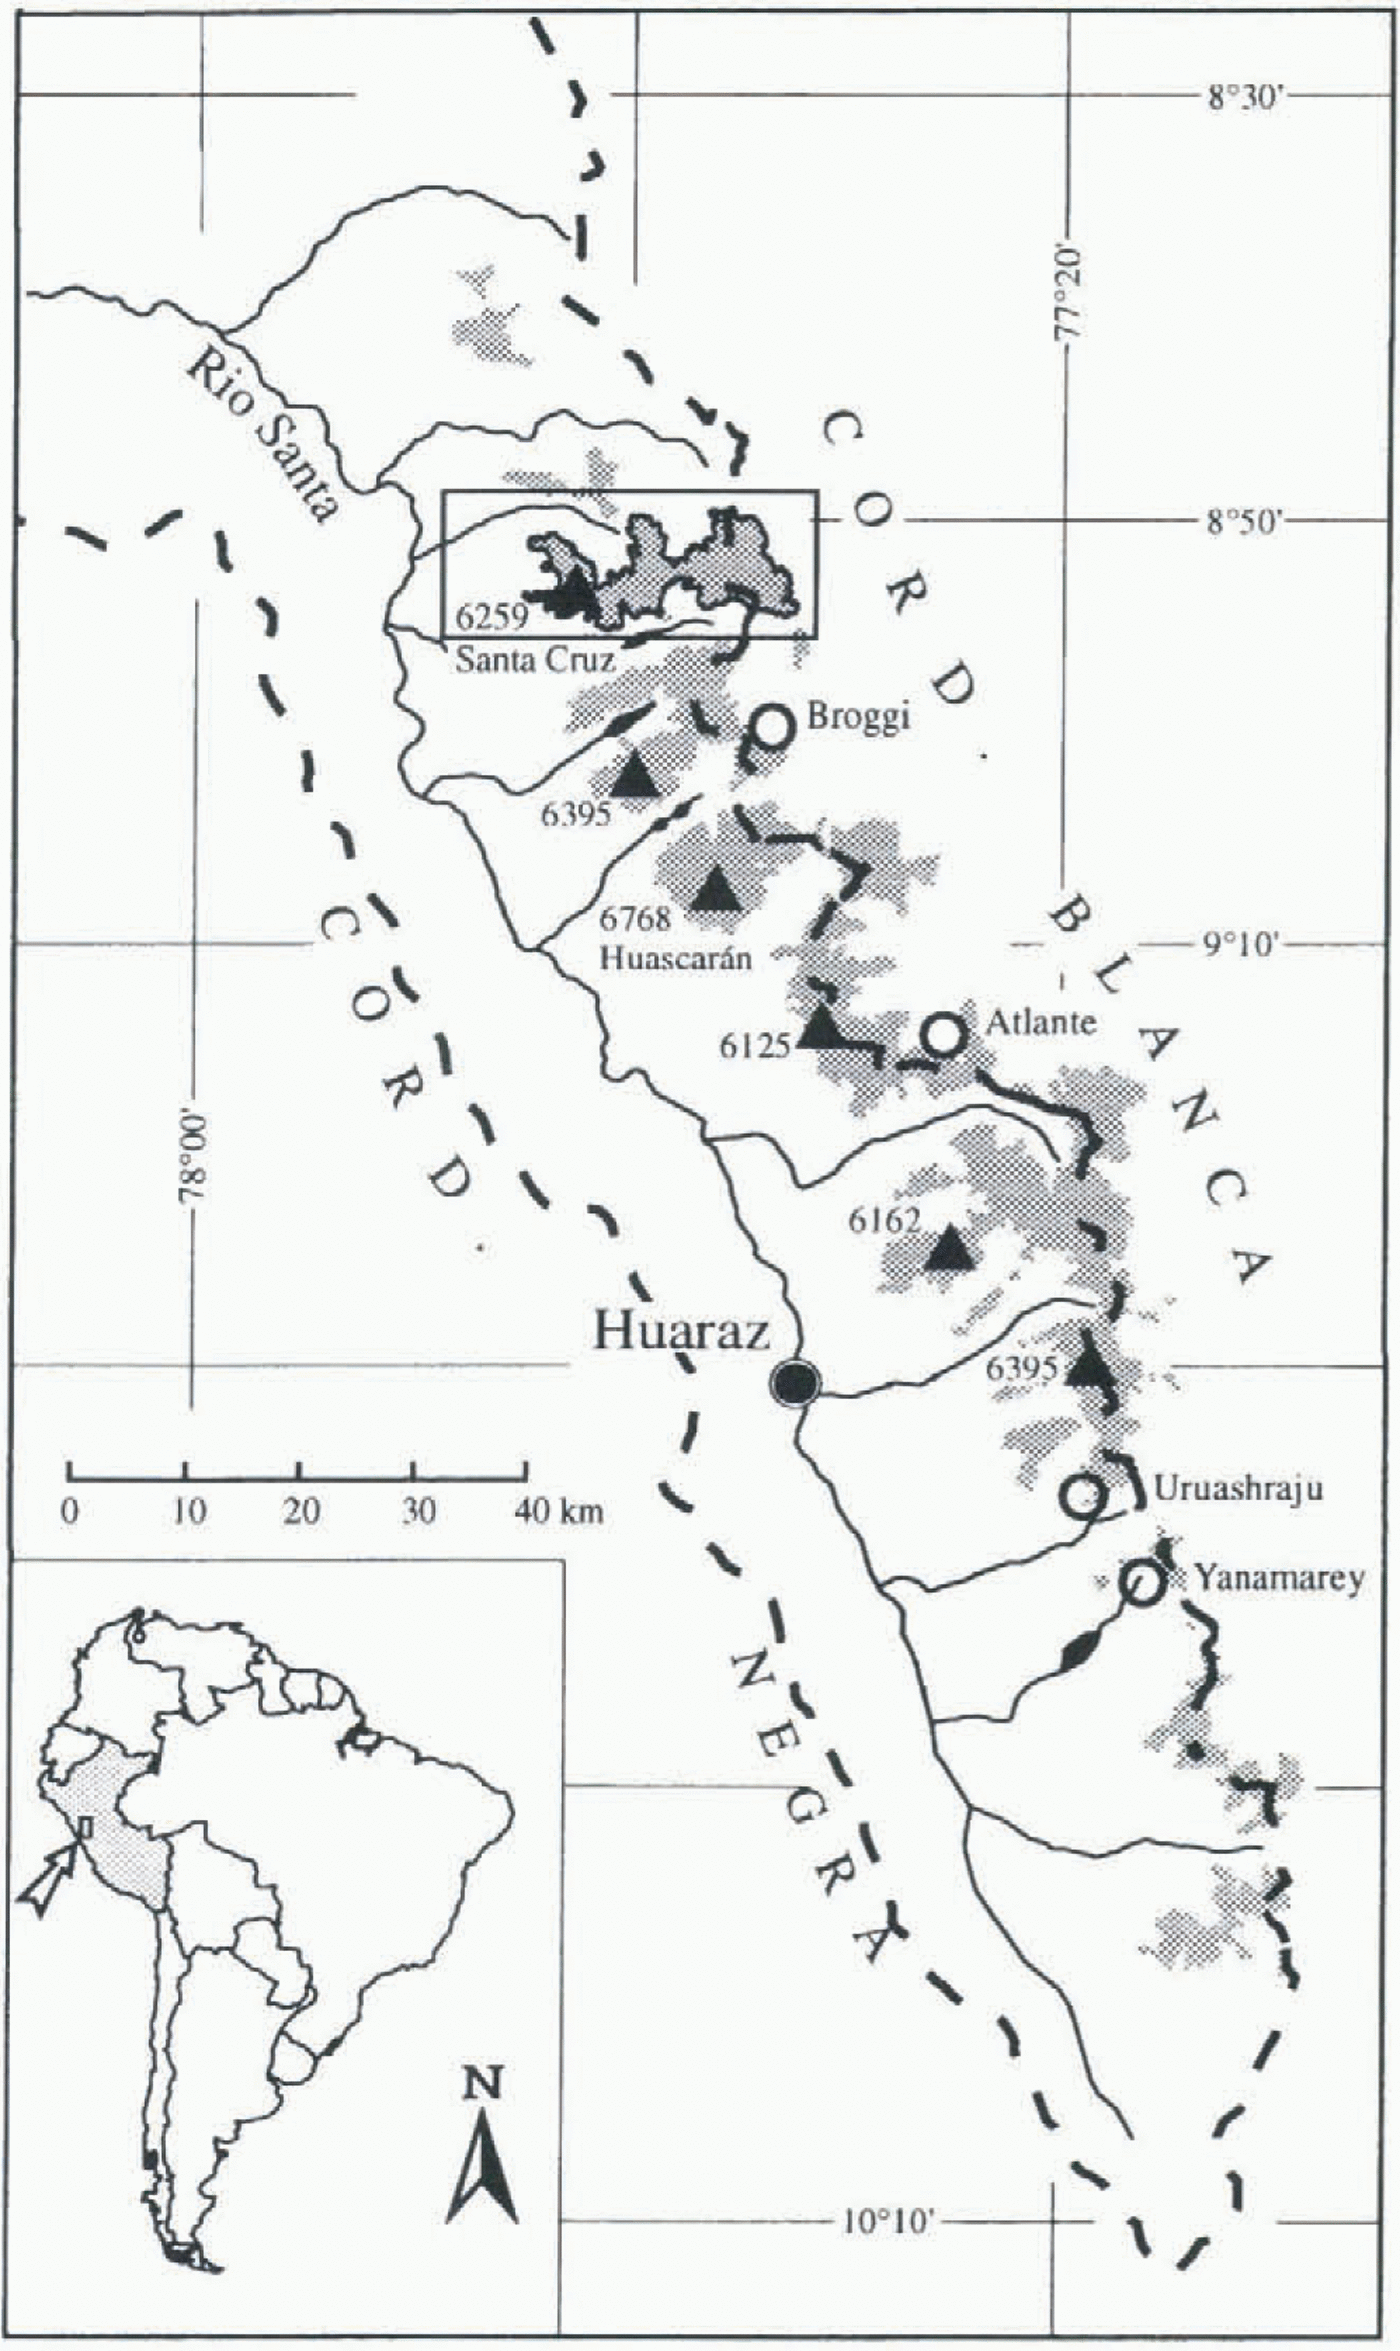
The tropical Cordillera Blanca stretches 130 km from 8°30′ to 10° S and reaches 6000 m a.s.l. at several summits. The highest mountain is Nevado Huascarán Sur at 6768 m a.s.l. (Fig. 1).
The climate is typical for the outer tropics. It is characterized by relatively small seasonal but large daily temperature variations, and the alternation of a pronounced dry season (May–September) and a wet season (October–April). The wet season brings 70–80% of the annual precipitation (Johnson, 1976; Kaser and others, 1990; Niedertscheider, 1990). The hygrometric seasonality is caused by the oscillation of the intertropical convergence zone (ITCZ). As is typical for the tropics, the precipitation processes are characterized by the combination of a large-scale advection of humid air from the east (i.e. the Amazon river basin) and locally induced convective cells. The Cordillera Blanca is, in any case, a significant barrier in the easterly–southeasterly atmospheric circulation of tropical South America.
As on all Peruvian Cordilleras, the glaciers on the eastern slopes of the Cordillera Blanca extend to generally lower elevations than those on the western slopes. Kinzl (1942) was the first to suggest higher precipitation amounts in the cast as a reason for lower snowlines. Modern snowlines or equilibrium-line altitudes (ELAs) have never been studied. The present paper concentrates on the following problems across the Cordillera Blanca:
How large are the spatial differences of the ELAs?
How large are eventual spatial differences of fluctuations of the ELA (∆ELAs)?
What are the climatic causes for the spatial pattern of ELA and ΔΕΕΑ?
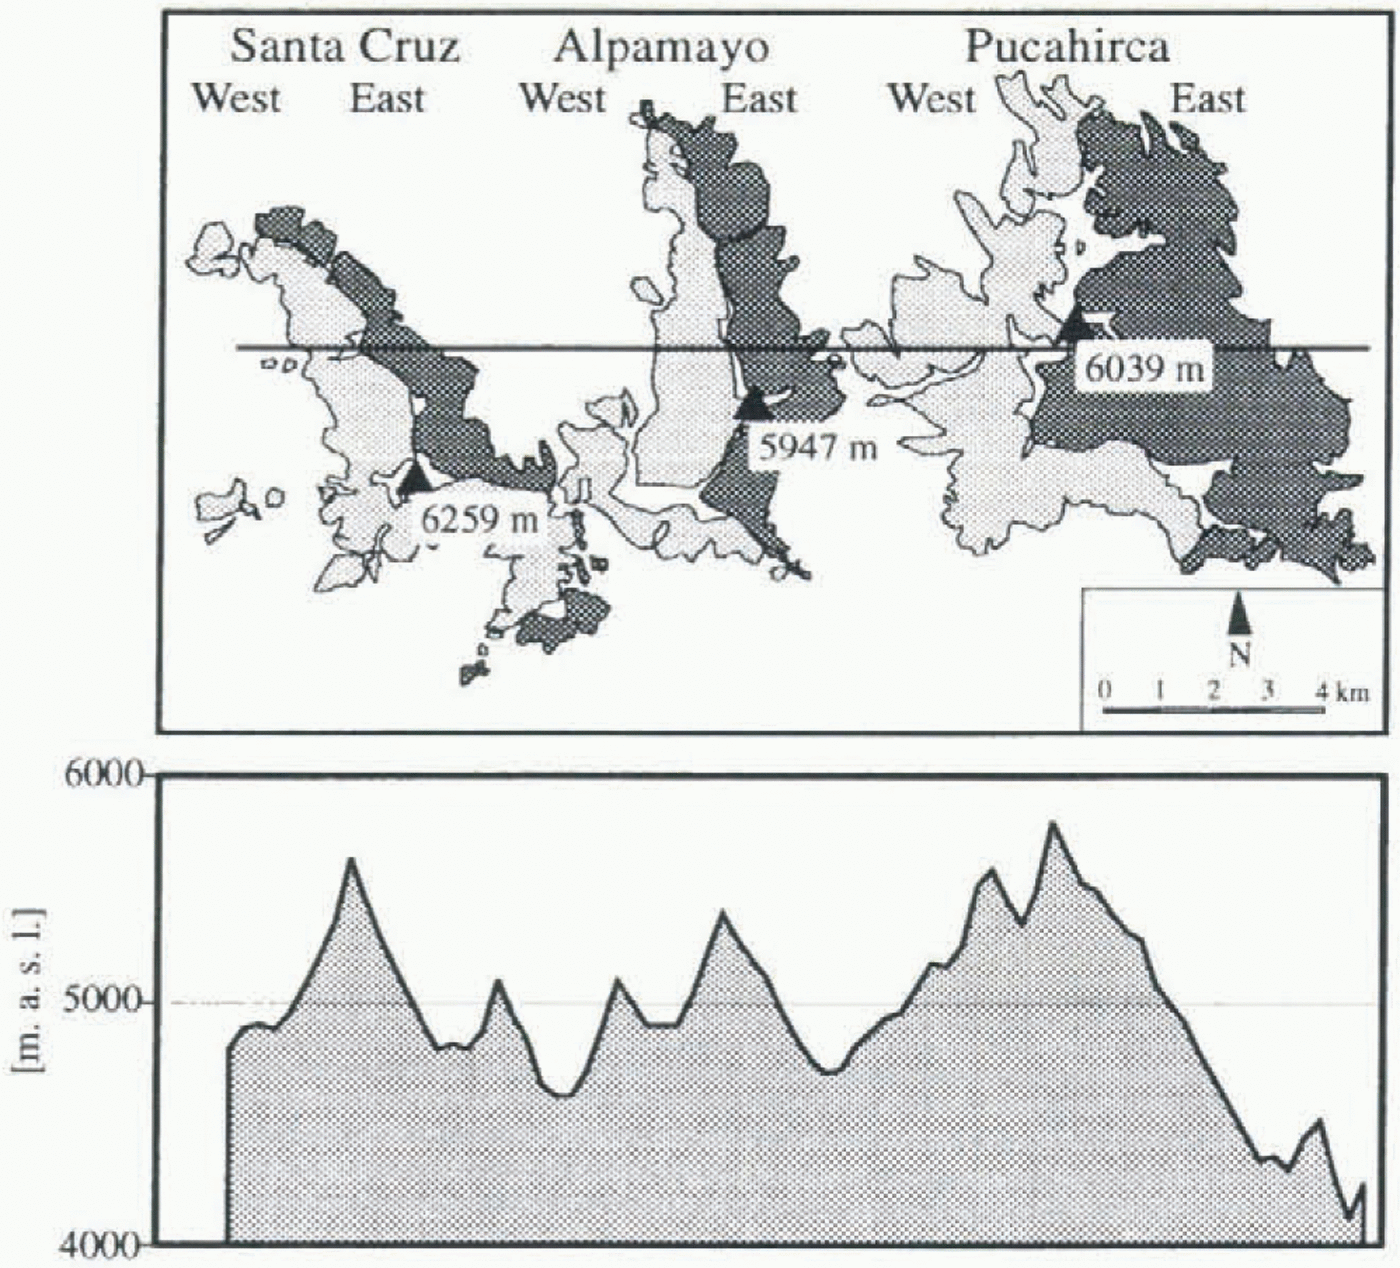
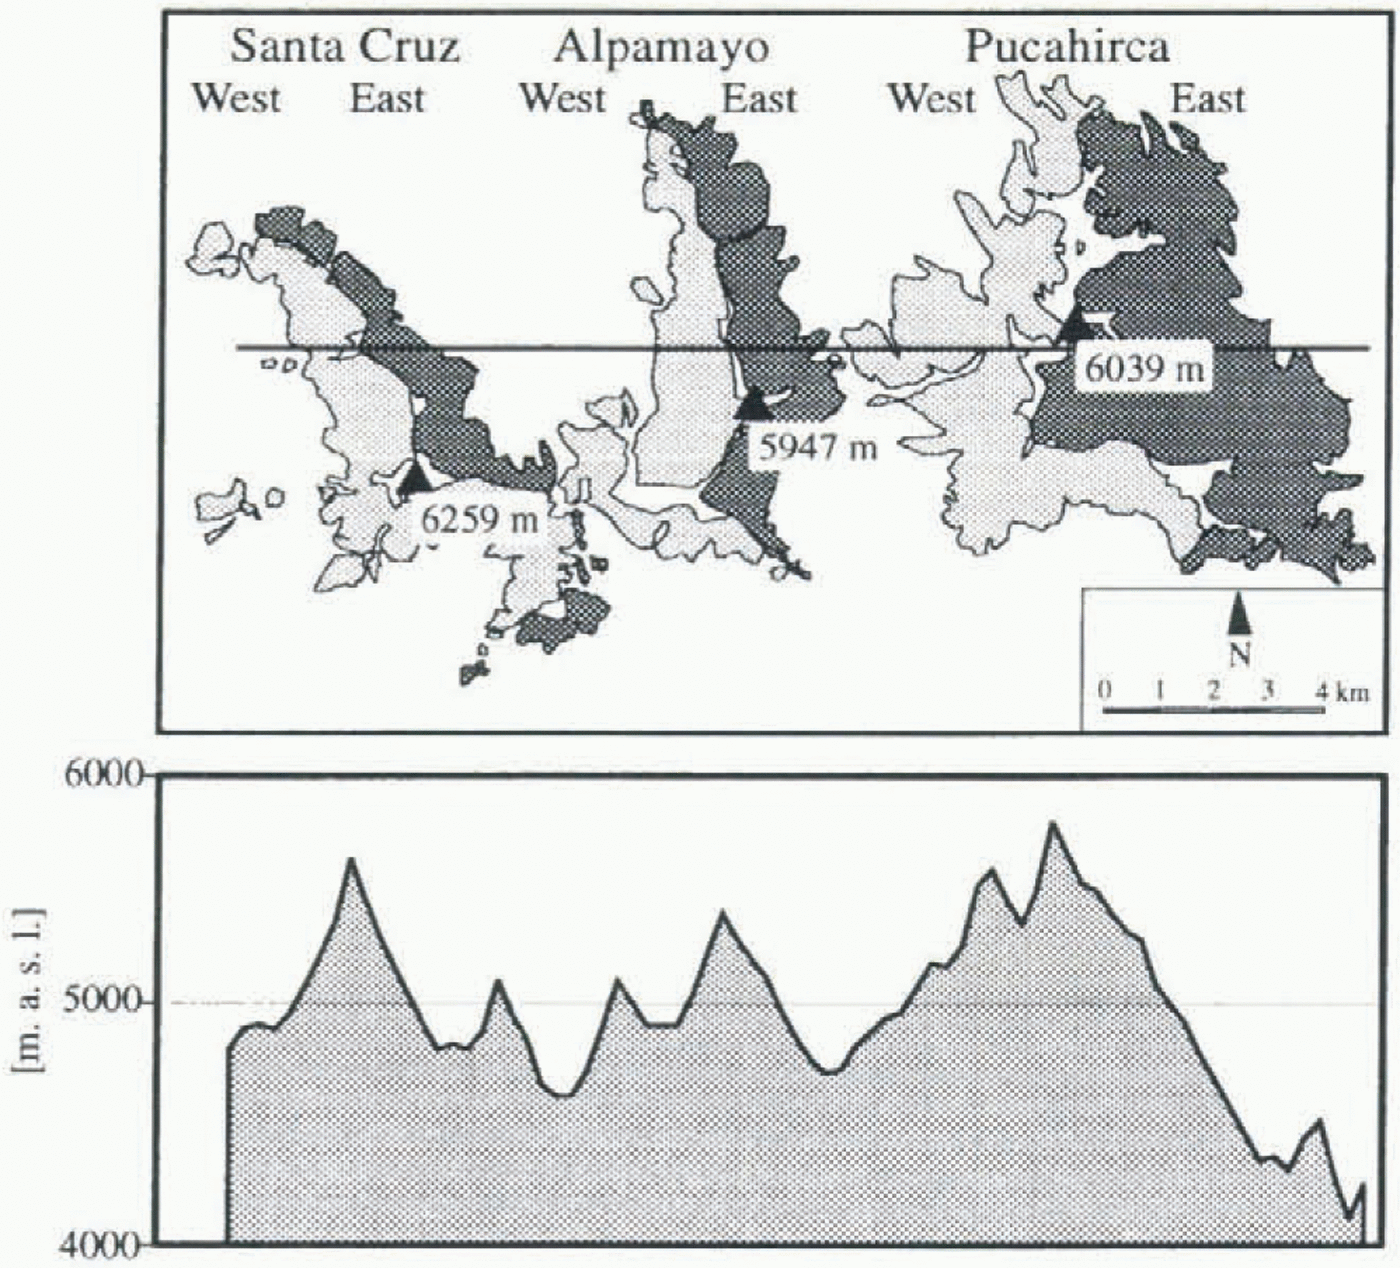
For these investigations the massif of Santa Cruz–Alpamayo–Pucahirca was chosen. It is situated in the northern part of the Cordillera Blanca, and its main ridge shows the largest east–west extension within the Cordillera Blanca (Fig. 1). Three short south–north running ridges subdivide the mountain group into six glacierized basins: Pucahirca east and west, Alpamayo east and west and Santa Cruz east and west (Table 1; Fig. 2).
As a data base for this study a set of vertical air photographs taken in 1948 and 1950 (SAN project 2524) are available. They cover the entire massif under clear sky conditions, whereas more recent vertical air photographs from 1962 and 1970 suffer from gaps in the chosen area. The glacier extent in 1948/50, as well as one indicated by the youngest moraines, was drawn onto a 1:25 000 contour line map (Dirección Generál de Reforma Agraria y Asentiamiento Rurál, 1972: map sheets Nevado Alpamayo, Yanacollpa, Nevado Pucaraju and Huaripampa) and analyzed using a geographic information system (GIS). The ELAs were obtained using the accumulation area ratio (AAR) method.
Climatic records are not available from the wet eastern side of the Cordillera Blanca, and those of the western Rio Santa catchment basin only date back to 1949. Thus, climatological interpretations are made on the basis of an ELA–climate model.
Modern glacier fluctuations in the cordillera blanca
For many centuries, human activities in the Cordillera Blanca have been strongly linked to the glaciers, in both a useful (e.g. Kinzl, 1944) and a threatening way (e.g. Lliboutry and others, 1977a; Patzelt, 1983). Nevertheless, glaciological investigations,
Index map of the Cordillera Blanca. Broken lines indicate the watershed, of the Rio Santa basin; dotted areas indicate the glacier extension. A solid line surrounds the Santa Cruz–Pucahirca glaciers. Triangles show the chain of the highest summits. Circles indicate glaciers to which the paper refers.
with the exception of a few descriptive reports, did not start until the 1930s. Even then they were frequently interrupted, mainly for political and economic reasons (a comprehensive overview of the glaciological investigations is given by Ames and Francou (1995)). The last survey of the entire glacial extent dates back to 1970 when air photographs were taken in the aftermath of the destructive earthquake of 30 May 1970 (Patzelt, 1983). With a surface area of approximately 720 km2 (glacier inventory 1970 by Ames and others (1988)), the glaciers of the Peruvian Cordillera
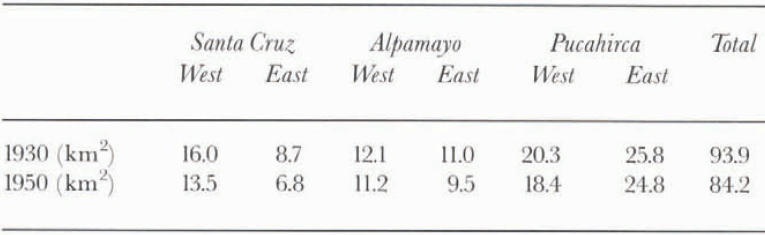
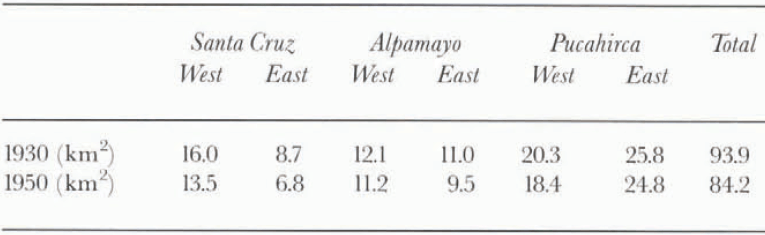
Glaciated surface area of the Santa Cruz–Pucahirca ridge in 1930 and 1950
The six glacierized areas in the Santa Cruz–Pucahirca range. Highest peaks are indicated. The cross-section follows the line on the map.
Blanca represent more than 25% of all tropical glaciers (Kaser and others, 1996b).
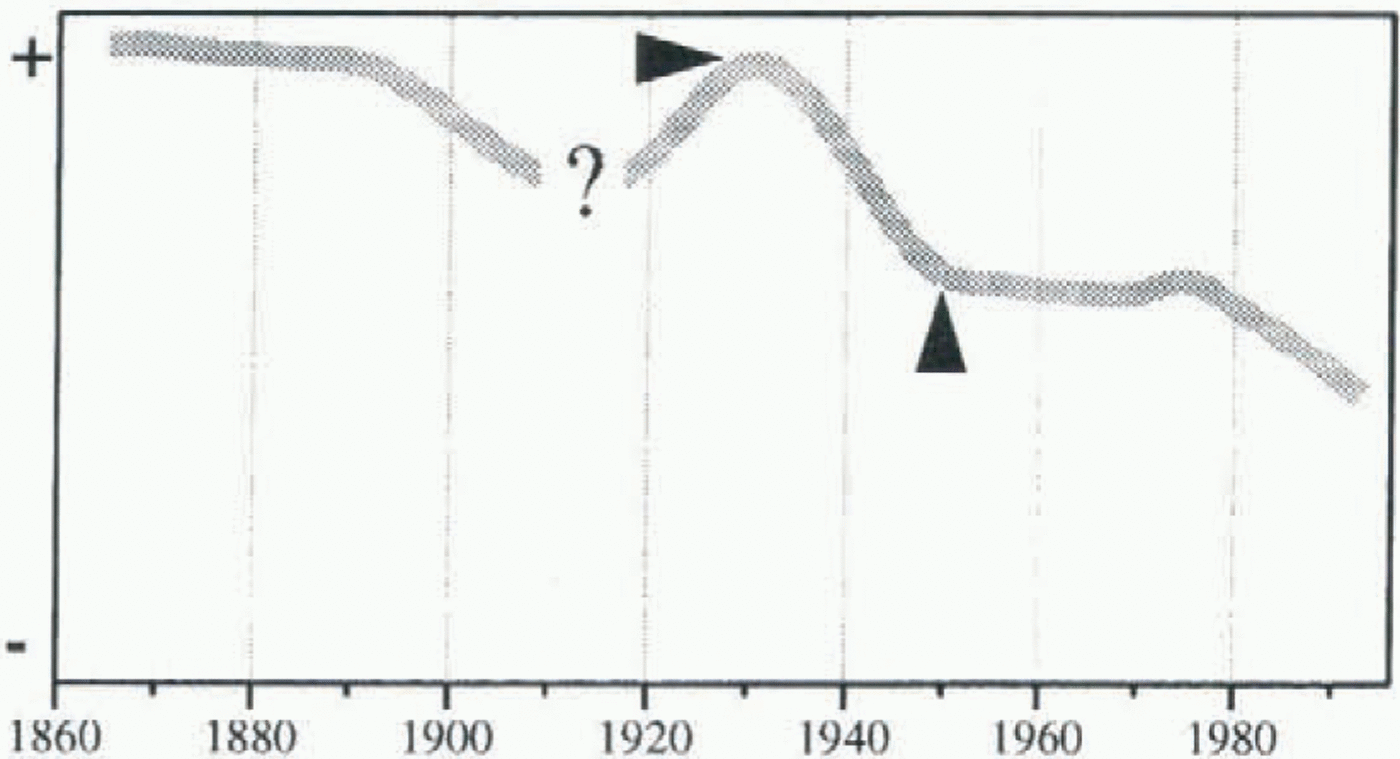
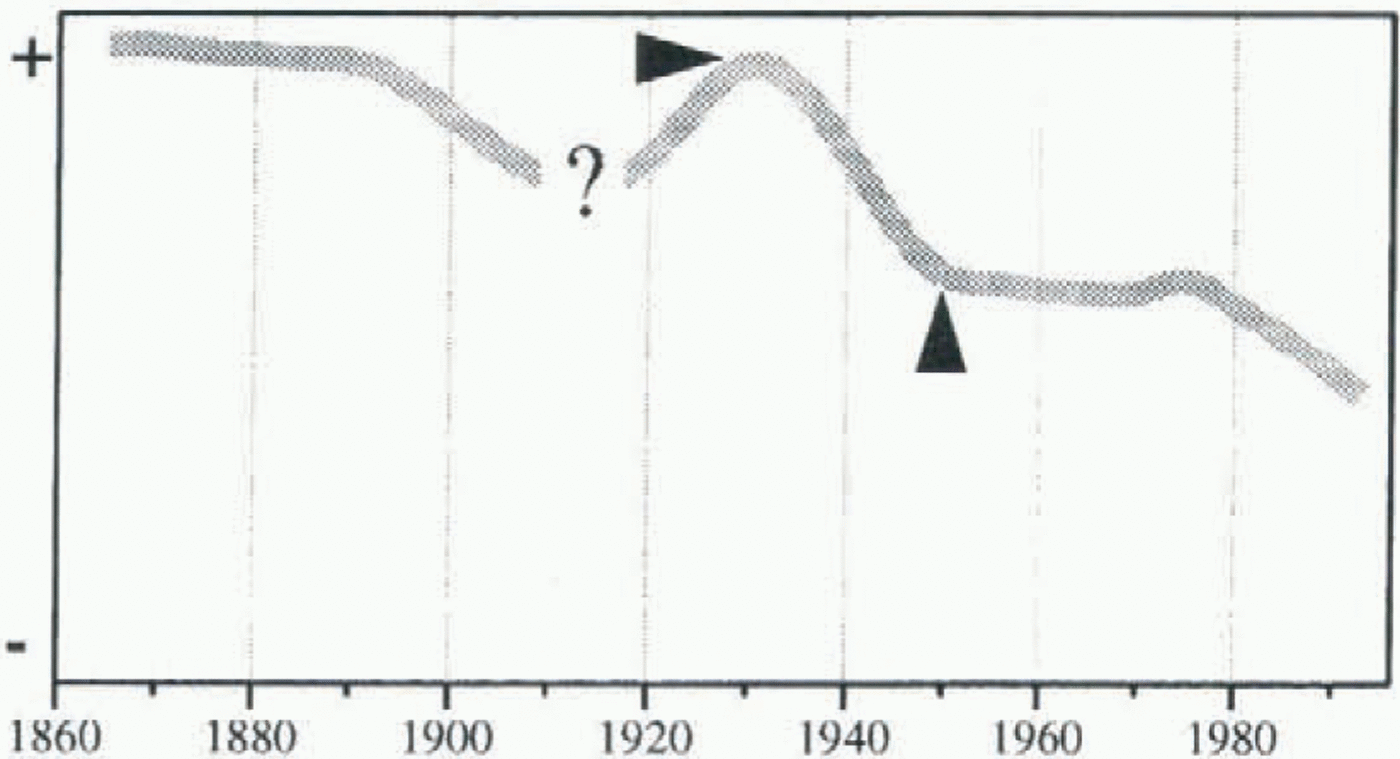
Knowledge of modern glacier fluctuations in the Cordillera Blanca is poor compared to the mid-latitudes. The approximate variations of the glacial extent in the Cordillera Blanca are shown in Figure 3. A Little Ice Age extent is marked by prominent moraines. The retreat from it began in the 1870s and accelerated after 1890 (Spann, 1948). A short readvance in the 1920s is reported by Kinzl (1942), Broggi (1943) and Spann (1948). It is indicated by fresh, small moraines in the 1948/50 air photographs. Some limited observations were made by miners at Glaciar Atlante (Kinzl, 1942). After the advance, the glacier extent held its position between 1924 and 1927 and then started to retreat. In the Huascarán massif (Fig. 1) the retreat began in 1931 (Broggi, 1943). In that massif the areal loss since the 1920s advance was determined by Kaser and others (1996b). It amounted to −16% (59 vs 71 km2) in 1950 and only an additional −1.8% (58 km2) in 1970 (1950 extension: Kaser and Georges, unpublished data). The glacier extent in 1962 as shown in the air photographs cannot be distinguished from that in 1970. After 1970 the measured variations of selected tongues give the only information about the most recent glacial fluctuations. Two of them, Glaciares Yanamarey and Uruashraju in the southern Cordillera Blanca (Fig. 1), show a minor advance
A qualitative approximation of modern glacier fluctuations in the Cordillera Blanca. Arrows indicate two different quasi-stationary (after Georges, 1996).
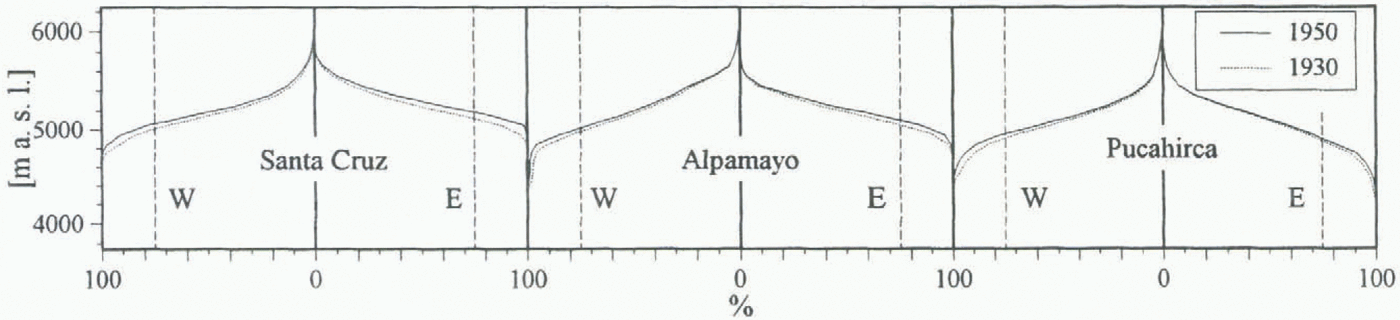
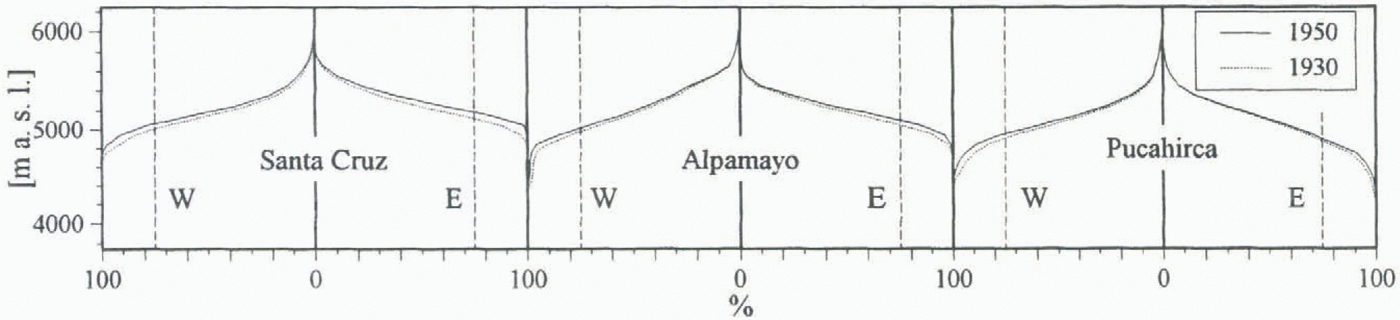
The hypsographic curves for the glacier extent in each basin and for the two quasi-stationary situations in 1930 and 1950. Vertical broken lines mark the AAR = 0.75.
between 1974 and 1979, Glaciar Broggi a halt in retreat. After 1979 all of them were retreating markedly (Kaser and others, 1990; Ames and Francou, 1995).
Both glacier extents (1930 and 1950) which were determined for the Santa Cruz–Pucahirca range represent quasi-stationary situations and make, therefore, a climatological interpretation possible. The earlier one is characterized by a short advance ending around 1930. Assuming the same kind of behaviour as on Huascarán, the later one was reached around 1950 and did not change markedly until the 1980s. The areal loss in the Santa Cruz–Pucahirca massif amounted to −10%, from 93.9 km2 in 1930 to 84.2 km2 in 1950 (table 1).
Principal Behaviour of Tropical Glaciers
The mass-balance regime of outer tropical glaciers is described by Kaser and others (1996a). Mass accumulation takes place only during the wet season and predominantly in the upper parts of the glaciers, whereas ablation occurs throughout the year. Thus, the vertical budget gradient is much stronger on tropical tongues than on those in the mid-latitudes (Lliboutry and others, 1977b; Kaser and others, 1996a). Consequently, under equilibrium conditions, tropical ablation areas are markedly smaller and the AAR has to be considered larger than in the mid-latitudes (Kaser, 1995). Since detailed studies on low-latitude AARs are lacking, we assume a mean value of AAR = 0.75 for the Cordillera Blanca.
Little is known about the response time of Cordillera Blanca glaciers. Compared with mid-latitude glaciers, however, the strong vertical-budget gradients cause quite an immediate reaction by the glacier tongues to a rise in the ELA (Kaser, 1995).
Application of the AAR Method
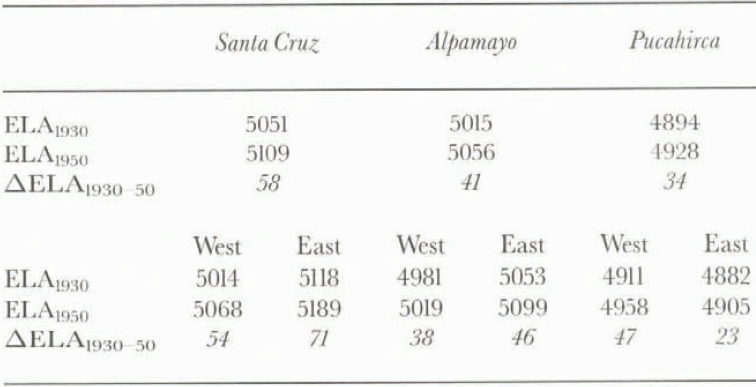
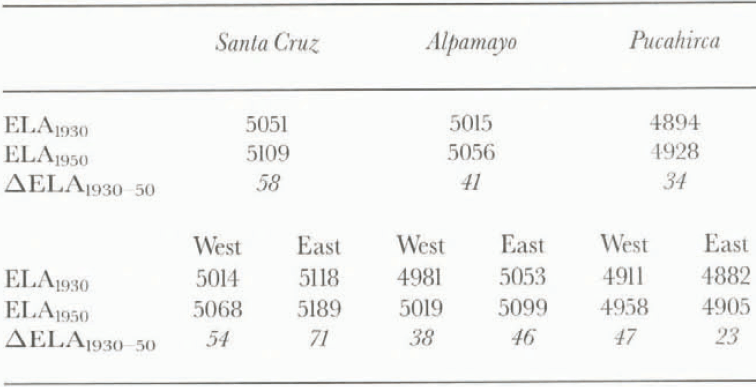
Under certain conditions a mean ELA of a stationary glacier or a glaciated area can be determined by the application of an AAR to the hypsographic curve (Kerschner, 1990). Within the altitudinal range of possible ELAs, (a) the increase of surface area with altitude must have its maximum, and (b) the hypsographic curve must be linear. This is rarely the case on single glaciers, but if one looks at a glacierized basin or an entire mountain massif as a whole, the boundary conditions are met quite well. This is the case in all six glacierized basins of the Santa Cruz–Pucahirca range (Fig. 4). Deviations from the above-mentioned AAR of 0.75 may affect the absolute positions of the ELAs to a certain extent, but have only a minor effect on the determination of their vertical shift (∆ELA) between two stationary situations. The ELAs for 1930 and 1950 as well as the vertical shift ΔΕLΑ1930–50 for the six basins are shown in Table 2.
Spatial Variation of the ELAs
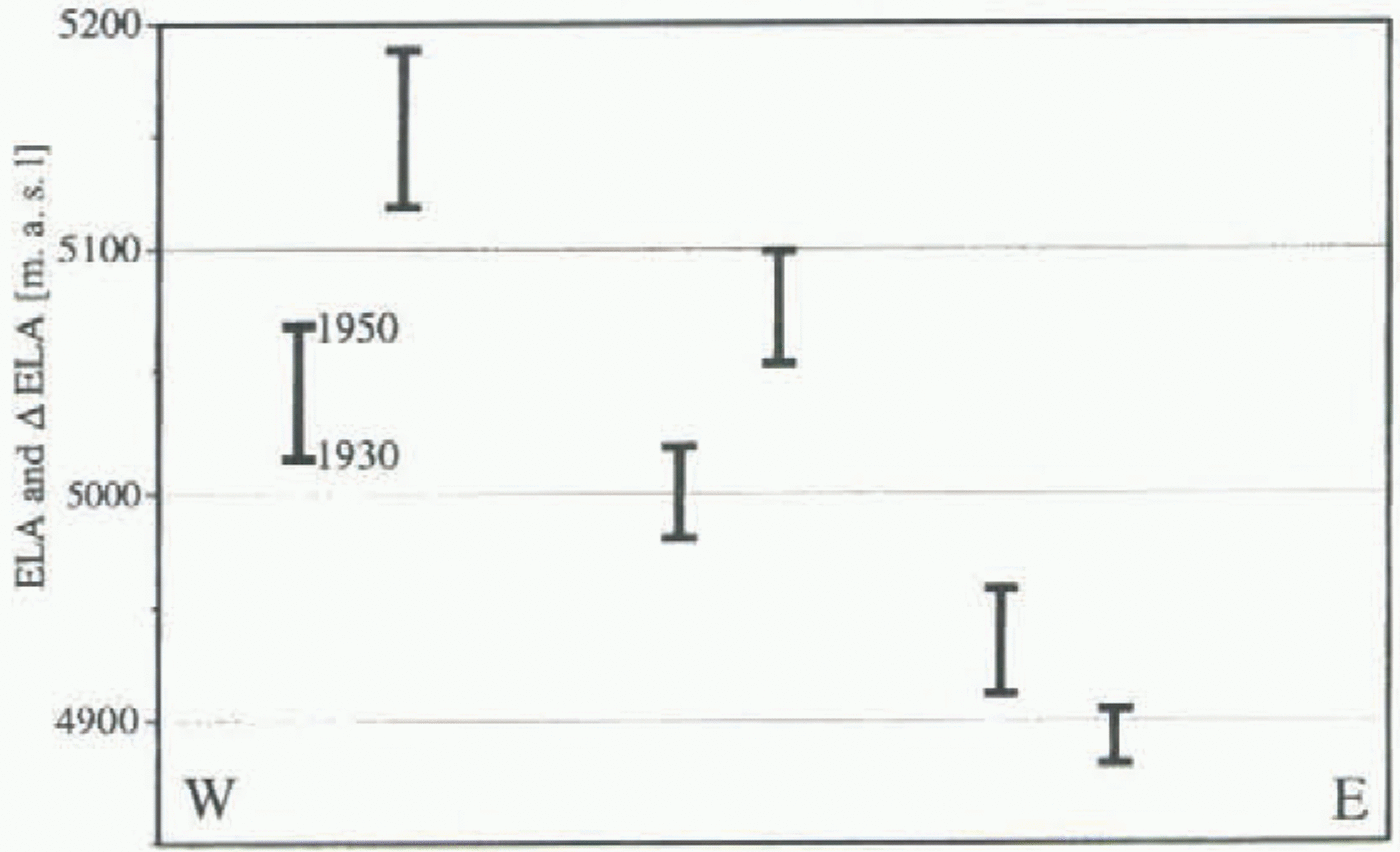
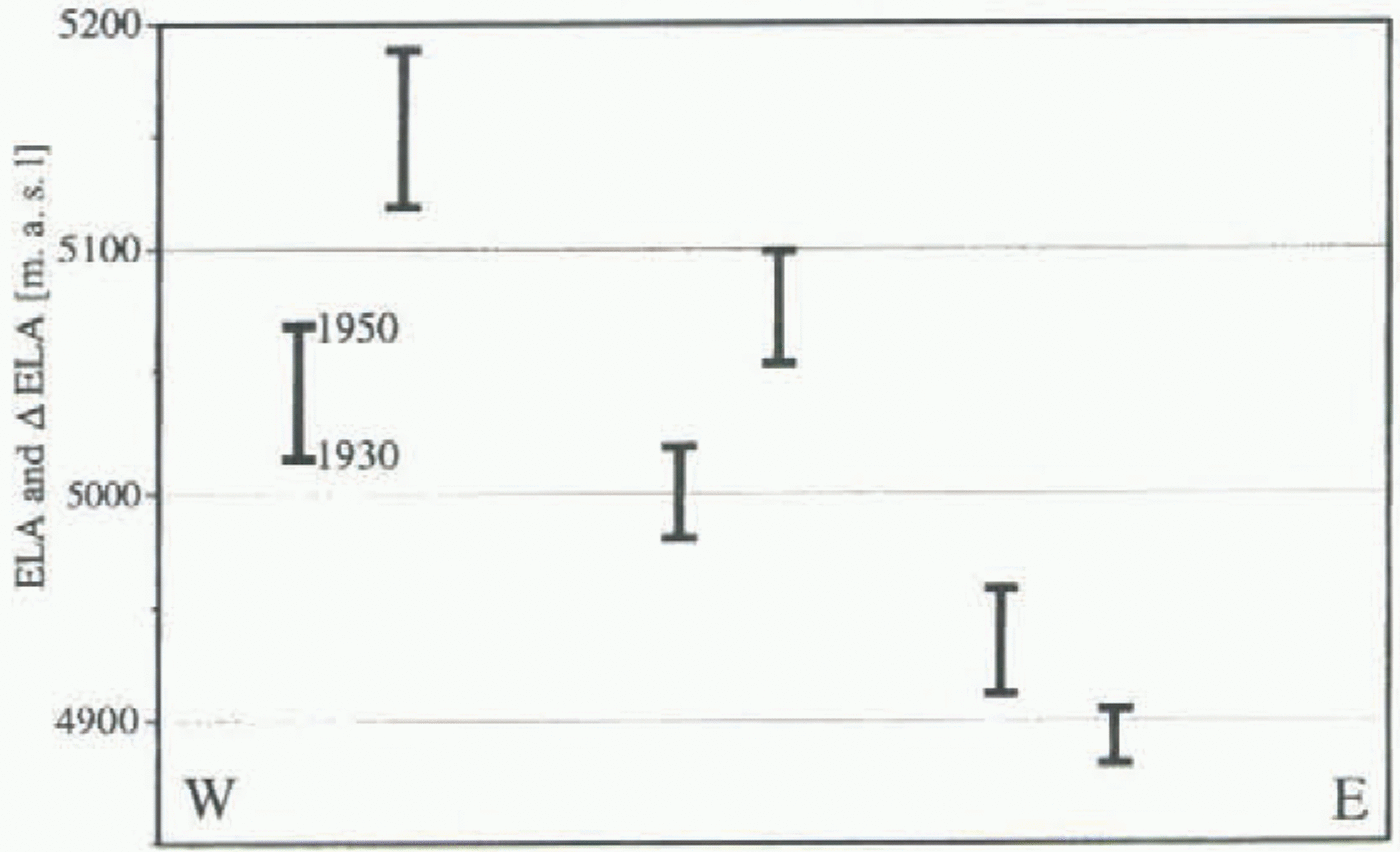
The spatial pattern of the ELAs (Table 2; Fig. 5) shows for both situations (1930 and 1950) that:
the ELAs are lowest on Nevado Pucahirca and highest on Nevado Santa Cruz; but,
Alpamayo and Santa Cruz have the higher ELAs on their eastern slopes.
This ELA pattern can be explained by the peculiarities of atmospheric circulation in the tropics:
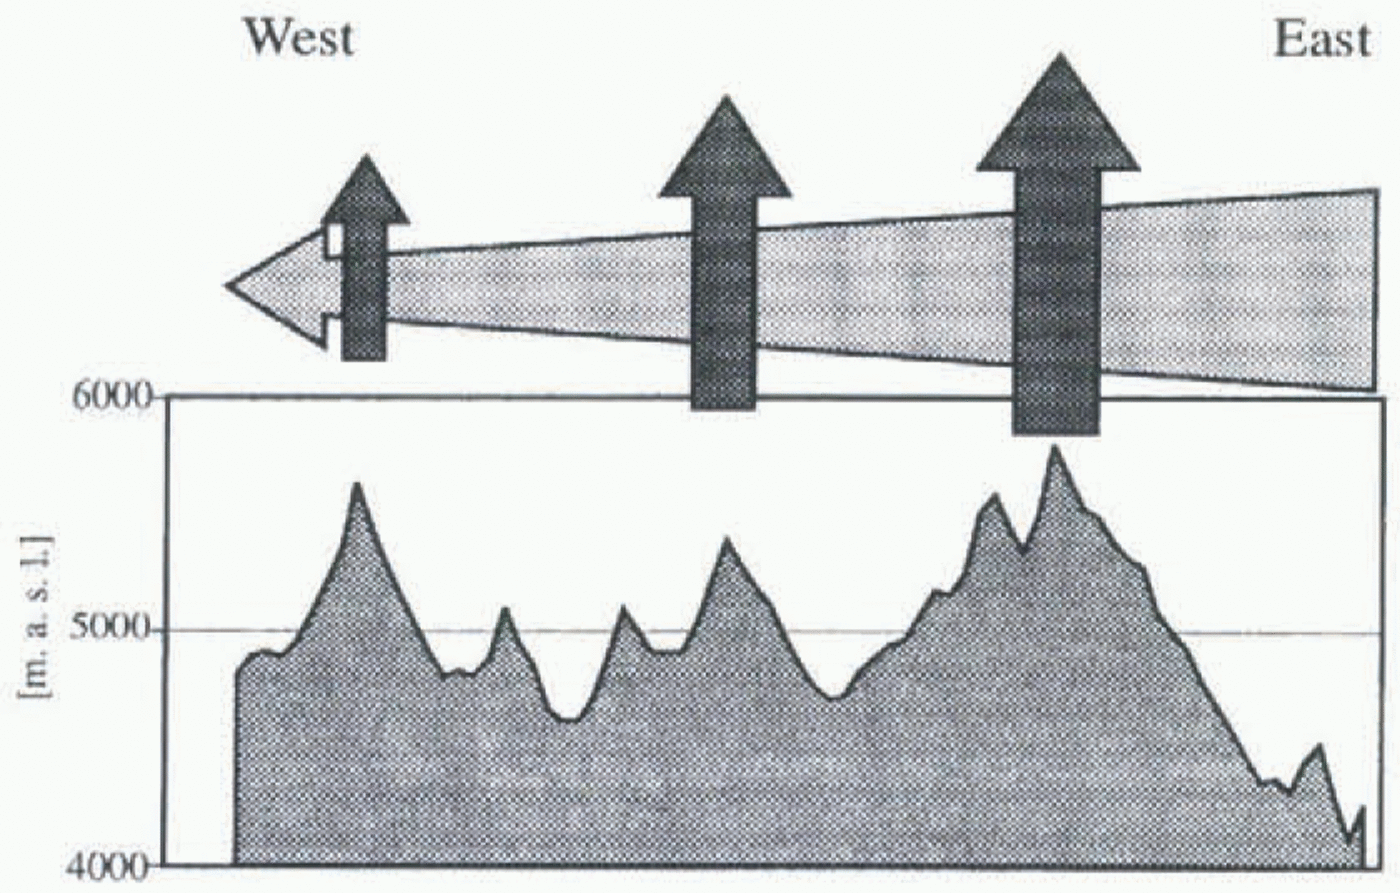
(a) Humid air is almost exclusively advected from the east, and thus convective activity decreases to the west (Fig. 6). Consequently, the accumulation also decreases from east to west, and this is one reason for the tendency of ELAs to rise from cast to west. Precipitation measurements from the inner Cordillera Blanca and its eastern slopes are missing, but large-scale gradients hold good. The gradient between Tingo Maria (φ = 09°08′ S, λ = 75°57′ W) and Chiclayo (6°47′ S, 79°50′ W) is more than 3000 mm (Johnson, 1976).
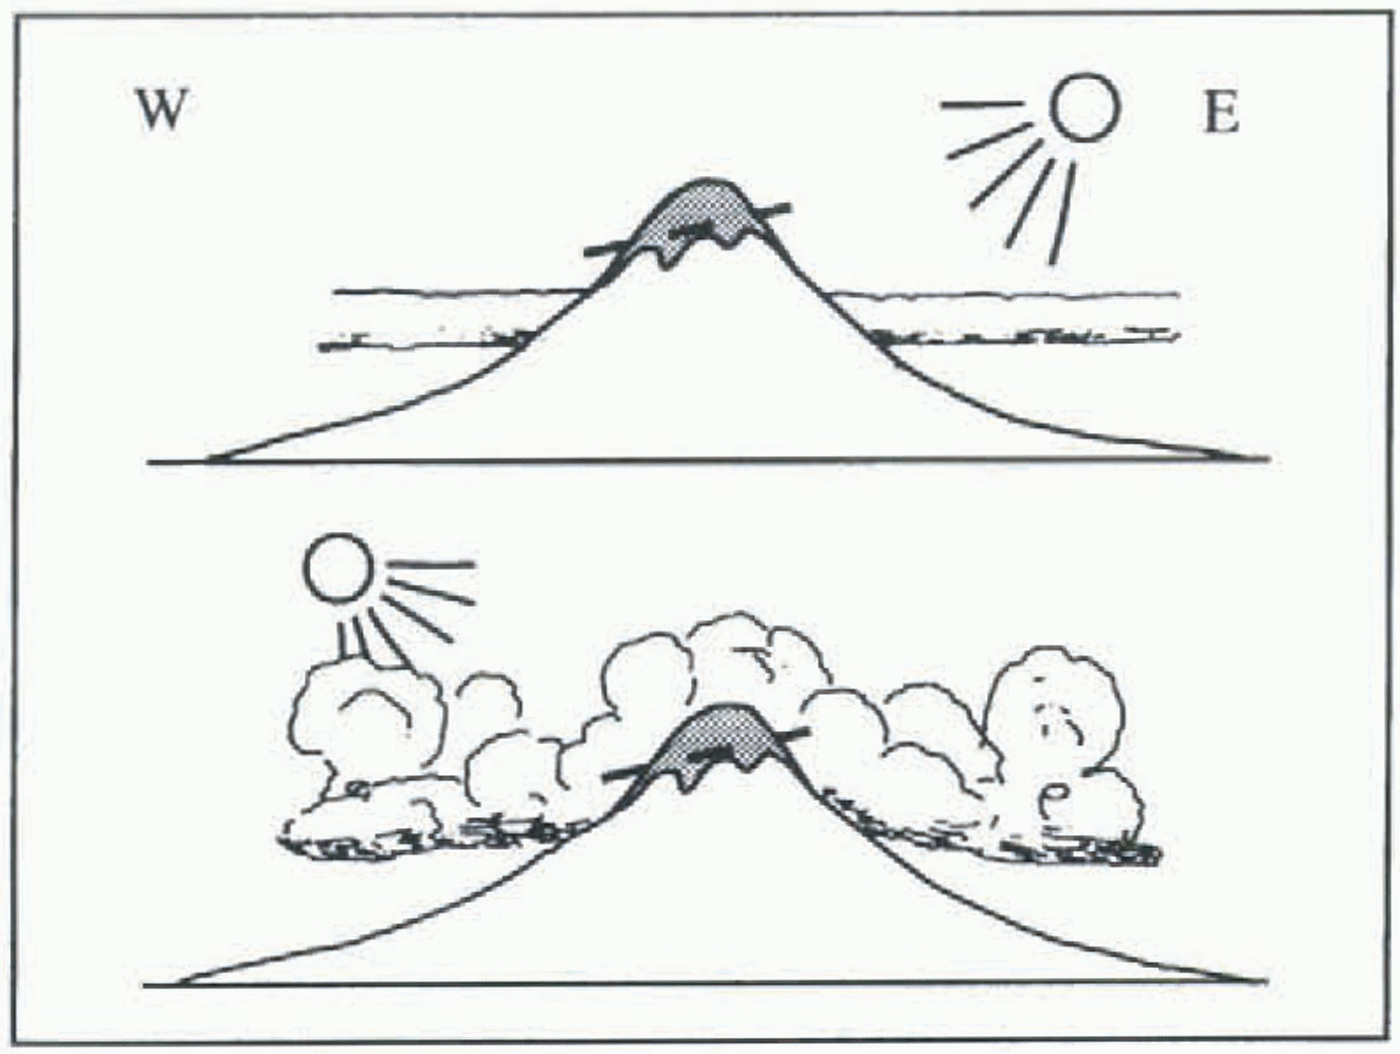
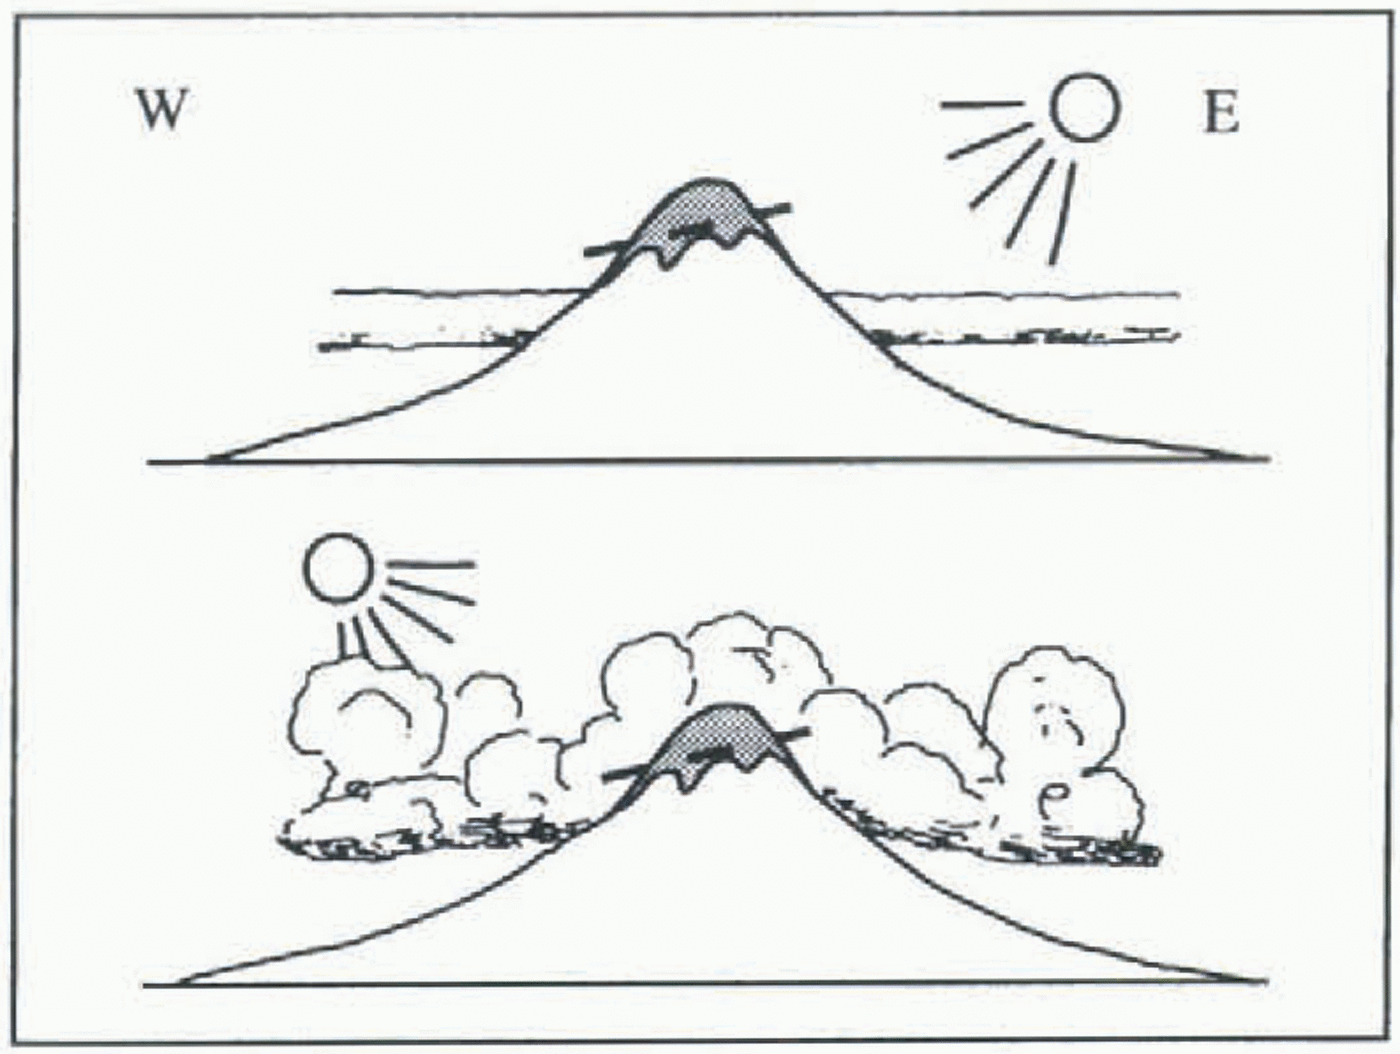
(b) A superposed diurnal convective circulation system, where convective clouds are better developed in the afternoon, causes a zonal asymmetry in the radiation balance on these mountains and, therefore, also in the ablation conditions of its glaciers (Fig. 7). This leads to generally higher ELAs on the eastern slopes of these mountains and lower positions on the western slopes. This is also typical for other tropical mountains (Troll, 1942; Troll and Wien, 1949; Hastenrath, 1991).
Equilibrium-line altitudes (ELAs) in 1930 and 1950 and their shift (∆ELA 1930–50) across the Santa Cruz–Pucahirca ridge, Cordillera Blanca, Peru, under the aspect of exposure (m)
ELAs in 1930 and 1950 and ∆ELAs 1930–50 in the six basins of the Santa Cruz–Pucahirca range.
Schematic model of the superposition of advective and connective processes over the tropical Cordillera Blanca.
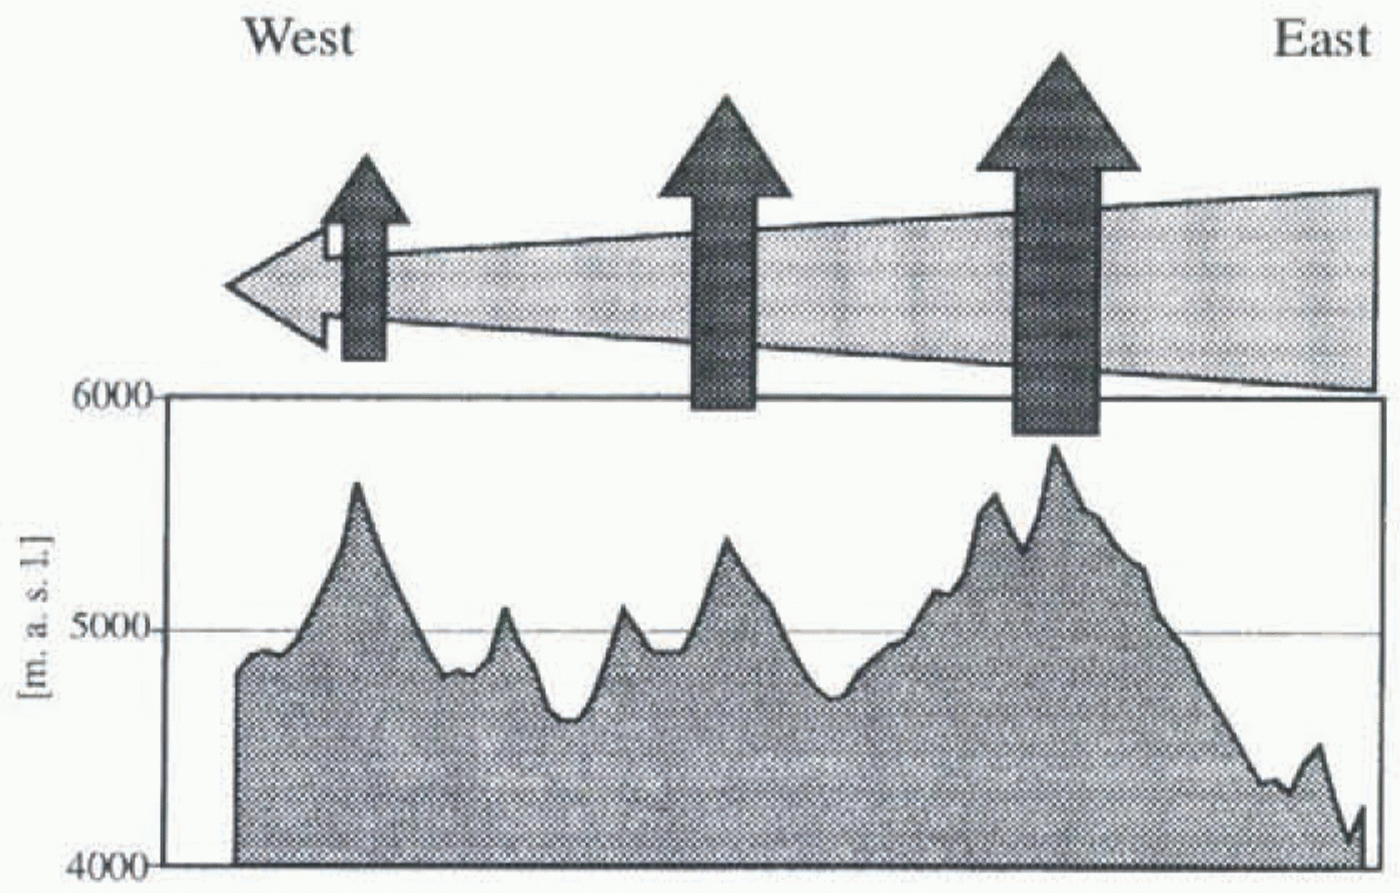
The influence of (a) decreases from east to west, giving more and more weight to the influence of the daily circulation (b). Whereas (a) explains the rise in ELAs from east to west in general as well as on the easternmost Nevado Pucahirca, (b) is responsible for the inverse asymmetry on the Nevados Alpamayo and Santa Cruz in the western part of the massif.
Because of the lack of climatic records, these hypotheses cannot be directly checked. Therefore, an approximation will be made by estimating values of climatological variables which could explain the respective spatial differences of the ELA. The ELA–climate model by Kuhn (1989) is used to calculate alternative simplified climatic changes compatible with the observed fluctuation of ELA. The particular constants and variables for the Cordillera Blanca are discussed in Kaser and others (1996b). The results obtained for 1930 are shown in Table 3.
Diurnal variations of cloudiness and the resulting asymmetry of the glacier extension on a tropical mountain (after Troll and Wien, 1949).
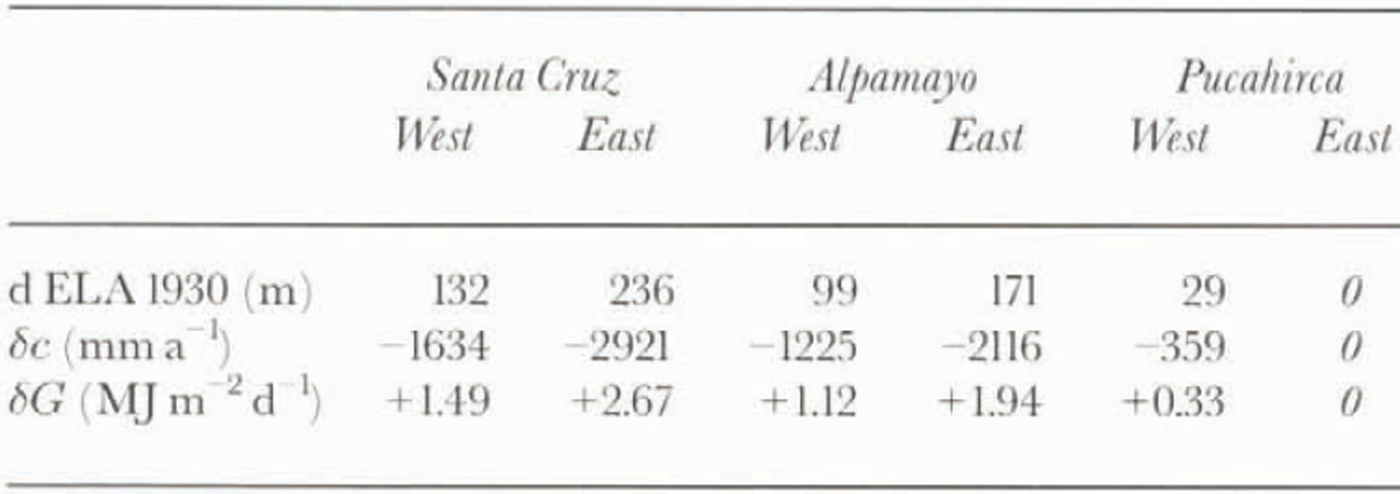
Spatial differences in ELA 1930 referring to Pucahirca east and alternatively requested values for differences in accumulation (δc) and effective global radiation (δG)
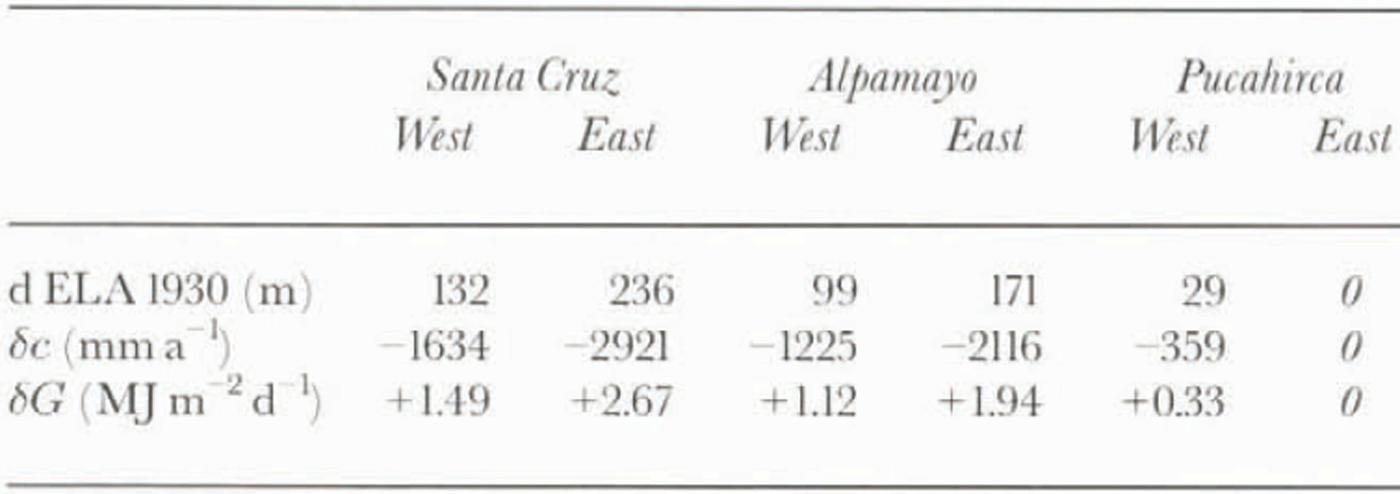
The required differences in accumulation of up to almost 3000 mm seem obviously too high. Annual precipitation on the western slopes of the Cordillera Blanca at 5000 m a.s.l. is estimated to be approximately 1200 mm (Niedertscheider, 1990); the highest values east of the Cordilleras reach approximately 3000 mm (Tingo Maria, 665 m a.s.l.: 3072 mm; Johnson, 1976).
Additionally, differences in effective global radiation mainly due to different degrees of cloudiness can be taken into account. If we consider a mean daily effective global radiation of approximately 15 MJ m−2 d−1 (Wagner, 1979) which is the July mean value for Hintereisferner, Austria, the 2.67 MJ m−2 d−1 required for Santa Cruz East is 18% of that value. The altitude of the sun at Hintereisferner (47° N) in July is close to the mean value for the dry season in the Cordillera Blanca (9° S). The combination of these two variables, precipitation and effective global radiation, can explain both the pattern and the amount of spatial differences of ELAs.
The ∆ELA1930–50, its Spatial Variations and Possible Causes
Table 2 and Figure 5 also show the shift of the mean ELA between the two quasi-stationary situations (∆ELA1930–50). The shift is again not homogeneous and shows spatial differences similar to those of the ELAs:
the values increase generally from east to west;
on Alpamayo and on Santa Cruz the ∆ELA is larger on their eastern slopes.
Assuming that possible secular changes in air temperature on a mesoclimatological scale are widely homogeneous in space, they cannot hold for the explanation in this case.
It is suggested that a reduction in air humidity and its effect on the above-mentioned atmospheric circulation system is the main reason for the determined retreat of the glaciers between 1930 and 1950. It influences the mass balance in various respects. It causes a general reduction of precipitation amounts mainly during the wet season and therefore a decrease in accumulation. A reduction of the convective clouds increases the incoming global radiation and, consequently, the ablation mainly in the afternoon and, therefore, on the western slopes. This effect is most significant during the dry season, and obviously the basins which are already drier react more sensitively to a disturbance in air humidity (table 2). Even more complex feedbacks to sublimation and lapse rates may be expected, but cannot be quantified.
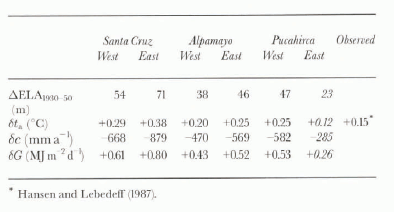
Again, climatological records for proving the cause of different AELAs1930−50 are not available and only a model-based approximation can be offered (table 4). The rise of the ELA due to a change in air temperature has to be considered uniform in space. This is especially valid for the climate in the tropics which is, in contrast to the midlatitudes with the travelling synoptic patterns of different air masses, determined by homogeneous air-mass characteristics. Thus, only a “basis” value of the obtained AELAS1930−50, i.e. the lowest value on Pucahirca east (23 m) as a maximum, can be related to a change in air temperature. Following the ELA–climate model of Kuhn (1989), this would have to be 0.12°C which, in fact, corresponds with the observed secular rise of 0.15°C in the tropics of the Southern Hemisphere between 1920 and 1945 (Hansen and Lebedeff, 1987). The remaining part of AELA1930−50 is quite different for each of the six basins and has, therefore, to be forced by climatic parameters which can vary markedly within the investigation area. This is the fact with precipitation, global radiation and sublimation which are all related to the air humidity. A quantitative estimation is shown for one example: 33% of the maximum value of AELAs1930−50 = 71 m at Santa Cruz east can be explained by the “basis” rise due to an increase in air temperature of 0.12°C. The rest could be caused by an increase in effective global radiation of 0.4 MJ m−2 d−1 which is 2.7% of 15 MJ m−2 d−1 (approximate daily average; see above) plus a decrease in accumulation of 155 mm a−1. This is less than 13% of the 1200 mm a−1 precipitation at 5000 m a.s.l. on the western slopes of the Cordillera Blanca (Niedertscheider, 1990). The concept of precipitation change is compatible with a rainfall decrease between the start of the 20th century and the 1930s which Kraus (1955) found throughout most of the tropics.
The quantitative approach proposes realistic values of a combination of changes in precipitation and effective global radiation. Eventual changes in sublimation, albedo of the glacier surface and atmospheric lapse rate due to changes in air humidity are neglected. The highly significant correlation between global radiation and the retreat of Mount Kenya glaciers (Kruss and Hastenrath, 1990) as well as the differential retreat of Speke Glacier on Ruwenzori, Uganda (Kaser and Noggler, 1991), indicates that changes in air humidity are generally important factors for tropical glacier fluctuations.
Conclusions
As suggested before, the ELA is lowest in the east of Pucahirca and increases generally towards the west (Kinzl, 1942), whereas the ELAs of Santa Cruz and Alpamayo in the western part of the massif show an opposing trend. An east–west accumulation gradient and different amounts of
Spatial differences in ∆ELA 1930−50 and alternatively requested values for differences in air temperature (δt a ) accumulation (δc) and effective global radiation (δG)
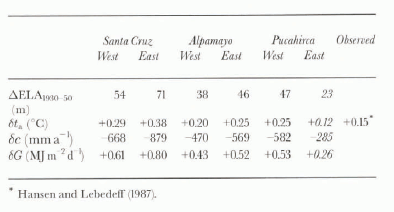
effective global radiation are the probable causes. A superposition of a tropical diurnal circulation to the general advection of humidity from the Amazon river basin can explain this.
A marked recession took place from one quasi-stationary situation around 1930 to a second one which started around 1950.
The rise of the equilibrium-line ALLA1930−50 shows different values across the Santa Cruz–Pucahirca massif. A combination of a spatially uniform rise in air temperature and a decrease in air humidity with spatially different effects has to be taken into account as a cause of the glacier retreat between 1930 and 1950.
Acknowledgements
We would like to thank the Unidad de Glaciología e Hidrología in Huaraz, Peru, for unpublished glaciological and climatological data. We are also indebted to H. Kerschner, E. Schlosser, G. Seltzer and an anonymous reviewer for critical suggestions.