Introduction
Over the past decade, there has been a shift toward accepting that attention-deficit/hyperactivity disorder (ADHD) is a neuropsychologically heterogeneous condition (Faraone et al. Reference Faraone, Asherson, Banaschewski, Biederman, Buitelaar, Ramos-Quiroga, Rohde, Sonuga-Barke, Tannock and Franke2015). This is based on evidence demonstrating that individuals with ADHD display strikingly different profiles of impairment across neuropsychological domains (Coghill et al. Reference Coghill, Seth and Matthews2014). Scientifically, this has been important as it has led to the emergence of multiple pathway models of ADHD pathophysiology. The dual pathway model (Sonuga-Barke, Reference Sonuga-Barke2002), the first such account published, for instance, hypothesized two distinct neuro-developmental pathways to ADHD, one implicating alterations in dorsal front-striatal circuits and marked by deficits in executive function (EF) and a second implicating disrupted ventral rewards circuits and marked by delay aversion (DA) – a motivational orientation that leads individuals to escape or avoid delay (Sonuga-Barke et al. Reference Sonuga-Barke, Taylor, Sembi and Smith1992; Marco et al. Reference Marco, Miranda, Schlotz, Melia, Mulligan, Muller, Andreou, Butler, Christiansen, Gabriels, Medad, Albrecht, Uebel, Asherson, Banaschewski, Gill, Kuntsi, Mulas, Oades, Roeyers, Steinhausen, Rothenberger, Faraone and Sonuga-Barke2009). Since its inception, this model has been extended to encompass three (Sonuga-Barke et al. Reference Sonuga-Barke, Bitsakou and Thompson2010) and then six (Coghill et al. Reference Coghill, Seth and Matthews2014) pathways and inspired other multiple pathway accounts. The shift in perspective is also important clinically because it suggests that tailored treatment may be needed that allow for the more effective targeting of the particular pattern of underlying impairment seen in specific patients. For instance, a patient with EF deficits may benefit from computerized training in executive control skills while those with DA should respond to DA training.
Initially evidence for heterogeneity came from the finding that different domains of neuropsychological impairment within ADHD were dissociable – for instance, Solanto et al. (Reference Solanto, Abikoff, Sonuga-Barke, Schachar, Logan, Wigal, Hechtman, Hinshaw and Turkel2001) found DA and EF deficits to be uncorrelated but independently associated with ADHD. Researchers have since taken this way of thinking to the next step – by proposing that ADHD populations can be divided up into sub-groups with distinct neuropsychological profiles, that is, one with EF deficits, one with DA, one with EF deficits plus DA and one without EF deficits or DA. However, studies vary considerably with respect to the proportion of individuals found in a given sub-group and whether a ‘pure’ DA sub-group is identified (Sonuga-Barke et al. Reference Sonuga-Barke, Dalen and Remington2003, Reference Sonuga-Barke, Bitsakou and Thompson2010; Nigg et al. Reference Nigg, Willcutt, Doyle and Sonuga-Barke2005; Karalunas & Huang-Pollock, Reference Karalunas and Huang-Pollock2011; Sjöwall et al. Reference Sjöwall, Roth, Lindqvist and Thorell2013).
Such studies have typically operationalized neuropsychological deficits in categorical terms with some individuals meeting certain thresholds defined as having a deficit and those not meeting that threshold as impairment free. Furthermore, the thresholds used have been arbitrary – cut-offs equivalent to the top 10% of impaired individuals within the normal population. While such an approach has the benefit of being clinically intuitive it lacks a solid empirical foundation, which potentially biases analyses toward finding pure neuropsychologically impaired sub-groups. In this paper, we adopt a different approach to the task of neuropsychological sub-grouping – latent profile analysis (LPA). This is a statistical method for identifying homogeneous sub-groups of participants (latent classes) who share similar patterns of observed scores such as those from neuropsychological tasks. This method has been used recently to successfully identify neuropsychological sub-groups in ADHD. Gomez et al. (Reference Gomez, Gomez, Winther and Vance2014) found three working memory (WM) sub-groups differentiated primarily by the level of performance. Rajendran et al. (Reference Rajendran, O'Neill, Marks and Halperin2015) found a weak attention/EF sub-group and a pervasive neuropsychological dysfunction sub-group. Rommelse et al. (Reference Rommelse, van der Meer, Hartmann and Buitelaar2016) identified four sub-groups that mainly differed in their speed–accuracy tradeoffs. Finally, van Hulst et al. (Reference van Hulst, de Zeeuw and Durston2015) found a sub-group with poor cognitive control and one with poor timing. Reward mechanisms were only examined in the latter study, where no evidence for a sub-group with reward processing problems was found.
In the current study, we extend the use of LPA to see if distinct classes with DA and EF deficits can be identified in the ADHD population. The current study had a number of strengths compared with previous studies of neuropsychological heterogeneity. First, we employed multiple tasks within the EF and the DA domains and applied confirmatory factor analysis (CFA) to obtain ‘purer’ latent variables. Second, the children were all medication-naïve. Third, we attempted to validate any sub-groups found by comparing them in terms of a range of clinically relevant correlates. Odor identification was examined because of the proposed association between this ability and orbitofrontal cortex integrity (Killgore et al. Reference Killgore, Mcbride, Killgore, Balkin and Kamimori2008). As DA is hypothesized to implicate ventral regions, distinct DA and EF sub-groups may differ with respect to odor identification. A questionnaire-based EF assessment was included because it is hypothesized to capture other facets of EF than the more fine-grained controlled task-based assessment, specifically the child's ability to problem-solve in everyday situations (Huizinga & Smidts, Reference Huizinga and Smidts2011; Toplak et al. Reference Toplak, West and Stanovich2013) and possibly task-based sub-groups will differ with respect to this EF facet. ADHD behavior as well as comorbidity were also examined. Finally, the study included a large sample of unaffected individuals so that the results could be examined as a function of ADHD.
The current study, therefore, had three major aims. The first aim was to determine whether EF and DA are dissociable constructs, by testing alternative models using CFA based on EF and DA tasks. The second aim was to test for the existence of distinct homogeneous neuropsychological classes using LPA. The final aim was to investigate the external validity of the neuropsychological sub-groups identified, by testing for differences in terms of ADHD symptomatology, questionnaire-based EF, and odor identification.
On the basis of prior work, we hypothesized that (i) EF and DA would be dissociable and that (ii) LPA would result in at least three ADHD sub-groups – one with ‘pure’ EF deficits, one with ‘pure’ DA, and one with EF deficits plus DA. No formal hypotheses were formulated regarding potential sub-group differences due to inconclusive previous research.
Methods
Participants
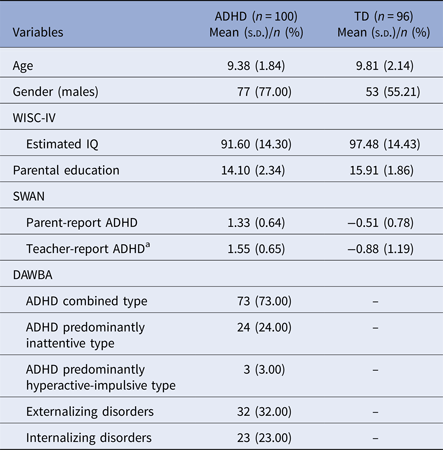
Over a period of 2 years, all children (n = 308) between ages 6 and 14 years, consecutively referred to an ADHD specialist clinic at a Danish public regional child and adolescent psychiatric hospital for a diagnostic assessment of ADHD were invited to participate in the study together with their parents. Almost half of the invited families (n = 137) agreed to participate. To be included in the present study the children had to meet DSM-IV criteria for an ADHD diagnosis (n = 129) based on the Development and Well-Being Assessment (DAWBA; Goodman et al. Reference Goodman, Ford, Richards, Gatward and Meltzer2000). The DAWBA (a structured diagnostic parent interview and a teacher questionnaire) was administered by a psychologist or a doctor and integrated and reviewed by a child and adolescent psychiatrist as part of the clinical examination at the hospital. Children with pervasive developmental disorders (n = 12), an IQ below 70 (n = 6), or a history of treatment with psychotropic medicationFootnote †Footnote 1 (n = 10) were excluded, as was one member of one sib-pair, leaving a final sample of 100 children. The medication status of the children at the time of the study was due to the fact that pharmacological treatment is not initiated until after the diagnostic assessment at the hospital. Demographic characteristics are presented in Table 1.
Demographic characteristics

DAWBA, Development and Well-Being Assessment; Externalizing disorders, conduct disorder, oppositional defiant disorder; Internalizing disorders, specific phobia, social phobia, obsessive-compulsive disorder, generalized anxiety disorder, separation anxiety disorder, anxiety disorder NOS, depression, depressive disorder NOS; SWAN, Strengths and Weaknesses of ADHD-Symptoms and Normal-Behavior; TD, typically developing; WISC-IV, Wechsler Intelligence Scale for Children, 4th edition.
a Missing teacher questionnaires (nine in ADHD group; 50 in TD group).
A total of 120 same-age controls attending schools located within the same region as the hospital agreed to participate. According to parent reports, none of these children had previous or current psychiatric diagnoses or use of psychotropic medication. Children with an IQ below 70 (n = 2), impaired vision (n = 1), or missing parent questionnaires (n = 2), as well as 19 siblings, were excluded, leaving 96 children in the control sample. One child met thresholds on the Strengths and Weaknesses of ADHD-Symptoms and Normal-Behavior (SWAN; Swanson et al. Reference Swanson, Schuck, Mann, Carlson, Hartman and Sergeant2001), but was not excluded in order to obtain a representative control sample.
Families were contacted via mail through the hospital or schools. Children with ADHD were tested at the hospital in two sessions each lasting approximately 1.5 h, whereas typically developing children were tested at the local university/school in one session lasting approximately 2.5 h. Questionnaires were distributed to parents at the child's test session and sent to teachers via mail. The children earned small prizes (e.g. stationery and coins) on some tasks and a small present at the end of the test session. The study was approved by the Danish regional ethics committee and informed consent was obtained from the participants.
Ethical standards
The authors assert that all procedures contributing to this work comply with the ethical standards of the relevant national and institutional committees on human experimentation and with the Helsinki Declaration of 1975, as revised in 2008.
Measures
Tasks
The neuropsychological test battery consisted of nine EF (three WM, three shifting [SH], and three response inhibition [IN]) tasks and three DA tasks. One outcome per task was selected a priori and based on previous research involving the specific task (see below) and/or meta-analyses (see, e.g. Willcutt et al. Reference Willcutt, Doyle, Nigg, Faraone and Pennington2005) as well as previous research on the organization of EF and DA (e.g. Miyake et al. Reference Miyake, Friedman, Emerson, Witzki and Howerter2000; Huizinga et al. Reference Huizinga, Dolan and van der Molen2006; Coghill et al. Reference Coghill, Seth and Matthews2014). All outcome measures were transformed such that lower scores were indicative of poorer performance (task details are provided in online Supplementary Table S1).
Working memory
Tic Tac Toe (Huizinga et al. Reference Huizinga, Dolan and van der Molen2006). The respondent indicated when a visual target pattern was reproduced. Outcome: Mean accuracy.
Mental Counters (Huizinga et al. Reference Huizinga, Dolan and van der Molen2006). The respondent kept track of the numerical value of two independent counters. Outcome: Mean accuracy.
Finger Windows Backwards (Bedard & Tannock, Reference Bedard and Tannock2008). The respondent indicated the reverse sequential placement of a series of holes in a card. Outcome: Total accuracy.
Shifting
Local–Global (LGT; Huizinga et al. Reference Huizinga, Dolan and van der Molen2006). The respondent switched between rule sets (local v. global). Outcome: Median reaction time (RT) in milliseconds (ms).
Dots-Triangles (DOT; Huizinga et al. Reference Huizinga, Dolan and van der Molen2006). The respondent switched between rule sets (up-down v. left–right). Outcome: Median RT in ms.
Trail Making Test (Reitan, Reference Reitan1971). The respondent switched between consecutive numbers and letters. Outcome: Total RT in ms.
Response inhibition
Flanker Task (Huyser et al. Reference Huyser, Veltman, Wolters, de Haan and Boer2011). The respondent focused on a central arrow while ignoring either congruent or incongruent peripheral arrows. Outcome: Total accuracy on incongruent trials.
Stop-signal task (SST; Williams et al. Reference Williams, Ponesse, Schachar, Logan and Tannock1999). The respondent responded to a visual go signal but refrained from responding when an auditory stop signal was presented. Outcome: Mean stop-signal RT in ms.
Walk Don't Walk from the Test of Everyday Attention of Children (Manly et al. Reference Manly, Robertson, Anderson and Nimmo-Smith1999). The respondent responded to one auditory (go) signal but refrained from responding to a different auditory (no-go) signal. Outcome: Total accuracy.
Delay aversion
Choice-Delay Task (C-DT; Sonuga-Barke et al. Reference Sonuga-Barke, Taylor, Sembi and Smith1992; Solanto et al. Reference Solanto, Abikoff, Sonuga-Barke, Schachar, Logan, Wigal, Hechtman, Hinshaw and Turkel2001). The respondent chose between a small immediate reward and a larger delayed one. Outcome: Percent short small rewards.
Maudsley's Index of Childhood Delay Aversion (MIDA; Kuntsi et al. Reference Kuntsi, Oosterlaan and Stevenson2001). The respondent chose between shooting one spaceship (yielding a small immediate reward) or two spaceships (yielding a larger delayed reward). Outcome: Percent short small rewards.
Delay Frustration Task (DeFT; Bitsakou et al. Reference Bitsakou, Antrop, Wiersema and Sonuga-Barke2006). The respondent solved a series of math questions with incorporated delays. Outcome: Mean total duration in ms.
General cognitive function
Vocabulary and Matrix Reasoning from the Wechsler Intelligence Scale for Children, 4th edition (Wechsler, Reference Wechsler2003) were applied to estimate general cognitive function.
Questionnaires and odor identification test
This battery included a background questionnaire about the parents’ educational level (years) applied as an indicator of socioeconomic status (SES), the SWAN (Inattention and Hyperactivity/impulsivity scales; Swanson et al. Reference Swanson, Schuck, Mann, Carlson, Hartman and Sergeant2001), and the Behavior Rating Inventory of Executive Function (BRIEF; WM, Shift, and Inhibit scales; Gioia et al. Reference Gioia, Isquith, Guy and Kenworthy2000) which measures DSM congruent ADHD behavior and EF behaviors in children respectively. The Brief Smell Identification Test (BSIT; Doty, Reference Doty2001) was applied as a test of olfactory function in the child. Means were applied in the questionnaire analyses, whereas a total number of errors was examined in the odor identification test. In both cases, higher scores were indicative of more perceived difficulties (questionnaire details and a description of the odor identification test are provided in online Supplementary Table S1). Information on child comorbidity was based on the DAWBA. The correlations between the BRIEF scales and the EF tasks are provided in online Supplementary Table S2.
Data preparation
Missing task-data at case level (<1%) resulted from apparatus malfunction etc. If the accuracy of performance on the LGT, the DOT, and the SST go task was lower than expected by chance, these values were coded as missing, as were blocks on the SST if inhibition occurred on fewer than 20% or more than 80% of stop trials. Following Huizinga et al. (Reference Huizinga, Dolan and van der Molen2006) trials on tasks with an RT outcome were excluded if they were incorrect, preceded by an incorrect response, shorter than 100 ms, or more than 2.5 s.d. from the mean for the individual child and task. The missing data and the data removed as a result of the subsequent trimming procedures ranged between 0 and 9% depending on the task. There were no missing parent questionnaires, but questionnaires from 59 teachers (nine in the ADHD group; 50 in the control group) and the BSIT from two children with ADHD were missing. There were <1% missing data at the item level.
Analysis
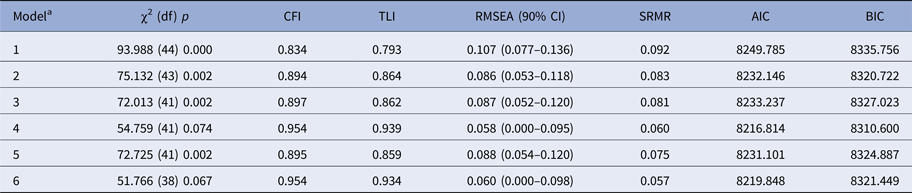
First, the latent structure of EF and DA was tested using CFA. Six alternative models were specified and tested (see online Supplementary Fig. S3). The latent variables were specified to be correlated and all error variances were uncorrelated. Model parameters were estimated using robust maximum likelihood (MLR) using all available data. Model fit was assessed using the chi-square statistic (χ2), the comparative fit index (CFI), the Tucker–Lewis index (TLI), the root-mean-square error of approximation (RMSEA), the standardized root-mean-square residual (SRMR), the Akaike information criterion (AIC), and the Bayesian information criterion (BIC). A non-significant χ2, CFI and TLI values above 0.95, and RMSEA and SRMR values below 0.08 indicate reasonable fit. AIC and BIC are used to compare competing models with lower values indicating better fit. A difference >10 between two BIC values was considered indicative of a ‘significant’ difference (Raftery, Reference Raftery1995). Finally, parsimony was considered when selecting the best model.
Second, LPA was conducted on the factor scores. Age, SES, and IQ were entered as covariates as they have each been associated with neuropsychological performance (Brydges et al. Reference Brydges, Reid, Fox and Anderson2012; Hackman et al. Reference Hackman, Gallop, Evans and Farah2015). LPA models with two to six classes were estimated. Model fit was assessed using the likelihood ratio chi-square (LRχ2), the AIC, the BIC, entropy values, and the Lo–Mendell–Rubins adjusted likelihood ratio test (LMR-A). AIC and BIC values were interpreted as before. The AIC and BIC values were also taken into consideration when evaluating the improvement made by adding an additional class as a small difference is considered indicative of little model improvement (DiStefano & Kamphaus, Reference DiStefano and Kamphaus2006). Entropy values greater than 0.80 indicate acceptable classification accuracy (Burnham & Anderson, Reference Burnham and Anderson2004). The LMR-A is used to compare models with increasing numbers of latent classes. A non-significant value (p > 0.05) suggests that the model with one less class should be accepted (Lo et al. Reference Lo, Mendell and Rubin2001). Again parsimony was taken into consideration when selecting the best solution.
Finally, χ2 and one-way analysis of variance tests were applied to examine potential sub-group differences. Post hoc tests were (Bonferroni) adjusted for multiple testing.
CFA and LPA were carried out using Mplus 7.4 (Muthén & Muthén, Reference Muthén and Muthén1998–2016). IBM SPSS Statistics V24.0 (IBM Corp, 2016) was applied when comparing sub-groups.
Consistent with the previous research within the field (e.g. van Hulst et al. Reference van Hulst, de Zeeuw and Durston2015) and to be able to address neuropsychological function in ADHD specifically, children with ADHD and typically developing children were examined separately.
Results
Confirmatory factor analysis
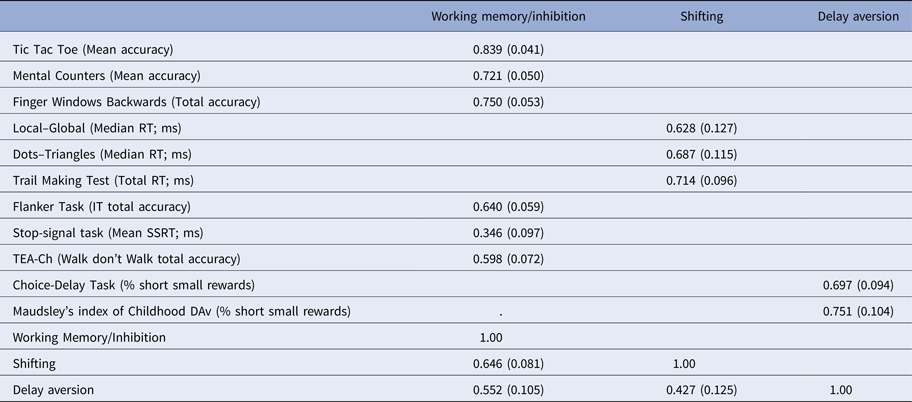
One indicator of DA (the DeFT) was unrelated to the other two (C-DT and MIDA) with non-significant correlations of 0.117 and 0.093 in the ADHD group (and 0.090 and 0.148 in the control group) and was excluded from further analysis. The fit statistics from the CFA based on the ADHD sample are reported in Table 2. Models 4 and 6 clearly fitted the data better than the other models as both had a non-significant χ2, a CFI value above 0.95, a TLI value of 0.93, and RMSEA and SRMR values below 0.08. The values for the AIC and the BIC were lower for Model 4 than Model 6 and the difference between the BIC values was greater than 10. Furthermore, Model 4 was more parsimonious (having fewer parameters) than Model 6. On this basis, Model 4 with three factors (WMIN, SH, and DA) was considered to be the ‘best’ model. Factor loadings and factor correlations for Model 4 are presented in Table 3. The factor loadings were statistically significant and ranged from 0.346 to 0.839. The factor correlations were statistically significant with absolute values ranging from 0.427 to 0.646. Model 4 was also considered the ‘best’ model when tested with typically developing children (χ2 = 43.445, df = 41, p = 0.368; CFI = 0.989; TLI = 0.985; RMSEA = 0.025, 90% CI = [0.000–0.076]; SRMR = 0.056; AIC = 8090.636; BIC = 8182.953; see online Supplementary Tables S4 and S5)Footnote 2. Finally, standardized factor scores for each latent variable were calculated based on Model 4.
Fit statistics for the CFA for children with ADHD

AIC, Akaike information criterion; BIC, Bayesian information criterion; χ2, Chi-square; CFI, comparative fit index; CI, confidence interval; RMSEA, root mean square error of approximation; SRMR, standardized root mean square residual; TLI, Tucker Lewis index.
a Model 1, One factor – common neuropsychological function; Model 2, Two factors – executive function and delay aversion; Model 3, Three factors – working memory/shifting, inhibition, and delay aversion; Model 4, Three factors – working memory/inhibition, shifting, and delay aversion; Model 5, Three factors – working memory, shifting/inhibition, and delay aversion; Model 6, Four factors – working memory, shifting, inhibition, and delay aversion.
Factor loadings (standard error) and factor correlations (standard error) for Model 4 for children with ADHD

DAv, delay aversion; IT, Incongruent trials; ms, millisecond; RT, reaction time; SSRT, Stop-signal reaction time; TEA-Ch, Test of Everyday Attention for Children.
Latent profile analysis
When tested with children with ADHD (see Table 4) the four class solution had a statistically significant LMR-A value and a high entropy value (>0.80). This solution also had the lowest BIC value and a negligible lowering of the AIC value from the four to the six class solution. Based on these results and taking parsimony into account, the four class solution was considered the ‘best’ solution. The three class solution was considered ‘best’ for typically developing children as it had a significant LMR-A value, a high entropy value, and the lowest BIC value (LRχ2 = −221.465; AIC = 482.931; BIC = 534.218; Entropy = 0.933; LMR-A = 67.773, p = 0.010; see online Supplementary Table S6).
Fit statistics for the LPA with covariates age, SES, and IQ for children with ADHD

LRχ2, the likelihood ratio chi-square; AIC, Akaike information criterion; BIC, Bayesian information criterion; LMR-A, Lo–Mendell–Rubins adjusted likelihood ratio test.
The performance profiles for the four classes in the ADHD group are illustrated in Fig. 1a. Inspection of the classes suggested that Class 1 (n = 32) represented children with high WMIN, SH, and DA factor scores. Class 2 (n = 35) included children with average scores. Class 3 (n = 26) included children with low scores and class 4 (n = 7) children with very low scores. The four classes differed significantly (all ps < 0.00001 and large effect sizes) with respect to WMIN, SH, and DA performance, suggesting that they constituted different severity levels along a skewed underlying continuum rather than qualitatively distinct subgroups. This pattern was reproduced when the control group was examined (Fig. 1b)Footnote 3.
LPA classes and factor score means for children with ADHD (a) and for typically developing children (b).

Sub-group comparisons
The four ADHD classes differed significantly (all ps < 0.05 and medium to large effect sizes) with respect to inattention (parent-report), hyperactivity-impulsivity (parent- and teacher-report), WM behavior (teacher-report), SH and IN behavior (parent-report), and odor identification. In all instances, post hoc analyses indicated that one or more classes with lower WMIN, SH, and DA factor scores (indicative of poorer performance) obtained higher ratings (indicative of more perceived difficulties) on the SWAN and the BRIEF scales and identified fewer odors correctly than one or more classes with higher factor scores. There were no significant associations between class and any type of comorbidity (externalizing or internalizing disorders; online Supplementary Table S7). The three classes in the typically developing group differed significantly (all ps < 0.05 and medium effect sizes) with respect to WM and SH behavior (parent-report) as well as odor identification (again classes with lower factor scores obtained higher parent-ratings and identified fewer odors; online Supplementary Table S7). In supplementary analyses, similar latent classes from each sample were comparedFootnote 4 (i.e., ADHD class 1 v. typically developing class 1 etc.) with respect to the correlates. This showed that all ADHD classes had significantly higher levels of ADHD and EF behavior than the corresponding typically developing classes (all ps < 0.0001 and η 2 ranging from 0.38 to 0.78). Individuals in the ADHD classes also identified fewer odors correctly than individuals in the corresponding typically developing classes, although only the class 1 comparison was statistically significant (p < 0.05, η 2 = 0.07).
Discussion
This study examined the presence of distinct cognitive and motivational sub-groups in children with ADHD using LPA. The key findings were as follows.
First, EF and DA were found to be dissociable constructs. This is consistent with our initial hypothesis and the basic tenets of the dual pathway model (Sonuga-Barke, Reference Sonuga-Barke2002). However, contrary to some previous research (e.g. Solanto et al. Reference Solanto, Abikoff, Sonuga-Barke, Schachar, Logan, Wigal, Hechtman, Hinshaw and Turkel2001), they were not found to be unrelated as the DA factor correlated moderately with each of the two EF factors (ranging from 0.427 to 0.552 in the ADHD group). While the nature of this relationship is less clear, it may be one where DA influences learning over time thereby hindering cognitive development (Sonuga-Barke, Reference Sonuga-Barke2002). This idea has received some support as DA has been found to predict WM scores for school-age children with and without ADHD (Karalunas & Huang-Pollock, Reference Karalunas and Huang-Pollock2011). To determine whether DA and EF are less associated in younger children and become increasingly interrelated over the course of development, future studies should examine preschool samples and follow them longitudinally.
Second, the LPA supported the presence of four ADHD sub-groups distinguished by the level of neuropsychological performance (ranging from high to very low), but not in terms of the relative levels of EF and DA performance. Consequently, there was no evidence for a group affected by either ‘pure’ EF deficits or by ‘pure’ DA. This strongly supports neuropsychological heterogeneity in ADHD but at the same time is more consistent with a quantitative rather than a qualitative model of heterogeneity. As distinct EF and DA sub-groups have previously been identified using a categorical approach (e.g. Sonuga-Barke et al. Reference Sonuga-Barke, Dalen and Remington2003; Nigg et al. Reference Nigg, Willcutt, Doyle and Sonuga-Barke2005; Sonuga-Barke et al. Reference Sonuga-Barke, Bitsakou and Thompson2010), this was a surprising finding. It is unlikely that the heterogeneity in findings is explained by some unique characteristic of the current ADHD sample. While the children were medication-naïve, their medication status reflected the fact that any medication initiation occurred after the examination at the hospital as is practice in Denmark and not their degree of ADHD. The sample had an ADHD subtype distribution, a gender distribution, a mean group IQ, and a comorbid profile comparable with what is traditionally reported in the ADHD literature for this age group suggesting that the children included in the present study constituted a representative ADHD sample. Further, IQ and SES were included as covariates in our LPA models, but this does not appear to be the reason why no distinct EF and DA sub-groups were found, as running the analyses without the covariates also yielded a quantitative model. Possibly, traditional categorical sub-grouping based on a thresholding method identifies the most impaired individuals on a given measure (relative to controls), but not necessarily those individuals who have the most in common ‘neuropsychologically-speaking’. By comparison, this may be the strength of LPA, as this approach identifies sub-groups of children who are similarly based on a number of characteristics (such as neuropsychological performance) and without using a control group as a reference point or a priori cut-offs. Rather, LPA makes no a priori assumptions about the number of classes as they are decided upon based on objective statistical criteria. With respect to the results from our LPA, it is important to note that although EF and DA appear to go hand in hand this implies neither unity of domains nor primacy of one over the other. It is possible that EF and DA are supported by different neural pathways and make distinctive contributions to child development and ADHD, but do so concomitantly in school-age.
Recently, Gomez et al. (Reference Gomez, Gomez, Winther and Vance2014) also found a continuum when applying LPA to examine WM performance in ADHD. However, other studies applying empirical approaches such as LPA have identified qualitative differences in neuropsychological performance in ADHD when examining domains such as response variability (Fair et al. Reference Fair, Bathula, Nikolas and Nigg2012), processing speed (Bergwerff et al. Reference Bergwerff, Luman, Weeda and Oosterlaan2017), timing (van Hulst et al. Reference van Hulst, de Zeeuw and Durston2015), or speed-accuracy tradeoffs (Rommelse et al. Reference Rommelse, van der Meer, Hartmann and Buitelaar2016) and it is possible that inclusion of these domains would have resulted in qualitatively distinct sub-groups in the present study. Van Hulst et al. (Reference van Hulst, de Zeeuw and Durston2015) examined reward sensitivity using an anticipation paradigm, but did not find a sub-group with poor reward sensitivity. By comparison, Mostert et al. (Reference Mostert, Hoogman, Onnink, van Rooij, von Rhein, van Hulzen, Dammers, Kan, Buitelaar, Norris and Franke2015) found a sub-group with impaired delay discounting when examining an adult sample. The different results found in sub-grouping studies may be mainly attributable to the use of different task paradigms, dissimilar outcomes (e.g. accuracy v. RTs), varying levels at which the variables are measured (e.g. observed v. latent), different statistical approaches, and age-varying samples (e.g. children v. adults). Future studies should attempt to cross-validate previously identified sub-groups using several competing and rigorous methods, and examine their clinical utility over time, for instance as moderators of treatment effects.
Third, we found some evidence for the levels of neuropsychological performance distinguishing the sub-groups based on experimental tasks to be mirrored in the children's levels of ADHD symptoms, (questionnaire-based) EF behavior, and odor identification ability. Olfactory function has been proposed as a biological marker for prefrontal, hippocampal, and dopaminergic function (Killgore et al. Reference Killgore, Mcbride, Killgore, Balkin and Kamimori2008; Schecklmann et al. Reference Schecklmann, Schaldecker, Aucktor, Brast, Kirchgäßner, Mühlberger, Warnke, Gerlach, Fallgatter and Romanos2011; Hagemeier et al. Reference Hagemeier, Woodward, Rafique, Amrutkar, Bergsland, Dwyer, Benedict, Zivadinov and Szigeti2016). Whereas odor identification logically did not differentiate between DA and EF in the present study as qualitatively distinct sub-groups were not found, children with lower levels of neuropsychological performance did identify fewer odors correctly than did children with higher levels. This could be interpreted as suggesting that individuals with lower levels of neurological performance have more compromised brain function. However, the olfactory function has only been examined sporadically in pediatric ADHD (e.g. Karsz et al. Reference Karsz, Vance, Anderson, Brann, Wood, Pantelis and Brewer2008; Romanos et al. Reference Romanos, Renner, Schecklmann, Hummel, Roos, von Mering, Pauli, Reichmann, Warnke and Gerlach2008; Ghanizadeh et al. Reference Ghanizadeh, Bahrani, Miri and Sahraian2012) and more research is clearly needed before any conclusions can be drawn as to the association between olfactory and neuropsychological function in ADHD. Overall, the findings from the sub-group comparisons support the external validity of the identified sub-groups and suggest the presence of a continuum with the most impaired individuals at one end.
Finally, the neuropsychological profiles identified in the ADHD group were replicated in the control group, suggesting that there are also different levels of neuropsychological performance in typically developing children. The idea of neuropsychological heterogeneity in the general population has also received support in previous studies (e.g., Fair et al. Reference Fair, Bathula, Nikolas and Nigg2012; van Hulst et al. Reference van Hulst, de Zeeuw and Durston2015; Rommelse et al. Reference Rommelse, van der Meer, Hartmann and Buitelaar2016; Bergwerff et al. Reference Bergwerff, Luman, Weeda and Oosterlaan2017). Together these results suggest that not only are there similar patterns of heterogeneity across samples, but that some children with ADHD probably have more in common with non-ADHD counterparts than with other children with ADHD with respect to neuropsychological performance – such similarities may potentially inform on risk and protective factors associated with ADHD.
Strengths and limitations
The study has several strengths, including being (to our knowledge) the first time LPA has been applied to examine EF and DA using a choice-delay paradigm in school-age children with ADHD. CFA was applied to obtain ‘purer’ latent variables, just as CFA models were theory-driven and examined based on outcomes from eleven different tasks and one outcome per task. In addition, a large sample of medication-naïve children with ADHD was included in the study. There are also limitations. Due to an amount of missing teacher questionnaires in the control group, results of these analyses should be interpreted with caution. As several neuropsychological sub-groups were identified and some groups included relatively few children, the study may not have had sufficient statistical power to detect additional intergroup differences. However, the intergroup differences that were detected were all in the same direction, which supports the findings.
Conclusions
Sub-grouping based on LPA results in quantitatively rather than qualitatively distinct sub-groups characterized by different levels of neuropsychological performance but similar levels of EF and DA performance at each level. The neuropsychological performance levels distinguishing the sub-groups based on experimental tasks are to some degree mirrored in the children's levels of ADHD symptoms and questionnaire-based EF as well as their ability to identify odors suggesting a continuum with the most impaired individuals at one end. It is possible that a focus on neuropsychological severity may be informative for implementing interventions; that is, the efficacy of interventions that target neuropsychological problems may depend on the level of impairment in the intervention group. Furthermore, examination of neuropsychological heterogeneity in the general population may contribute to the understanding of factors associated with the development of ADHD. As this was the first time EF and DA as measured using a choice-delay paradigm have been examined together using LPA, the results are in need of replication.
Supplementary material
The supplementary material for this article can be found at https://doi.org/10.1017/S0033291717003245
Acknowledgements
The study was supported by research grants from the TRYG Foundation (grant number 7–10-0098, 101183). We thank the children, parents, and teachers, who participated in the study. We also thank Anne Katrine Hansen, Mette Daubjerg, Rikke Hansen, and Jytte Breining for their contribution during the data collection process and the researchers who kindly gave us permission to use their tasks, especially Mariëtte Huizinga.
Declaration of interest
Edmund Sonuga-Barke has received speaker fees, consultancy, research funding, and conference support from the Shire, speaker fees from the American University of Beirut and Janssen Cilag, consultancy from Neurotech solutions, Copenhagen University and Berhanderling, Skolerne, and KU Leuven, and book royalties from OUP and Jessica Kingsley. He is Editor-in-Chief JCPP – supported by a buy-out of time to the University of Southampton and a personal Honorarium. Rosemary Tannock has received honoraria from Shire, Eli Lilly, Medice, and OpoPharma, research support from Pearson-Cogmed, and was a member of the DSM-5 Workgroup for ADHD and Externalizing Disorders. Dorte Damm has received honoraria from the Shire. Per Hove Thomsen has received honoraria from Shire and Medice.